


在本课程中,学习如何利用pandas极其强大的数据处理引擎来充分利用数据。 能够从DataFrame中提取,过滤和转换数据以深入挖掘真正重要的数据非常重要。 pandas库有许多技术可以使这个过程高效直观。 将学习如何通过旋转或融合以及堆叠或取消堆叠DataFrame来整理,重新排列和重构数据。 这些都是成为全面的数据科学家的基础下一步,将学到的所有概念应用于实际数据集。
目录
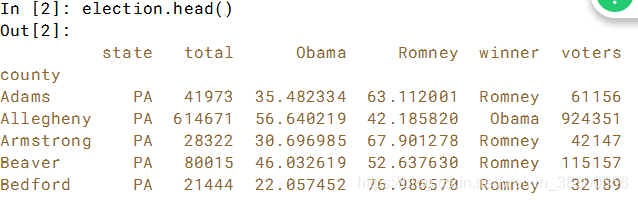
在本章中,将学习如何使用各种数据集对数据框进行索引,切片,过滤和转换,范围从2012年宾夕法尼亚州的美国选举数据到匹兹堡的天气数据。
一、 索引
1.1 位置和标记索引
使用.iloc []和.loc []可以在DataFrame上进行任何数据选择操作。loc是基于标签的,必须根据行和列的标签指定行和列。iloc是基于整数索引的,按其整数索引指定行和列。
# Assign the row position of election.loc['Bedford']: x
x = 4

# Assign the column position of election['winner']: y
y = 4

# Print the boolean equivalence
print(election.iloc[x, y] == election.loc['Bedford', 'winner'])DataFrame切片:列选时,单个方括号里面只能一列,最后得到的Series。双个方括号时,列选多列,最后得到的DataFramne。
行选时,只能用数字直接切片,单括号,得到的是DataFrame。
#列选
print(election['state'].head())
#print(election['state','total'])

print(election[['state']].head())
print(election[['state','total']].head())
#行选
print(election[:2])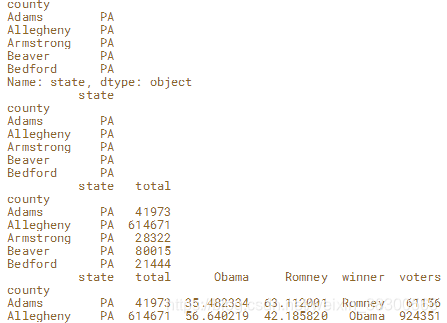
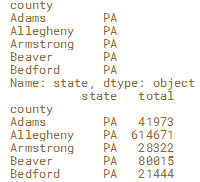
使用.iloc []和.loc [] 列选:单括号是Series,双括号是DataFrame.
行选:单括号最后结果是Series。双括号是DataFrame.
#列选
print(election.loc[:,'state'].head())
print(election.loc[:,['state','total']].head())

print(election.iloc[:,0].head())
print(election.iloc[:,[0,1]].head())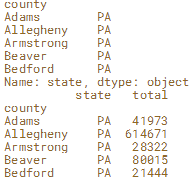
#行选
print(election.loc['Adams'].head())
#print(election.loc['Adams','Allegheny'].head())
print(election.loc[['Adams','Allegheny']].head())

print(election.iloc[0].head())
#print(election.iloc[0,1].head())
print(election.iloc[[0,1]].head())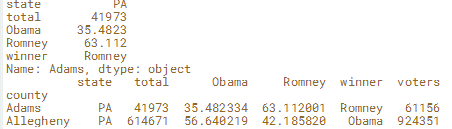

#行选&列选
print(election.loc['Adams','state'])  #一个数
print(election.loc['Adams',['state','total']])
print(election.iloc[0,[0,1]])
print(election.iloc[0,[0,1]])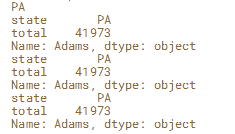
1.2 索引和列 重新排列
在某些情况下,修改DataFrame列的顺序很有用。 我们现在通过从宾夕法尼亚州选举结果DataFrame中提取两列来实现这一目标。
方法:columns = ['winner','total','voters'] df=df[columns] 这样就可以得到一个新的DataFramne。
# Import pandas
import pandas as pd

# Read in filename and set the index: election
election = pd.read_csv(filename, index_col='county')

# Create a separate dataframe with the columns ['winner', 'total', 'voters']: results
results = election[['winner','total','voters']]
#results = election(['winner','total','voters'])

# Print the output of results.head()
print(results.head())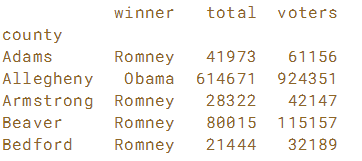
二、切片
2.1 行切片
我们使用的宾夕法尼亚州美国大选结果数据按county排序。 这意味着county名可以按顺序切片。利用标签的切片运算与普通的python切片运算不同,其末端是包含的。
从'a'到'b'的切片:df.loc['a':'b'] 从'b'到'a'的切片: df.loc['b':'a':-1] 此处单括号,得到的就是DataFrame。
# Slice the row labels 'Perry' to 'Potter': p_counties
p_counties = election.loc['Perry':'Potter']

# Print the p_counties DataFrame
print(p_counties)

# Slice the row labels 'Potter' to 'Perry' in reverse order: p_counties_rev
p_counties_rev = election.loc['Potter':'Perry':-1]

# Print the p_counties_rev DataFrame
print(p_counties_rev)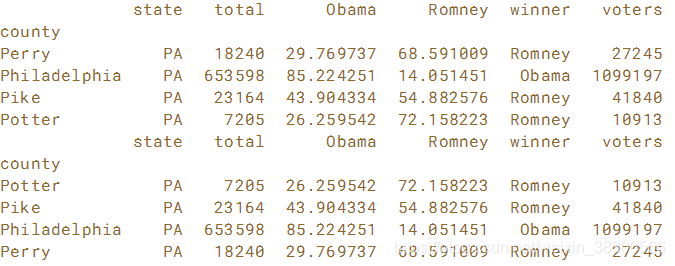
2.2 列切片
与行切片类似,可以按值对列进行切片。 使用.loc []从宾夕法尼亚州选举结果DataFrame中切割列。
.loc[:,'state':'Obama'] 当要选取的列是连着的,直接切片的方式,不用加方括号。
# Slice the columns from the starting column to 'Obama': left_columns
left_columns = election.loc[:,'state':'Obama']

# Print the output of left_columns.head()
print(left_columns.head())

# Slice the columns from 'Obama' to 'winner': middle_columns
middle_columns = election.loc[:,'Obama':'winner']

# Print the output of middle_columns.head()
print(middle_columns.head())

# Slice the columns from 'Romney' to the end: 'right_columns'
right_columns = election.loc[:,'Romney':'voters']

# Print the output of right_columns.head()
print(right_columns.head())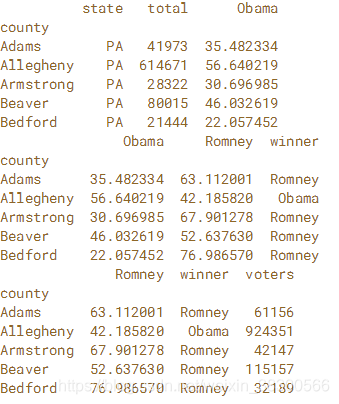
2.3 使用列表选择DataFrames
# Create the list of row labels: rows
rows = ['Philadelphia', 'Centre', 'Fulton']

# Create the list of column labels: cols
cols = ['winner', 'Obama', 'Romney']

# Create the new DataFrame: three_counties
three_counties = election.loc[rows,cols]

# Print the three_counties DataFrame
print(three_counties)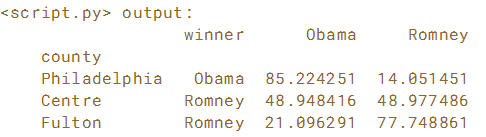
三、过滤
3.1 阈值数据 (Thresholding data)
我们提供了宾夕法尼亚州的选举结果,并包括一个名为“投票率”的列,其中包含每个县的选民投票率百分比。 准备一个布尔数组来选择投票率超过70%的所有行和列。
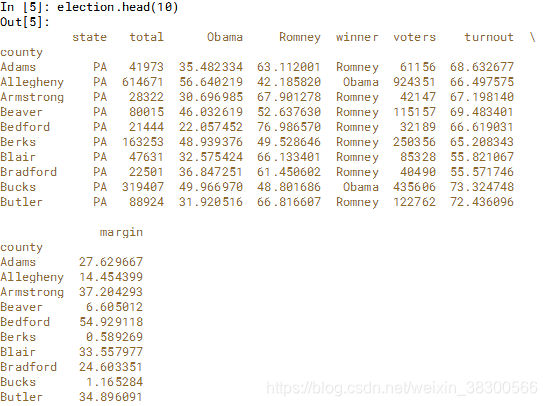
# Create the boolean array: high_turnout
high_turnout = election['turnout']>70

# Filter the election DataFrame with the high_turnout array: high_turnout_df
high_turnout_df = election[high_turnout]

# Print the high_turnout_results DataFrame
print(high_turnout_df)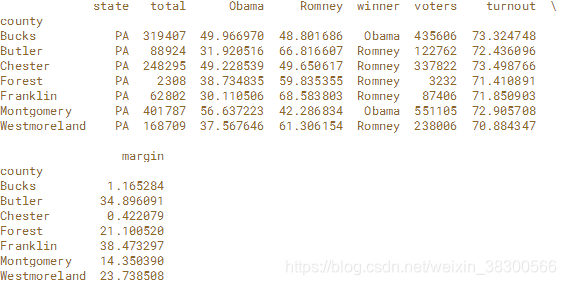
3.2 使用其他列过滤列
margin”列,表示获胜者从失败候选人那里获得的额外投票数。 这个数字是投票总票数的百分比,使用布尔型来过滤margin小于1的行。然后,将“'winner'”列的这些行转换为np.nan,以指示这些结果太接近而无法声明获胜者。
# Import numpy
import numpy as np

# Create the boolean array: too_close
too_close = election['margin']<1

# Assign np.nan to the 'winner' column where the results were too close to call
election['winner'][too_close] = np.nan

# Print the output of election.info()
print(election.info())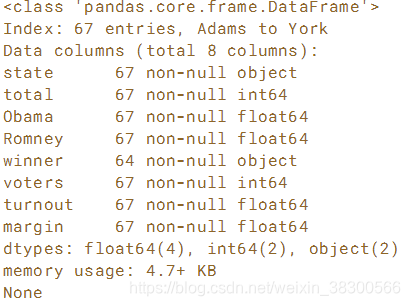
3.3 使用NaN过滤(过滤缺失数据)
在某些情况下,可能需要从DataFrame中删除缺少数据的行和列。 .dropna()方法用于执行此操作,默认用来丢弃任何含有缺失值的行。在范德比尔特大学获得的数据集上练习使用此方法,该数据集包含泰坦尼克号乘客的数据。
传入how='all'将只丢弃全为NA的那些行,要丢弃列的话,只需传入 axis=1.假如你只想留下一部分观测数据,可以用thresh 参数实现。
在IPython Shell中探索它,你会注意到有很多NaN。主要观察'age' and 'cabin'列。使用.dropna()来删除这两列中任何一列包含缺失数据的行以及这两列都包含缺失数据的行。使用.shape属性,该属性返回DataFrame中元组中的行数和列数,或者系列中的行数,以查看从DataFrame中删除缺失值的效果。最后,使用thresh = keyword参数,从完整数据集中删除少于1000个非缺失值的行或列。
# Select the 'age' and 'cabin' columns: df
df = titanic[['age','cabin']]

# Print the shape of df
print(df.shape)

# Drop rows in df with how='any' and print the shape
print(df.dropna(how='any').shape)

# Drop rows in df with how='all' and print the shape
print(df.dropna(how='all').shape)

# Drop columns in titanic with less than 1000 non-missing values
print(titanic.dropna(thresh=1000, axis='columns').info())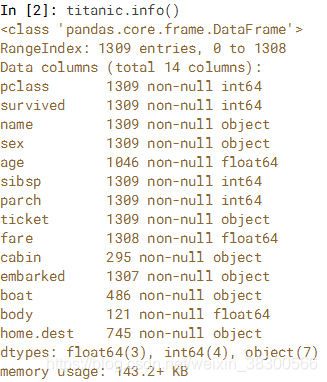
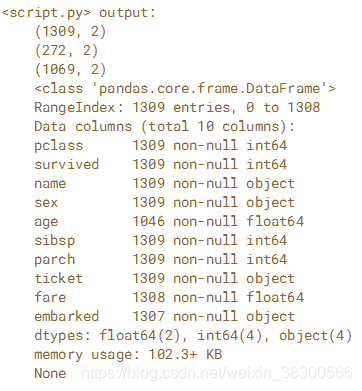
原来的titanic包含1309行,14列。经过这个操作titanic.dropna(thresh=1000, axis='columns')之后变成了10列。thresh=1000,这个参数意思是把非缺失值不超过1000个的列删除。
四、转换DataFrame
4.1 使用apply()转换列
.apply()方法可以在pandas DataFrame上使用,将任意Python函数应用于每个元素。
获取2013年从匹兹堡天气地下获得的每日天气数据。已经编写了将华氏度转换为摄氏度的函数。使用.apply()方法在weather DataFrame的'Mean TemperatureF'和'Mean Dew PointF'列上执行此转换。
# Write a function to convert degrees Fahrenheit to degrees Celsius: to_celsius
def to_celsius(F):
    return 5/9*(F - 32)

# Apply the function over 'Mean TemperatureF' and 'Mean Dew PointF': df_celsius
df_celsius = weather[['Mean TemperatureF','Mean Dew PointF']].apply(to_celsius)

# Reassign the columns df_celsius
df_celsius.columns = ['Mean TemperatureC', 'Mean Dew PointC']

# Print the output of df_celsius.head()
print(df_celsius.head())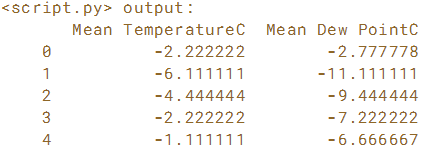
4.2 将.map()与字典一起使用
.map()方法用于根据Python字典查找转换值。 使用已为您预先加载的election DataFrame时练习此方法。
使用字典将“winner”列中的“Obama”和“Romney”值映射到值“blue”和“red”,并将输出分配给新列“color”
# Create the dictionary: red_vs_blue
red_vs_blue = {'Obama':'blue' , 'Romney':'red'}

# Use the dictionary to map the 'winner' column to the new column: election['color']
election['color'] = election.winner.map(red_vs_blue)

# Print the output of election.head()
print(election.head())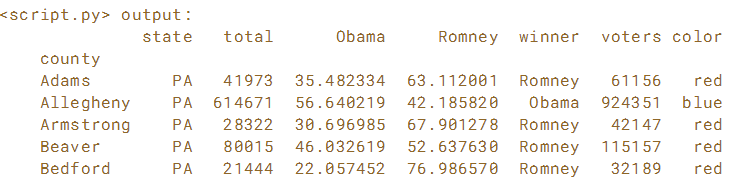
4.3 使用矢量化函数
当性能至关重要时,应该避免使用.apply()和.map(),因为这些构造对存储在pandas Series或DataFrame中的数据执行Python for循环。通过使用矢量化函数,可以与编译代码(C,Fortran等)相同的速度循环数据! NumPy,SciPy和pandas带有各种矢量化函数(在NumPy中称为通用函数或UFunc)。你甚至可以编写自己的矢量化函数,但是现在我们将专注于由NumPy和pandas分发的函数。
从scipy.stats导入zscore函数,并使用它来计算宾夕法尼亚州选民投票率与标准差分数的平均值之间的偏差。在统计学中,z分数是观察值高于平均值的标准偏差的数量 - 因此如果它是负值,则意味着观察值低于平均值。
而不是像在之前的练习中那样使用.apply(),zscore UFunc将把pandas Series作为输入并返回一个NumPy数组。然后将NumPy数组的值分配给DataFrame中的新列。使用已为您预先加载的election DataFrame时练习此方法。
# Import zscore from scipy.stats
from scipy.stats import zscore

# Call zscore with election['turnout'] as input: turnout_zscore
turnout_zscore = zscore(election['turnout'])

# Print the type of turnout_zscore
print(type(turnout_zscore))

# Assign turnout_zscore to a new column: election['turnout_zscore']
election['turnout_zscore'] = turnout_zscore

# Print the output of election.head()
print(election.head())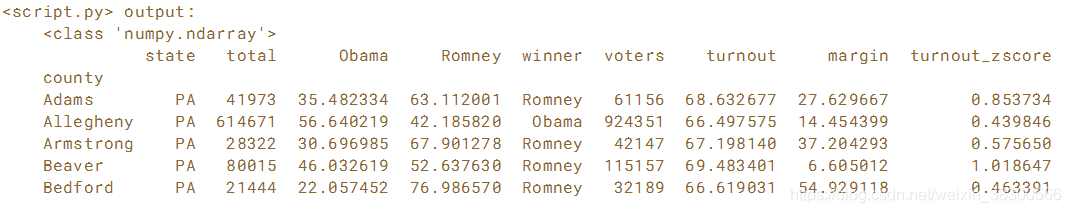


 3227
3227

 被折叠的 条评论
为什么被折叠?
被折叠的 条评论
为什么被折叠?
 到【灌水乐园】发言


