


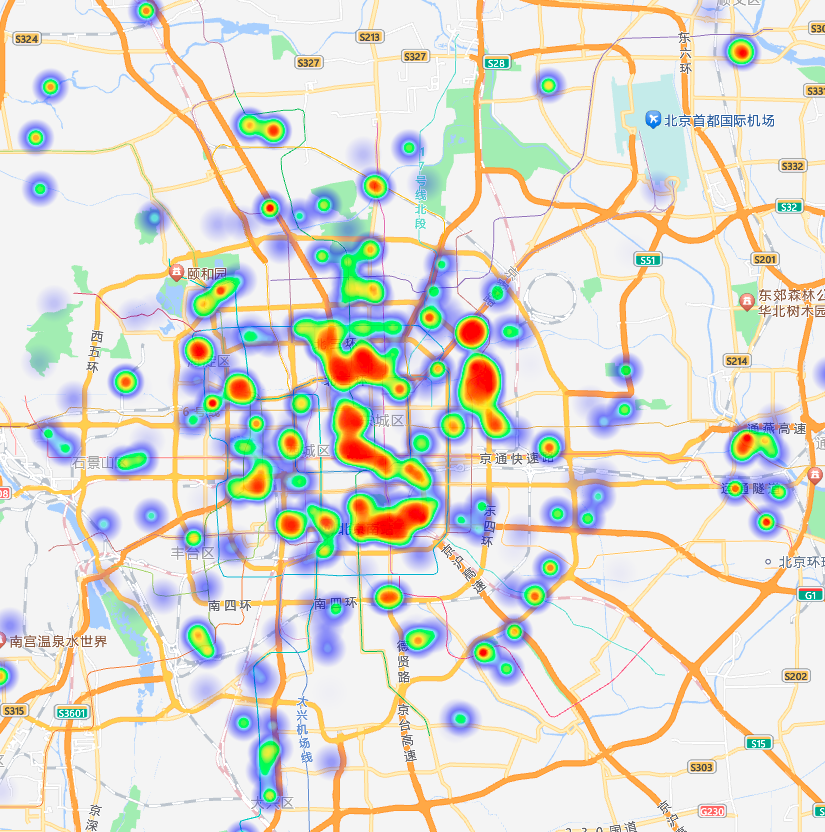
展示:
代码:部分经纬度代码省略。
<template>
  <div id="container" style="width: 100%; height: 100vh"></div>
</template>

<script setup>
import { onMounted } from "vue";

// 判断浏览器是否支持Canvas
function isSupportCanvas() {
  const elem = document.createElement("canvas");
  return !!(elem.getContext && elem.getContext("2d"));
}

onMounted(() => {
  if (!isSupportCanvas()) {
    alert(
      "热力图仅对支持canvas的浏览器适用,您所使用的浏览器不能使用热力图功能,请换个浏览器试试~"
    );
    return;
  }

  // 创建地图实例
  const map = new window.AMap.Map("container", {
    resizeEnable: true,
    center: [116.418261, 39.921984], // 设置地图中心点为北京
    zoom: 11, // 设置缩放级别
  });

  // 加载热力图插件
  map.plugin(["AMap.HeatMap"], function () {
    // 初始化热力图对象
    const heatmap = new window.AMap.HeatMap(map, {
      radius: 25, // 设置热力图的半径
      opacity: [0, 0.8], // 设置热力图的透明度
    });

    // 设置数据集
    const heatmapData = [

      {
        lng: 116.408531,
        lat: 39.953194,
        count: 75,
      },
      {
        lng: 116.417916,
        lat: 39.954029,
        count: 76,
      },
      {
        lng: 116.412215,
        lat: 39.992282,
        count: 77,
      },
      {
        lng: 116.181532,
        lat: 40.048762,
        count: 78,
      },
      {
        lng: 116.434848,
        lat: 40.070463,
        count: 79,
      },
      {
        lng: 116.385039,
        lat: 39.956937,
        count: 80,
      },
      {
        lng: 116.755067,
        lat: 39.854499,
        count: 81,
      },
      {
        lng: 116.396061,
        lat: 39.912841,
        count: 82,
      },

      { lng: 116.191031, lat: 39.988585, count: 10 },
      { lng: 116.389275, lat: 39.925818, count: 11 },
      { lng: 116.287444, lat: 39.810742, count: 12 },
      { lng: 116.481707, lat: 39.940089, count: 13 },
      { lng: 116.410588, lat: 39.880172, count: 14 },
      { lng: 116.394816, lat: 39.91181, count: 15 },
      { lng: 116.416002, lat: 39.952917, count: 16 },
    ];

    // 设置热力图数据集
    heatmap.setDataSet({
      data: heatmapData,
      max: 100,
    });
  });
});
</script>

<style scoped>
#container {
  height: 100vh;
}
</style>
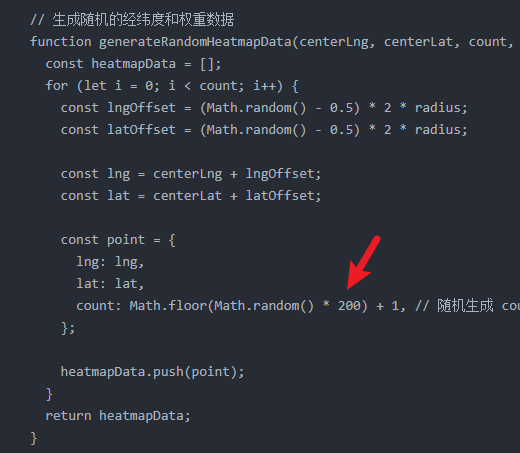
生成随机热力图数据:
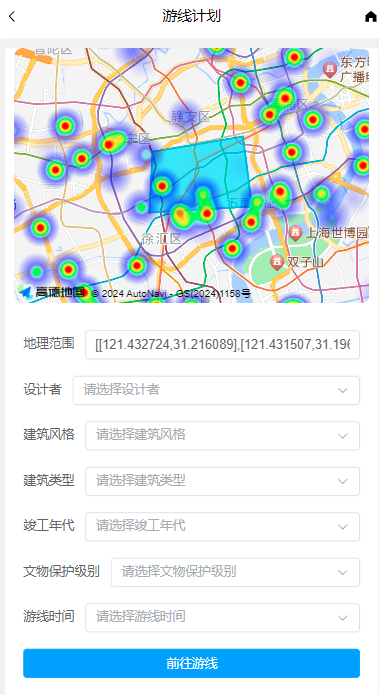
展示:
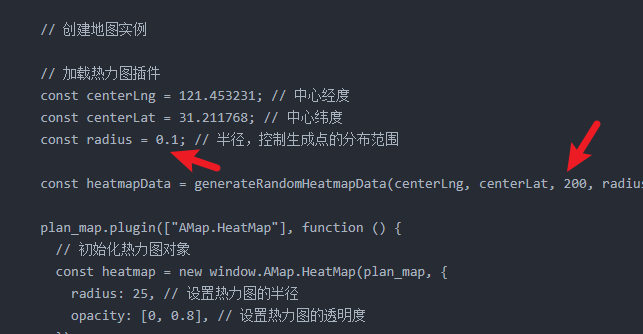
关键参数:
代码:
<!--
 * @Description  :
 * @Author       : tengjj
 * @Date         : 2024-11-21 16:48:01
 * @LastEditors  : tengjj
 * @LastEditTime : 2024-12-16 19:33:41
 * @FilePath     : \\huohua\\src\\components\\PlanPage.vue
 * Copyright (C) 2024 tengjj. All rights reserved.
-->
<template>
  <!-- 引入 HeadNav 组件并传递文字 -->
  <HeadNav> 游线计划 </HeadNav>

  <div
    style="width: 100%; padding: 10px; box-sizing: border-box; height: calc(100vh - 20px)"
  >
    <div
      style="
        width: 100%;
        background-color: white;
        padding: 0 10px;
        box-sizing: border-box;
      "
    >
      <div id="plan_map" style="border-radius: 10px"></div>

      <div
        style="
          width: 100%;
          flex: 1;
          overflow-y: auto;
          padding: 10px;
          background-color: white;
          box-sizing: border-box;
        "
      >
        <el-form :model="form" style="margin-top: 10px">
          <!-- 地理范围(文本框) -->

          <el-form-item label="地理范围" prop="geographicRange">
            <el-input
              v-model="form.geographicRange"
              placeholder="请输入地理范围"
            ></el-input>
          </el-form-item>

          <!-- 设计者(下拉框) -->
          <el-form-item label="设计者" prop="designer">
            <el-select v-model="form.designer" placeholder="请选择设计者">
              <el-option label="范文照" value="范文照"></el-option>
              <el-option label="李大伟" value="李大伟"></el-option>
              <!-- 可以根据需要添加更多设计者 -->
            </el-select>
          </el-form-item>

          <!-- 建筑风格(下拉框) -->
          <el-form-item label="建筑风格" prop="architecturalStyle">
            <el-select v-model="form.architecturalStyle" placeholder="请选择建筑风格">
              <el-option label="现代" value="现代"></el-option>
              <el-option label="古典" value="古典"></el-option>
              <el-option label="后现代" value="后现代"></el-option>
              <!-- 添加更多风格 -->
            </el-select>
          </el-form-item>

          <!-- 建筑类型(下拉框) -->
          <el-form-item label="建筑类型" prop="buildingType">
            <el-select v-model="form.buildingType" placeholder="请选择建筑类型">
              <el-option label="商住混合型公寓" value="商住混合型公寓"></el-option>
              <el-option label="办公楼" value="办公楼"></el-option>
              <el-option label="住宅" value="住宅"></el-option>
              <!-- 添加更多建筑类型 -->
            </el-select>
          </el-form-item>

          <!-- 竣工年代(下拉框) -->
          <el-form-item label="竣工年代" prop="completionPeriod">
            <el-select v-model="form.completionPeriod" placeholder="请选择竣工年代">
              <el-option label="10~20年代" value="10~20年代"></el-option>
              <el-option label="30~40年代" value="30~40年代"></el-option>
              <el-option label="50~60年代" value="50~60年代"></el-option>
              <!-- 添加更多年代 -->
            </el-select>
          </el-form-item>

          <!-- 文物保护级别(下拉框) -->
          <el-form-item label="文物保护级别" prop="culturalRelicLevel">
            <el-select v-model="form.culturalRelicLevel" placeholder="请选择文物保护级别">
              <el-option label="高" value="高"></el-option>
              <el-option label="中" value="中"></el-option>
              <el-option label="低" value="低"></el-option>
              <!-- 添加更多级别 -->
            </el-select>
          </el-form-item>

          <!-- 结构类型(下拉框) -->
          <el-form-item label="游线时间" prop="travelTime">
            <el-select v-model="form.travelTime" placeholder="请选择游线时间">
              <el-option label="半天" value="半天"></el-option>
              <el-option label="一天" value="一天"></el-option>
              <el-option label="两天以上" value="两天以上"></el-option>
              <!-- 添加更多结构类型 -->
            </el-select>
          </el-form-item>

          <!-- 提交按钮 -->
          <el-form-item>
            <el-button style="width: 100%" type="primary" @click="goLuxianPoints"
              >前往游线</el-button
            >
          </el-form-item>
        </el-form>
      </div>
    </div>
  </div>
</template>

<script>
import { onMounted, ref } from "vue";
import { useRouter } from "vue-router";
import {} from "@element-plus/icons-vue";
import HeadNav from "./HeadNav.vue";
export default {
  name: "PlanPage",
  components: {
    HeadNav,
  },
  setup() {
    const latitude = ref("31.172905");
    const longitude = ref("121.407312");
    const locationsArr = ref([
      {
        latitude: 31.20795794562185,
        longitude: 121.45650752064768,
        label: "上海电影译制厂",
      },
      {
        latitude: 31.202250090600185,
        longitude: 121.44500211189806,
        label: "集雅公寓",
      },
      {
        latitude: 31.192509,
        longitude: 121.442001,
        label: "八仙桥基督教青年会大楼",
      },
      {
        latitude: 31.22972,
        longitude: 121.476285,
        label: "上海音乐厅",
      },
      {
        latitude: 31.23136930737804,
        longitude: 121.45135821326176,
        label: "美琪大戏院",
      },
    ]);
    const router = useRouter();
    // 游线

    const path1 = ref([
      [121.432724, 31.216089],
      [121.431507, 31.196407],
      [121.470224, 31.198386],
      [121.466815, 31.220983],
    ]);
    const form = ref({
      geographicRange: JSON.stringify(path1.value), // 将 path1 初始化为 JSON 字符串
      designer: "",
      architecturalStyle: "",
      buildingType: "",
      completionPeriod: "",
      culturalRelicLevel: "",
      travelTime: "",
    });

    // 前往全部路线

    const goLuxianPoints = () => {
      const newLocation = {
        latitude: latitude.value,
        longitude: longitude.value,
        label: "当前位置",
      };

      const updatedLocations = [newLocation, ...locationsArr.value];
      // const updatedLocations = [...locationsArr.value];

      // 跳转到路线页面
      router.push({
        name: "LuxianPage",
        query: {
          locations: JSON.stringify(updatedLocations),
          type: "transfer_waypoints",
        },
      });
    };

    // 判断浏览器是否支持Canvas
    function isSupportCanvas() {
      const elem = document.createElement("canvas");
      return !!(elem.getContext && elem.getContext("2d"));
    }

    // 生成随机的经纬度和权重数据
    function generateRandomHeatmapData(centerLng, centerLat, count, radius) {
      const heatmapData = [];
      for (let i = 0; i < count; i++) {
        const lngOffset = (Math.random() - 0.5) * 2 * radius;
        const latOffset = (Math.random() - 0.5) * 2 * radius;

        const lng = centerLng + lngOffset;
        const lat = centerLat + latOffset;

        const point = {
          lng: lng,
          lat: lat,
          count: Math.floor(Math.random() * 200) + 1, // 随机生成 count 值,范围 1-20
        };

        heatmapData.push(point);
      }
      return heatmapData;
    }

    onMounted(() => {
      // 初始化地图  计划
      const plan_map = new window.AMap.Map("plan_map", {
        resizeEnable: true,
        center: [121.447456, 31.208383], // 地图中心点 点聚合中心
        zoom: 12, // 地图显示的缩放级别
      });

      // 初始化多边形
      const polygons = [];

      const polygonArr = new window.AMap.Polygon({
        path: path1.value,
      });
      // 添加到地图
      plan_map.add([polygonArr]);
      polygons.push(polygonArr);
      // 调整视野
      //   plan_map.setFitView();
      // 初始化多边形编辑器
      const polyEditor = new window.AMap.PolygonEditor(plan_map);
      // 吸附多边形
      polyEditor.addAdsorbPolygons(polygons);

      // 注册双击事件:编辑多边形
      [polygonArr].forEach((polygon) => {
        polygon.on("click", () => {
          polyEditor.setTarget(polygon);
          polyEditor.open();
        });
      });

      // 监听多边形调整事件
      polyEditor.on("adjust", (event) => {
        const adjustedPolygon = event.target; // 调整后的多边形对象
        const newPath = adjustedPolygon.getPath(); // 获取调整后的路径
        console.log("多边形调整完成", newPath);
        form.value.geographicRange = JSON.stringify(newPath);
      });

      // 热力图
      if (!isSupportCanvas()) {
        console.log(
          "热力图仅对支持canvas的浏览器适用,您所使用的浏览器不能使用热力图功能,请换个浏览器试试~"
        );
        return;
      }

      // 创建地图实例

      // 加载热力图插件
      const centerLng = 121.453231; // 中心经度
      const centerLat = 31.211768; // 中心纬度
      const radius = 0.1; // 半径,控制生成点的分布范围

      const heatmapData = generateRandomHeatmapData(centerLng, centerLat, 200, radius);

      plan_map.plugin(["AMap.HeatMap"], function () {
        // 初始化热力图对象
        const heatmap = new window.AMap.HeatMap(plan_map, {
          radius: 25, // 设置热力图的半径
          opacity: [0, 0.8], // 设置热力图的透明度
        });

        // 设置热力图数据集
        heatmap.setDataSet({
          data: heatmapData,
          max: 100,
        });
      });

      // 热力图end
    });

    // 返回上一页
    const goBack = () => {
      window.history.back();
    };

    return {
      form,
      latitude,
      longitude,
      goLuxianPoints,
      goBack,
    };
  },
};
</script>

<style scoped>
#plan_map {
  width: 100%;
  height: 30vh;
  margin: 0 0 10px 0;
}
</style>


 4048
4048

 被折叠的 条评论
为什么被折叠?
被折叠的 条评论
为什么被折叠?
 到【灌水乐园】发言


