


 本文介绍了Python的Matplotlib库中的xlim()函数,用于设置或获取图表的x轴限制。提供示例代码展示了如何使用xlim()来设定图表的左右边界,并通过文本属性控制标签外观。示例包括线图和直方图的绘制,帮助理解xlim()在不同图表类型中的应用。
Matplotlib是Python中的一个库,它是数字的-NumPy库的数学扩展。 Pyplot是Matplotlib模块的基于状态的接口,该模块提供了MATLAB-like接口。在Pyplot中可以使用各种图,例如线图,轮廓图,直方图,散点图,3D图等。#示例代码
# sample code
import matplotlib.pyplot as plt
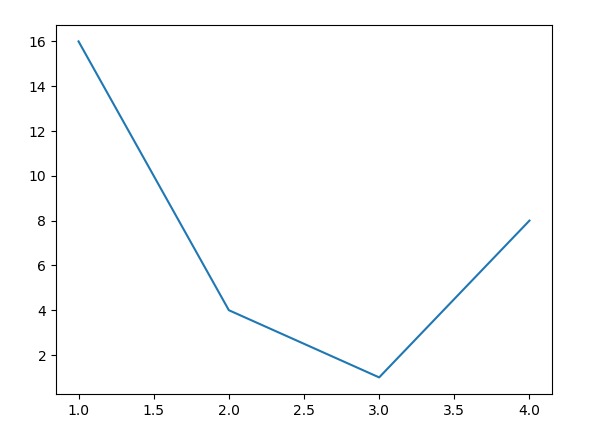
plt.plot([1, 2, 3, 4], [16, 4, 1, 8])
plt.show()
输出:
matplotlib.pyplot.xlim()功能
matplotlib库的pyplot模块中的xlim()函数用于获取或设置当前轴的x-limits。句法:
matplotlib.pyplot.xlim(*args, **kwargs)
参数:此方法接受以下描述的参数:
left:此参数用于将xlim设置为左侧。
right:此参数用于将xlim设置为正确。
**kwargs:此参数是文本属性,用于控制标签的外观。
返回值:这将返回以下内容:
left, right:这将返回新的x轴限制的元组。
以下示例说明了matplotlib.pyplot中的matplotlib.pyplot.ylim()函数:
示例1:
# Implementation of matplotlib function
import matplotlib.pyplot as plt
import numpy as np
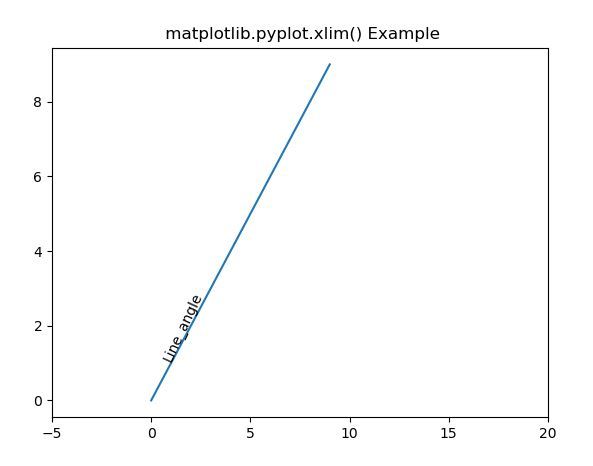
h = plt.plot(np.arange(0, 10), np.arange(0, 10))
plt.xlim([-5, 20])
l1 = np.array((1, 1))
angle = 65
th1 = plt.text(l1[0], l1[1], 'Line_angle',
fontsize = 10, rotation = angle,
rotation_mode ='anchor')
plt.title(" matplotlib.pyplot.xlim() Example")
plt.show()
输出:
示例2:
# Implementation of matplotlib function
import matplotlib.pyplot as plt
import numpy as np
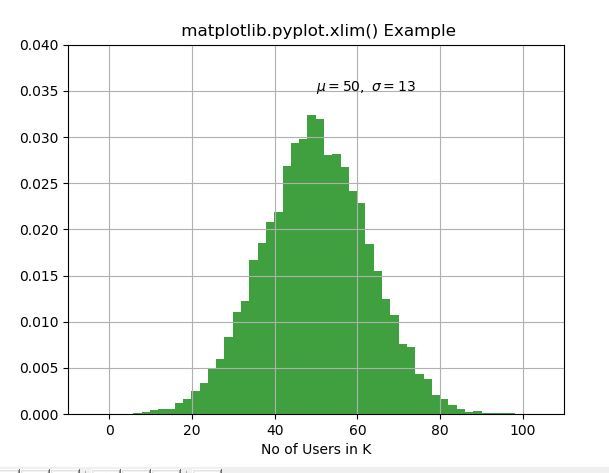
np.random.seed(9680801)
mu, sigma = 50, 13
x = mu + sigma * np.random.randn(10000)
# the histogram of the data
n, bins, patches = plt.hist(x, 50,
density = True,
facecolor ='g',
alpha = 0.75)
plt.xlabel('No of Users in K')
plt.title('Histogram of IQ')
plt.text(50, .035, r'$\mu = 50, \
\ \sigma = 13$')
plt.xlim(-10, 110)
plt.ylim(0, 0.04)
plt.grid(True)
plt.title(" matplotlib.pyplot.xlim() Example")
plt.show()
输出:


 被折叠的 条评论
为什么被折叠?
被折叠的 条评论
为什么被折叠?
 到【灌水乐园】发言


