


 本文介绍了MATLAB中创建和调整子图标签的函数axes_label的使用方法,包括如何设置标签的位置,并通过示例展示了如何在当前轴上添加和调整标签的位置。然而,当使用export_fig进行图像导出时,遇到了问题,标签无法正确显示。作者期待找到解决方案或代码改进的建议。
为了后人的缘故,这里是我决定使用的版本。它做了我期望它做的事,但现在我有一个问题,我不知道如何解决。好的,首先是好消息,这里是名为axes_label的函数。
function c = axes_label(varargin)
if isa(varargin{1}, 'char')
axesHandle = gca;
else
axesHandle = get(varargin{1}{1}, 'Parent');
end
if strcmp(get(get(axesHandle, 'Title'), 'String'), '')
title(axesHandle, ' ');
end
if strcmp(get(get(axesHandle, 'YLabel'), 'String'), '')
ylabel(axesHandle, ' ');
end
if strcmp(get(get(axesHandle, 'ZLabel'), 'String'), '')
zlabel(axesHandle, ' ');
end
if isa(varargin{1}, 'char')
label = varargin{1};
if nargin >=2
dx = varargin{2};
if nargin >= 3
dy = varargin{3};
else
dy = 0;
end
else
dx = 3;
dy = 3;
end
h = text('String', label, ...
'HorizontalAlignment', 'left',...
'VerticalAlignment', 'top', ...
'FontUnits', 'pixels', ...
'FontSize', 16, ...
'FontWeight', 'bold', ...
'FontName', 'Arial', ...
'Units', 'normalized');
el = addlistener(axesHandle, 'Position', 'PostSet', @(o, e) posChanged(o, e, h, dx, dy));
c = {h, el};
else
h = varargin{1}{1};
delete(varargin{1}{2});
if nargin >= 2
if isa(varargin{2}, 'char')
set(h, 'String', varargin{2});
if nargin >=3
dx = varargin{3};
dy = varargin{4};
else
dx = 3;
dy = 3;
end
else
dx = varargin{2};
dy = varargin{3};
end
else
error('Needs more arguments. Type help axes_label');
end
el = addlistener(axesHandle, 'Position', 'PostSet', @(o, e) posChanged(o, e, h, dx, dy));
c = {h, el};
end
posChanged(0, 0, h, dx, dy);
end
function posChanged(~, ~, h, dx, dy)
axh = get(h, 'Parent');
p = get(axh, 'Position');
o = get(axh, 'OuterPosition');
xp = (o(1)-p(1))/p(3);
yp = (o(2)-p(2)+o(4))/p(4);
set(h, 'Units', get(axh, 'Units'),'Position', [xp yp]);
set(h, 'Units', 'pixels');
p = get(h, 'Position');
set(h, 'Position', [p(1)+dx, p(2)+5-dy]);
set(h, 'Units', 'normalized');
end好的,那么我们如何使用这个糟糕的功能呢?我做到了这样我们可以有这些用途:
% c = axes_label('label')
% Places the text object with the string 'label' on the upper-left
% corner of the current axes and returns a cell containing the handle
% of the text and an event listener.
%
% c = axes_label('label', dx, dy)
% Places the text object dx pixels from the left side of the axes
% and dy pixels from the top. These values are set to 3 by default.
%
% c = axes_label(c, ...)
% Peforms the operations mentioned above on cell c containing the
% handle of the text and the event listener.
%
% c = axes_label(c, dx, dy)
% Adjusts the current label to the specifed distance from the
% upper-left corner of the current axes.如果我们执行与以前相同的测试:
figure;
h1 = axes('OuterPosition', [0,0,.5 1]);
set(h1,'LooseInset',get(h1,'TightInset'));
h2 = axes('OuterPosition', [.5,0,.5 1]);
set(h2,'LooseInset',get(h2,'TightInset'));
axes(h1);
plot([0 1], [4 5]);
axes_label('A');
axes(h2);
plot([0 1], [4 5]);
axes_label('B', 250, 250);现在我们得到了我想要的东西。标签'A'设置在轴的Outerbox的左上角。标签B我明确地将其设置为距其左上角250像素。这是一个情节:

我喜欢这个功能的是,如果我要存储从它返回的单元格,然后我放回去,我可以改变位置。例如,如果label = axes_label('A');然后在命令提示符下我可以执行label = axes_label(label, 10, 20);,我将看到我的标签移动。
我现在面临的问题与功能export_fig有关
如果我尝试使用这个:
export_fig('testing.png', '-nocrop', '-painters');那是我得到的数字。
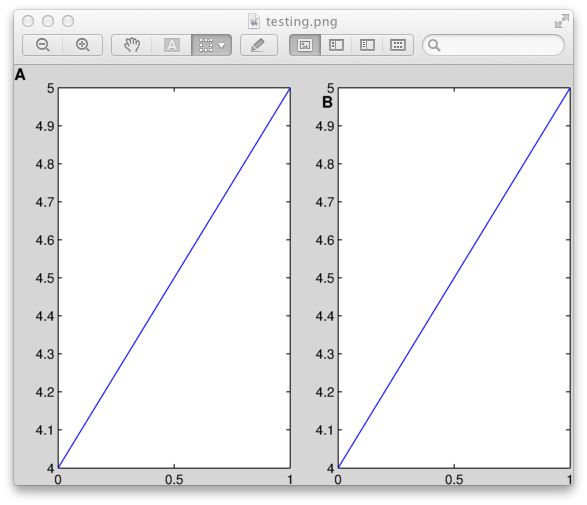
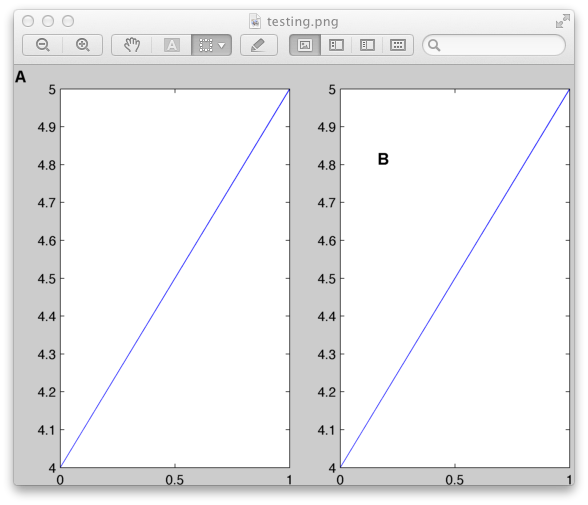
这就是我用标签B夸大的原因。在我添加事件监听器之前,export_fig可以在打印我放置它们的标签时做好工作。但不知怎的,现在export_fig没有按照它声称的那样做。主要是用图像导出图像
Figure/axes reproduced as it appears on screen
如果我们删除选项-painters然后我们得到这个:
代码中可能存在一个错误,因为我没有听众的经验,所以如果有人可以修复这个行为和/或可以改进这个代码,请随意这样做并分享它作为答案。


 3万+
3万+

 被折叠的 条评论
为什么被折叠?
被折叠的 条评论
为什么被折叠?
 到【灌水乐园】发言


