


 本文介绍Spring Boot Actuator模块如何简化应用监控与管理。通过配置可启用多个监控端点,如健康检查、应用信息、指标收集等。特别关注metrics端点,用于收集系统资源使用情况。

spring-boot-actuator模块提供了一个监控和管理生产环境的模块,可以使用http、jmx、ssh、telnet等管理和监控应用。审计(Auditing)、健康(health)、数据采集(metrics gathering)会自动加入到应用里面。
在项目中加入actuator,maven项目需要在pom文件加入如下依赖:
<dependency>
    <groupId>org.springframework.boot</groupId>
    <artifactId>spring-boot-starter-actuator</artifactId>
</dependency>
依赖加入后,还需做一些配置,在application.properties文件加入如下配置:
endpoints.info.id=information
endpoints.info.sensitive=false
endpoints.info.enabled=true
management.security.enabled=false
management.security.enabled=false 这个一定要设置成false,要不然会报权限错误(这些连接点的权限可以加入到自己的权限系统去维护)。
配置好后,启动项目,就会看到如下连接点:
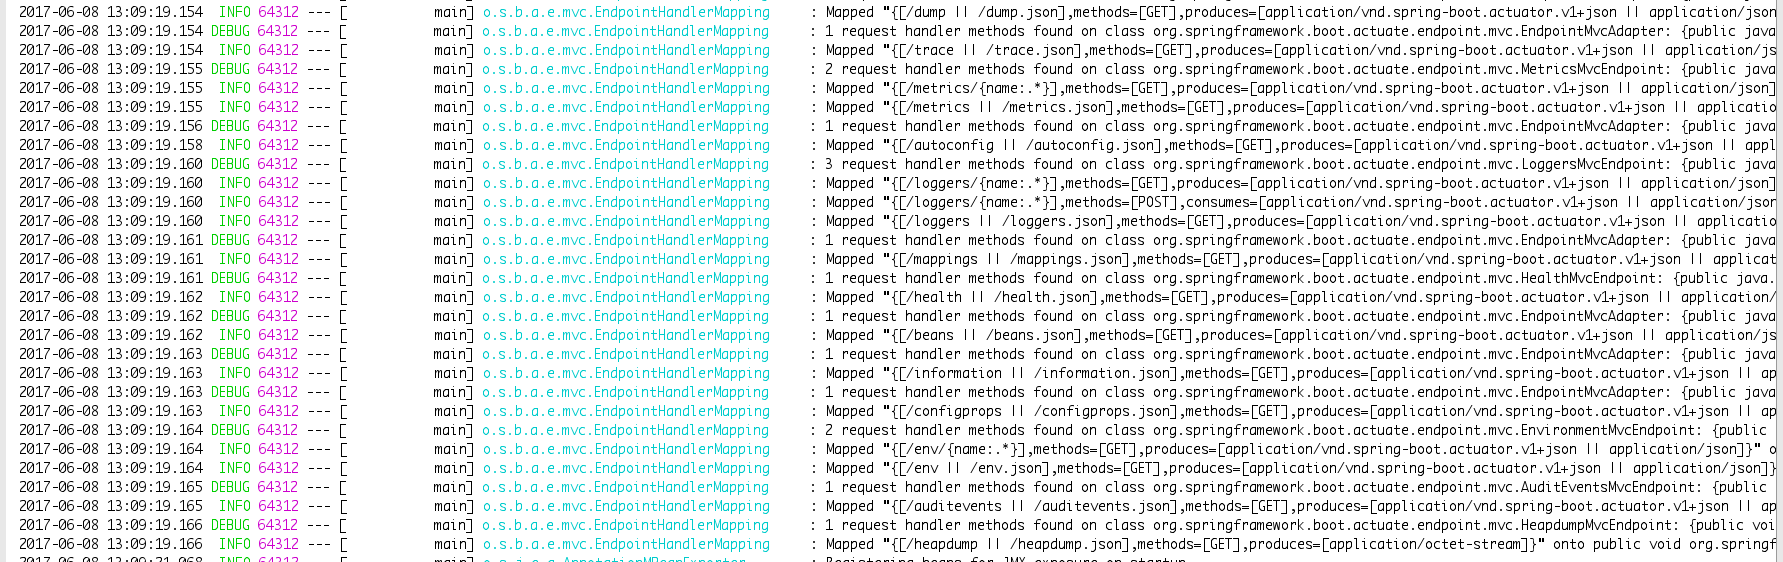
相关连接点描述:
| ID | 描述 | 敏感(Sensitive) |
|---|---|---|
| autoconfig | 显示一个auto-configuration的报告,该报告展示所有auto-configuration候选者及它们被应用或未被应用的原因 | true |
| beans | 显示一个应用中所有Spring Beans的完整列表 | true |
| configprops | 显示一个所有@ConfigurationProperties的整理列表 | true |
| dump | 执行一个线程转储 | true |
| env | 暴露来自Spring ConfigurableEnvironment的属性 | true |
| health | 展示应用的健康信息(当使用一个未认证连接访问时显示一个简单的’status’,使用认证连接访问则显示全部信息详情) | false |
| info | 显示任意的应用信息 | false |
| metrics | 展示当前应用的’指标’信息 | true |
| mappings | 显示一个所有@RequestMapping路径的整理列表 | true |
| shutdown | 允许应用以优雅的方式关闭(默认情况下不启用) | true |
| trace | 显示trace信息(默认为最新的一些HTTP请求) | true |
做实时监控的,关注点主要是metrics这个连接点,浏览器访问下,可以看到如下信息:
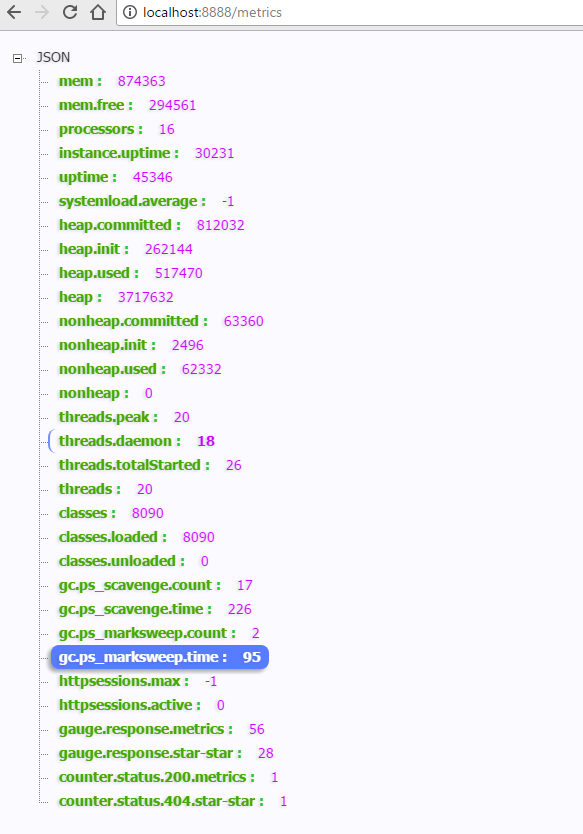
此处我们可以看到基本的 memory , heap , class loading , processor 和 thread pool 信息,连同一些HTTP指标。在该实例中,可以使用 /metrics/{name:.*} 访问单个属性。
- 系统内存总量(mem),单位:Kb
- 空闲内存数量(mem.free),单位:Kb
- 处理器数量(processors)
- 系统正常运行时间(uptime),单位:毫秒
- 应用上下文(就是一个应用实例)正常运行时间(instance.uptime),单位:毫秒
- 系统平均负载(systemload.average)
- 堆信息(heap,heap.committed,heap.init,heap.used),单位:Kb
- 线程信息(threads,thread.peak,thead.daemon)
- 类加载信息(classes,classes.loaded,classes.unloaded)
- 垃圾收集信息(gc.xxx.count, gc.xxx.time)
- 最大连接数(datasource.xxx.max)
- 最小连接数(datasource.xxx.min)
- 活动连接数(datasource.xxx.active)
- 连接池的使用情况(datasource.xxx.usage)


 989
989

 被折叠的 条评论
为什么被折叠?
被折叠的 条评论
为什么被折叠?
 到【灌水乐园】发言


