x为正变数,求y=x^3/(x^4+4)的最大值

本文通过数学分析找到给定函数的极值,并利用HTML5 Canvas绘制该函数的图像,展示了函数图像的绘制过程及如何使用JavaScript进行数学运算。

摘要生成于 C知道 ,由 DeepSeek-R1 满血版支持, 前往体验 >

设z=1/y=x4+4/x3

 显然,当z有最小值时,y有最大值,求得zmin,就得到了ymax

而z=x+4/x3=x/3+x/3+x/3+4/x3

根据正实数算术平均数大于等于它们的几何平均数的定理

当x/3=4/x3时,有zmin,此时x=121/4

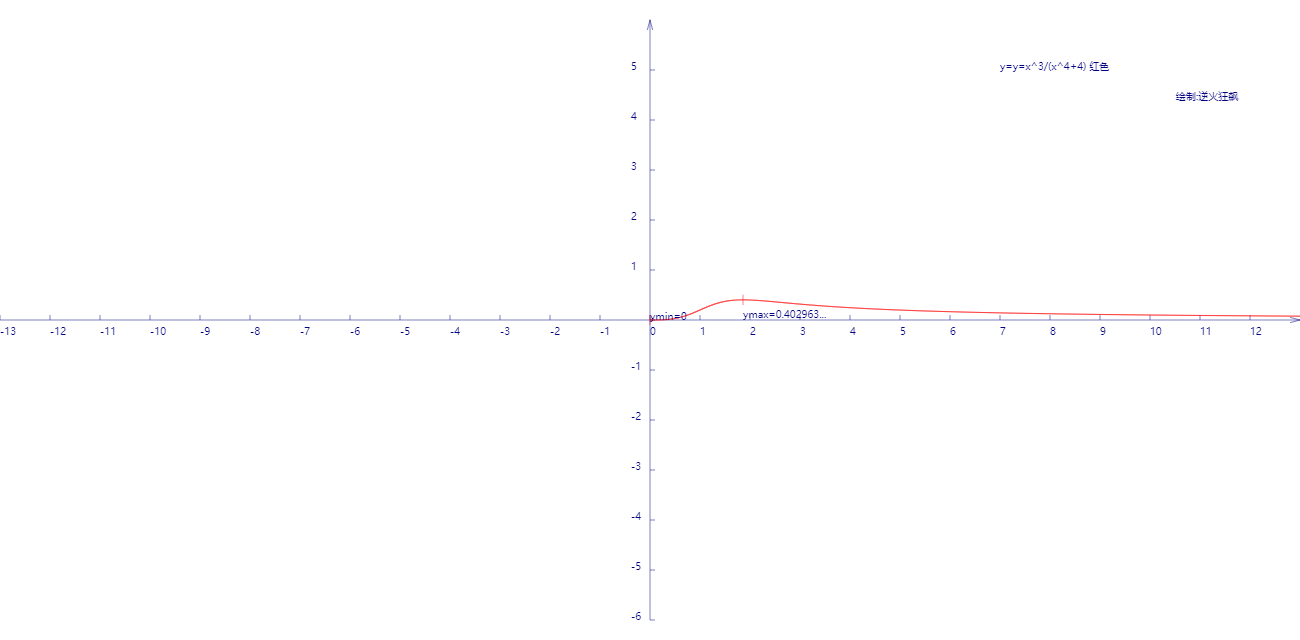
 因此,ymax=121/4/16≈0.40296

图线如下:

代码如下:

<!DOCTYPE html>
<html lang="utf-8">
<meta http-equiv="Content-Type" content="text/html; charset=utf-8"/>
<head>
     <title>绘制y=x^3/(x^4+4)曲线</title>
    </head>

     <body onload="draw()">
        <canvas id="myCanvus" width="1300px" height="640px" style="border:1px dashed black;">
            出现文字表示你的浏览器不支持HTML5
        </canvas>
     </body>
</html>
<script type="text/javascript">
<!--
    function draw(){
        var canvas=document.getElementById("myCanvus");
        var canvasWidth=1300;
        var canvasHeight=640;

        var context=canvas.getContext("2d");
        
        context.fillStyle = "white";
        context.fillRect(0, 0, canvasWidth, canvasHeight);

        context.strokeStyle = "black";
        context.fillStyle = "black";

        
        // 进行坐标变换:把原点放在左下角,东方为X轴正向,北方为Y轴正向
        var offsetY=320;// Y向偏移值,正值向上偏,用来画坐标轴
        var offsetX=650;// X向偏移值,正值向右偏,用来画坐标轴

        context.save();
        context.translate(0+offsetX,canvasHeight-offsetY);

        drawAxisXText(context);// 文字和线分开画比较好处理
        drawAxisYText(context);
        drawTitleText(context);

        context.rotate(getRad(180));
        context.scale(-1,1);        

        drawAxisX(context);        
        drawAxisY(context);       
        drawCurve(context);       

        context.restore();        
    }

    function drawTitleText(ctx){        
        ctx.lineWidth=0.5;
        ctx.strokeStyle='navy';
        ctx.fillStyle='navy';

        var x=350;
        var y=-250;

        // 写文字
        ctx.fillText("y=y=x^3/(x^4+4) 红色",x,y);    
        //ctx.fillText("y=(x-3)^3 绿色",x,y+20);    
        //ctx.fillText("y=(x-5)^4 黄色",x,y+40);    
        //ctx.fillText("y=(x-7)^5 青柠色",x,y+60);    
        //ctx.fillText("y=(x+3)^0.5 紫色",x,y+80);
        //ctx.fillText("y=(x+5)^0.33 栗色",x,y+100);

        ctx.fillText("  绘制:逆火狂飙",x+170,y+30);
    }

    function drawCurve(ctx){
        var cds=[{}];
        var cds1=[{}];
        var cds2=[{}];
        var cds3=[{}];
        var cds4=[{}];
        var cds5=[{}];
        var cds6=[{}];

        var x,y,arr;
        for(x=0;x<=13;x+=0.01){    
            y=Math.pow(x,3)/(Math.pow(x,4)+4);//
            arr={"x":x,"y":y};
            cds.push(arr);
        }

        paintCurve(ctx,"red",cds);
        //paintCurve(ctx,"green",cds1);
        //paintCurve(ctx,"yellow",cds2);
        //paintCurve(ctx,"lime",cds3);
        //paintCurve(ctx,"purple",cds4);
        //paintCurve(ctx,"maroon",cds5);
        //paintCurve(ctx,"maroon",cds6);*/

        var ymax=-1000,ymin=1000,xmax,xmin;
        for(var i=0; i<cds.length; i++){  
            // 求y最大值
            if(cds[i].x>0 && cds[i].y>ymax){
                ymax=cds[i].y;
                xmax=cds[i].x;
            }

            // 求y最小值
            if(cds[i].x>=0 && cds[i].y<ymin){
                ymin=cds[i].y;
                xmin=cds[i].x;
            }
        } 

        console.log("ymin="+ymin+" xmin="+xmin+" ymax="+ymax+" ymin="+ymin+" xmax="+xmax);
        var SU=50;// Scale Unit
        // 极大值
        ctx.beginPath();
        ctx.moveTo(xmax*SU,ymax*SU-5);
        ctx.lineTo(xmax*SU,ymax*SU+5);

        ctx.save();
        ctx.scale(1,-1);
        ctx.fillText("ymax="+cutShort(ymax.toString(),8),xmax*SU,-ymax*5);
        ctx.restore();

        ctx.stroke();
        ctx.closePath();

        // 极小值
        ctx.beginPath();
        ctx.moveTo(xmin*SU,ymin*SU-5);
        ctx.lineTo(xmin*SU,ymin*SU+5);

        ctx.save();
        ctx.scale(1,-1);
        ctx.fillText("ymin="+ymin,xmin*SU,-ymin*5);
        ctx.restore();

        ctx.stroke();
        ctx.closePath();

        
    }

    function paintCurve(ctx,color,cds){
        var SU=50;// Scale Unit

        ctx.strokeStyle = color;
        ctx.beginPath();        
        for(var i=0; i<cds.length; i++){  
            ctx.lineTo(cds[i].x*SU,cds[i].y*SU);// 注意y轴比例
        }         
        ctx.stroke();
        ctx.closePath();
    }

    function drawAxisX(ctx){
        ctx.save();
        
        ctx.lineWidth=0.5;
        ctx.strokeStyle='navy';
        ctx.fillStyle='navy';

        var start=-650;
        var end=650;

        // 画轴
        ctx.beginPath();
        ctx.moveTo(start, 0);
        ctx.lineTo(end, 0);
        ctx.stroke();
        ctx.closePath();

        // 画箭头
        ctx.beginPath();
        ctx.moveTo(end-Math.cos(getRad(15))*10, Math.sin(getRad(15))*10);
        ctx.lineTo(end, 0);
        ctx.lineTo(end-Math.cos(getRad(15))*10, -Math.sin(getRad(15))*10);
        ctx.stroke();
        ctx.closePath();
        
        // 画刻度
        var x,y;
        y=5;
        for(x=start;x<end;x+=50){
            ctx.beginPath();
            ctx.moveTo(x, 0);
            ctx.lineTo(x, y);
            
            ctx.stroke();
            ctx.closePath();
        }

        ctx.restore();
    }

    function drawAxisXText(ctx){        
        ctx.lineWidth=0.5;
        ctx.strokeStyle='navy';
        ctx.fillStyle='navy';

        var start=-650;
        var end=650;

        // 写文字
        var x,y=5;
        for(x=start;x<end;x+=50){
            ctx.fillText(x/50,x,y+10);
        }
    }

    function drawAxisY(ctx){
        ctx.save();
        
        ctx.lineWidth=0.5;
        ctx.strokeStyle='navy';
        ctx.fillStyle='navy';

        var start=-300;
        var end=300;

        // 画轴
        ctx.beginPath();
        ctx.moveTo(0, start);
        ctx.lineTo(0, end);
        ctx.stroke();
        ctx.closePath();

        // 画箭头
        ctx.beginPath();
        ctx.moveTo(Math.sin(getRad(15))*10, end-Math.cos(getRad(15))*10);
        ctx.lineTo(0, end);
        ctx.lineTo(-Math.sin(getRad(15))*10, end-Math.cos(getRad(15))*10);
        ctx.stroke();
        ctx.closePath();
        
        // 画刻度
        var x,y;
        x=5;
        for(y=start;y<end;y+=50){// 注意y轴比例
            ctx.beginPath();
            ctx.moveTo(x, y);
            ctx.lineTo(0, y);
            
            ctx.stroke();
            ctx.closePath();
        }
    }

    function drawAxisYText(ctx){        
        ctx.lineWidth=0.5;
        ctx.strokeStyle='navy';
        ctx.fillStyle='navy';

        var start=-250;
        var end=350;

        // 写文字
        var x=-19,y=5;
        for(y=start;y<end;y+=50){

            if(y!=0){
                ctx.fillText(-y/50,x,y);// 注意y轴比例
            }
        }
    }

    function getRad(degree){
        return degree/180*Math.PI;
    }

    function cutShort(str,length){
        if(str.length>length){
            str=str.substr(0,length)+"...";
        }
        
        return str;
    }
//-->
</script>


def calculate_youngs_modulus(excel_path, offset, youngs_modulus_override = None, elastic_range_min=None, elastic_range_max=None): """ 从Excel数据拟合杨氏模量并计算交点,生成本构拟合曲线 参数: excel_path: Excel文件路径 offset: 屈服强度延伸率(例如0.002代表0.2%) 返回: youngs_modulus: 杨氏模量值 (MPa) intercept: 截距 elastic_end_point: 弹性阶段结束点 (strain, stress) yield_y_point: 屈服点Y值对应的点 (strain, stress) fracture_elongation: 断裂延伸率 tensile_strength: 抗拉强度 intersection_points: 曲线与平移直线的交点列表 [(应变, 应力)] """ try: # 读取指定工作表 df = pd.read_excel(excel_path, sheet_name=&#39;处理后数据&#39;) except Exception as e: return None # 2. 检查必要列是否存在 if &#39;真实应变&#39; not in df.columns or &#39;真实应力&#39; not in df.columns: return None, None, None, None, None, None, None # 3. 数据预处理 strain = df[&#39;真实应变&#39;].values.astype(float) stress = df[&#39;真实应力&#39;].values.astype(float) # 确保应变按升序排列 sort_idx = np.argsort(strain) strain = strain[sort_idx] stress = stress[sort_idx] # 创建插值函数表示原始曲线 curve_func = interp1d(strain, stress, kind=&#39;linear&#39;, fill_value="extrapolate") # 4. 杨氏模量计算逻辑 youngs_modulus = 0 intercept = 0 best_idx = 0 elastic_end_point = None # 情况1: 使用自定义弹性阶段范围 if elastic_range_min is not None and elastic_range_max is not None: # 创建自定义范围的掩码 elastic_mask = (strain >= elastic_range_min) & (strain <= elastic_range_max) elastic_strain = strain[elastic_mask] elastic_stress = stress[elastic_mask] if len(elastic_strain) < 2: print("警告: 自定义弹性阶段范围内数据点不足") return None, None, None, None, None, None, None # 确定弹性阶段结束点(取范围内的最大应变点) end_idx = np.argmax(elastic_strain) elastic_end_point = (elastic_strain[end_idx], elastic_stress[end_idx]) # 如果用户指定了杨氏模量 if youngs_modulus_override is not None: youngs_modulus = youngs_modulus_override # 固定斜率拟合截距 def linear_func(x, b): return youngs_modulus * x + b try: popt, pcov = curve_fit(linear_func, elastic_strain, elastic_stress) intercept = popt[0] except: print("自定义范围截距拟合失败") return None, None, None, None, None, None, None else: # 自动计算斜率和截距 def linear_func(x, a, b): return a * x + b try: popt, pcov = curve_fit(linear_func, elastic_strain, elastic_stress) youngs_modulus, intercept = popt except: print("自定义范围杨氏模量拟合失败") return None, None, None, None, None, None, None # 情况2: 动态寻找最佳弹性阶段 else: # 如果用户指定了杨氏模量 if youngs_modulus_override is not None: youngs_modulus = youngs_modulus_override # 自动识别弹性阶段结束点 def linear_func(x, b): return youngs_modulus * x + b best_r2 = 0 # 动态寻找最佳弹性阶段 for i in range(10, len(strain)): try: popt, pcov = curve_fit(linear_func, strain[:i], stress[:i]) b = popt[0] # 计算R²值 y_pred = linear_func(strain[:i], b) residuals = stress[:i] - y_pred ss_res = np.sum(residuals ** 2) ss_tot = np.sum((stress[:i] - np.mean(stress[:i])) ** 2) if ss_tot < 1e-10: r2 = 0 else: r2 = 1 - (ss_res / ss_tot) # 更新最佳拟合 if r2 > best_r2: best_r2 = r2 best_idx = i intercept = b except: continue if best_idx == 0: print("警告: 动态检测未能找到有效的弹性阶段!") return None, None, None, None, None, None, None elastic_end_point = (strain[best_idx], stress[best_idx]) else: # 自动计算杨氏模量和截距 def linear_func(x, a, b): return a * x + b best_r2 = 0 # 动态寻找最佳弹性阶段 for i in range(10, len(strain)): try: popt, pcov = curve_fit(linear_func, strain[:i], stress[:i]) a, b = popt # 计算R²值 y_pred = linear_func(strain[:i], a, b) residuals = stress[:i] - y_pred ss_res = np.sum(residuals ** 2) ss_tot = np.sum((stress[:i] - np.mean(stress[:i])) ** 2) if ss_tot < 1e-10: r2 = 0 else: r2 = 1 - (ss_res / ss_tot) # 更新最佳拟合 if r2 > best_r2 and a > 0: best_r2 = r2 best_idx = i youngs_modulus = a intercept = b except: continue if best_idx == 0: print("警告: 未能找到有效的弹性阶段!") return None elastic_end_point = (strain[best_idx], stress[best_idx]) # 5. 构造平移直线: y = E*(x - offset) + b&#39; offset_line = lambda x: youngs_modulus * (x - offset) + intercept 修改该代码,数据预处理时用的是工程应变(%)和工程应力(Mpa),并不需要自定义弹性阶段以及不需要平移了,直接构造直线
07-25
评论
添加红包

请填写红包祝福语或标题

红包个数最小为10个

红包金额最低5元

当前余额3.43前往充值 >
需支付:10.00
成就一亿技术人!
领取后你会自动成为博主和红包主的粉丝 规则
hope_wisdom
发出的红包
实付
使用余额支付
点击重新获取
扫码支付
钱包余额 0

抵扣说明:

1.余额是钱包充值的虚拟货币,按照1:1的比例进行支付金额的抵扣。
2.余额无法直接购买下载,可以购买VIP、付费专栏及课程。

余额充值