


 本文详细介绍了如何在React框架中使用Echarts进行图表配置,包括柱状图和饼图的具体参数设置方法,如调整表格间距、修改字体大小及颜色等。
最近业务需要用到echart,还要改echart的许多地方,然后老是需要各种查,这儿写一篇文章方便自己巩固知识和查询。如果你想改你手上的echart表格中某一个数据或者样式又不知道具体改哪个位置,可以参考此文章。
一、引入js文件。
直接写入就好啦。
<script type="text/javascript" src="js/echarts.js"></script>
我自己的项目中使用的是react框架,引入方式为:
import ReactEcharts from "echarts-for-react";
二、使用表格一级设置参数。
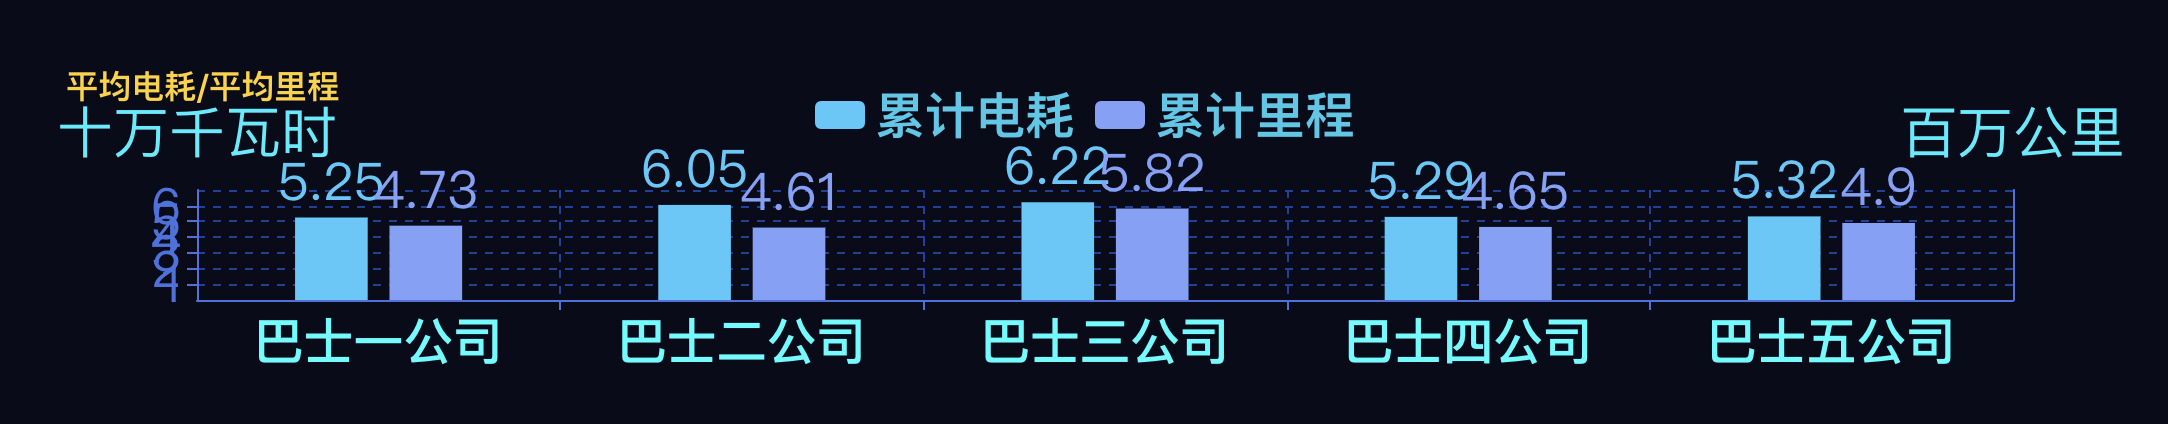
(1)柱状图
下面都采用react中jsx的语法,和js中大同小异,重点看自己想要找的属性名称。
还是惯例,上代码:
tooltip: {
trigger: "axis",
axisPointer: {
type: "shadow"
},
},
grid: { //调整表格上下左右距离
left: "80vw",
right: "60vw",
top: "110vh",
bottom: "40vh"
},
legend: { //表格内数据指示
data: ["累计电耗", "累计里程"],
top: "20vh",
textStyle: {
fontSize: "50px",
color: "#33c8e8"
},
},
yAxis: [
{
type: "value", // 纵坐标轴说明,可以添加两个,下面还添加了一个百万公里
name: "十万千瓦时",
nameTextStyle: {
fontSize: "200%",
color: "#1bedff"
},
axisLine: {
lineStyle: {
color: "#4870e1"
}
},
axisLabel: {
show: true,
textStyle: { fontSize: "25" }
},
splitLine: {
show: true,
lineStyle: {
type: "dashed",
color: ["#1e3fa0"]
}
}
},
{
type: "value",
name: "百万公里",
nameTextStyle: {
fontSize: "200%",
color: "#1bedff"
},
axisLine: {
lineStyle: {
color: "#4870e1"
}
},
splitLine: {
show: true,
lineStyle: {
type: "dashed",
color: ["#1e3fa0"]
}
}
}
],
xAxis: {
type: "category",
data: ["巴士一公司", "巴士二公司", "巴士三公司", "巴士四公司", "巴士五公司"],
axisLine: {
lineStyle: {
color: "#4870e1"
}
},
axisLabel: {
show: true,
textStyle: { fontSize: "25" },
color: "#1efeff",
fontWeight: 600
},
splitLine: {
show: true,
lineStyle: {
type: "dashed",
color: ["#1e3fa0"]
}
}
},
series: [
{
name: "累计电耗",
type: "bar",
data: [5.25, 6.05, 6.22, 5.29, 5.32],
barWidth: "20%",
label: {
normal: {
show: true,
position: "top",
textStyle: {
fontSize: 26
}
}
}
},
{
name: "累计里程",
type: "bar",
data: [4.73, 4.61, 5.82, 4.65, 4.9],
barWidth: "20%",
label: {
normal: {
show: true,
position: "top",
textStyle: {
fontSize: 26
}
}
}
}
],
color: ["#49c8fb", "#82a0fa"]
};
(2)饼图
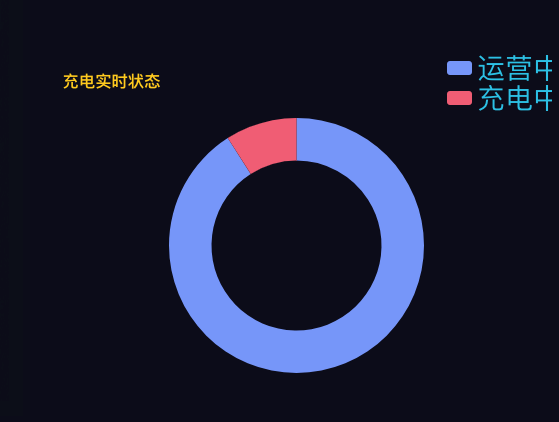
return {
tooltip: {
trigger: "item",
formatter: "{a} <br/>{b}: {c} ({d}%)"
},
legend: {
orient: "vertical",
right: 30,
top: 20,
bottom: 20,
data: ["运营中", "充电中"],
textStyle: {
fontSize: "200%",
color: "#33c8e8"
}
},
series: [
{
name: "充电实时状态",
type: "pie",
radius: ["40%", "60%"],
avoidLabelOverlap: true,
label: {
normal: {
show: false,
position: "center"
},
emphasis: {
show: false,
textStyle: {
fontSize: "30",
fontWeight: "bold"
}
}
},
data: [
{
value: 4776,
name: "运营中"
},
{
value: 476,
name: "充电中"
}
],
color: ["#82a0fa", "#f2687f"]
}
]
};


 390
390

 被折叠的 条评论
为什么被折叠?
被折叠的 条评论
为什么被折叠?
 到【灌水乐园】发言


