Java Memory Reloaded

本文详细介绍了JVM中可供所有线程访问的内存区域:方法区和堆。方法区负责存储类信息,包括常量池、方法代码、属性等;堆用于管理运行时创建的对象实例。文章还探讨了内存泄漏的原因及解决方法,并提供了配置建议。

摘要生成于 C知道 ,由 DeepSeek-R1 满血版支持, 前往体验 >

We can basically distinguish memory areas that are available for all threads in a JVM and those memory areas that are exclusively accessible from only one thread. The two areas that are available from all threads are the Method Area and the Heap.

The method area is responsible for storing class information. The Class-Loader will load the bytecode of a class and will pass it to the JVM. The JVM will generate an internal class representation of the bytecode and store it in the method area. The internal representation of a class will have the following data areas:

  • Runtime Constant Pool Numeric constants of the class of types int, long, float or double, String-constants and symbolic references to all methods, attributes and types of this class.
  • Method CodeThe implementation (code) of all methods of this class including constructors etc.
  • Attributes A list of all named attributes of this class.
  • FieldsValues of all fields of this class as references to the Runtime Constant Pool.
The method area can be part of the heap and will be created at runtime. The size of the method area can be static or dynamic and it does not have to provide a Garbage Collector.


The method area is implemented as a separated part: The Permanent Generation.

 PermGen is where the JVM stores classes. Classes are stored in PermGen using class name and class loader as the unique identifier. Each web application has its own class loader; this allows different versions of the same class (with the same name) to be used in different web applications without conflict. A web application also gets a new class loader when it is reloaded. Classes are removed from PermGen when the class loader is collected by the garbage collector. This normally happens after a web application stops. However, if something retains a reference to the web application class loader, it won't be garbage collected and the classes it loaded will remain in PermGen. Since PermGen is limited in size, this usually only has to happen a few times before all the PermGen is used. That is when the OOME occurs.


To prevent the OOME, it is necessary to ensure that nothing retains a reference to the web application class loader.

The second memory area that is available for all threads inside the JVM is the Heap. The Java heap manages instances of classes (objects) and arrays at runtime. The heap will be created at JVM startup and the size can be static or dynamic. The JVM specification mandates a Garbage Collection mechanism for reclaiming the memory of an object on the Java heap. The implementation of the Garbage Collector is not specified, but it is not allowed to provide the programmer with an explicit mechanism for deallocating the memory of an object.

Lets have a look at the Sun HotSpot implementation as an example:

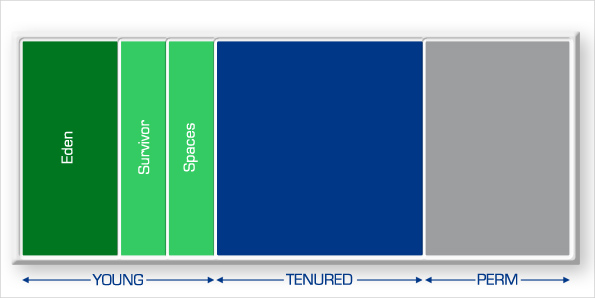
The heap is devided into two generations: The Young Generation and the Tenured Generation.


GC Roots:

  • current stack of all live threads,
  • static members of loaded classes,


public class MyFrame extends javax.swing.JFrame {
 
  // reachable via Classloader as soon class is loaded
  public static final ArrayList STATIC = new ArrayList();
 
  // as long as the JFrame is not dispose()'d,
  // it is reachable via a native window
  private final ArrayList jni = new ArrayList()
 
  // while this method is executing parameter is kept reachable,
  // even if it is not used
  private void myMethod(ArrayList parameter) {
 
    // while this method is running, this list is reachable from the stack
    ArrayList local = new ArrayList();
  }
 
}


Typical causes are static collections, which are used as a kind of cache. Usually objects are added, but never removed (Let’s face it: How often have you used add() and put() and how often used remove() methods?). Because the objects are referenced by the static collection, they cannot be freed up anymore, as the collection has a GC root reference via the classloader.

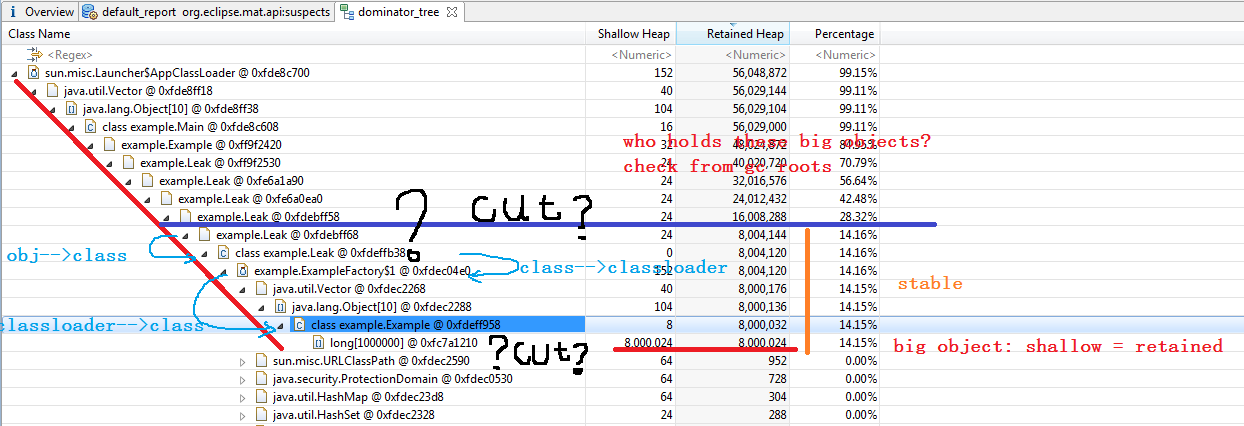
But the so called Retained Heap is more important for finding leaks, as it is the total size of all objects being kept alive by this dominator. To get this number, MAT needs to calculate the Retained Size by following all object references. As sorting by Retained Heap is very helpful for finding leaks, MAT displays the largest retained heaps in a pie chart.

 To determine who is creating these objects, or find out what the purpose of some structures is, the actual instances with their incoming and outgoing references are required. To get them, choose List Objects with incoming References from the context menu. Now a tree structure is displayed, showing all instances with all incoming references. Those references keep the object alive and prevented them from being garbage collected. Outgoing References are interesting as well, because they show the actual contents of the instances, helping to find out their purpose. 

Eclipse MAT allows comparing two heapdump snapshots and finding growing structures and instance counts. But this requires two well timed dumps. With some amount of load they should be minutes apart, with few load hours or days. Having a greater time lag helps in separating normal jitter from real issues. 


OOME 

The memory leaks all fit a common pattern. The web application creates an object of a class loaded by the web application class loader and then places this object in a registry that has been loaded by a different class loader. This is fine, as long as the object is removed from the registry when the web application stops. If the object is not removed, the registry retains a reference to the object, the object retains a reference to the class and the class retains a reference to the class loader. This pins the class loader in memory. This chain of references prevents the class loader from being garbage collected which in turn means that the PermGen used to store classes loaded by this class loader cannot be freed.


Servlet and J2EE containers have a clear purpose: to provide a set of services to independent and isolated components. That set of services is defined by the servlet and j2ee specifications. These specifications also define a mechanism for components to provide any libraries they depend on -- WEB-INF/lib.

It is therefore a complete mystery to me why people seem so keen to push libraries up out of the components where they belong and into the container's library directories. It's like pushing user code into the operating system kernel. Just don't do it.

A component naturally has references to objects in the container; the fact that the container provides classes (which are objects) that are visible to the component is the most obvious example. This causes no problems for garbage-collecting of the component. Problems come when the links become bidirectional, and classes within the container also have references to classes and objects within the components. The servlet and j2ee frameworks are carefully designed to avoid this where possible; where that is unavoidable the container *knows* about those situations and ensures the necessary references are cleared when a component is undeployed .


[1] Except for the brain-dead design of JDBC where jdbc drivers loaded via a custom classloader apparently get stored in a map within java.sql.DriverManager thereby causing cyclic references to that classloader.

[2] And except for the cache of classes held by the java.beans.Introspector class. In at least some versions of java, introspecting a class loaded by component's classloader causes a strong reference to that class to be put into a global cache. This means that the component's classloader is then prevented from being unloaded. A workaround is to call java.beans.Introspector.flushCaches() when the component is unloaded. Some containers may do this automatically; Apache Tomcat 5.x certainly does. In other cases, a ServletContextListener may need to be registered to force this to be done.


  ThreadLocal<Context[]> threadLocal =
new ThreadLocal<Context[]>() {
protected Context[] initialValue() {
return new Context[1];
}
};

void doSomethingInContext() {
Context[] c = threadLocal.get();
if (c[0] == null) {
try {
c[0] = new Context();
doSomething(c[0]);
}
finally {
c[0] = null;
}
} else {
doSomething(c[0]);
}
}

If we don't want our ThreadLocal instance to prevent the garbage collection of the Context class, we should use an Object[] instead of a Context[]. We might want to do this if library code (in the system classpath perhaps) references our thread local variable and a child class loader loads Context.


Sample

Configuration

To have a chance to find something during a post-mortem analysism, one should always use the JVM parameter -XX:+HeapDumpOnOutOfMemoryError.


-XX:MinHeapFreeRation=

  • Default is 40 (40%)
  • When the JVM allocates memory, it allocates enough to get 40% free
  • Huge chunks, very large default
  • Not important when -Xms==-Xmx


-XX:MaxHeapFreeRation=

  • Default 70%
  • To avoid over allocation
  • To give back memory not used

Young generation | Old generation

  • a good size for the YG is 33% of the total heap
  • Young generation 
  • All new objects are created here
  • Only move to Old gen if they survive one or more minor GC
  • Sized using
  1. -Xmn  -not preferred (fixed value)
  2. -XX:NewRatio=  --preferred (dynamic)

Survivor Spaces

  • 2, used during the GC Algorithm(minor collections)

Young Size (-XX:NewRatio)

Survivor Ratio (-XX:SurvivorRatio)

Eden space | Survivor space

new objects| TO FROM(64K default)


OLD Generation | Tenured space

(5MB MIN 44MB MAX)default


-XX:PermSize (initial)

-XX:MaxPermSize (max)


-XX:SoftRefLRUPolicyMSPerMB

转载于:https://www.cnblogs.com/grep/archive/2012/03/15/2397535.html

--- lowercaseOutputLabelNames: true lowercaseOutputName: true whitelistObjectNames: ["java.lang:type=OperatingSystem"] blacklistObjectNames: [] rules: - pattern: 'java.lang<type=OperatingSystem><>(committed_virtual_memory|free_physical_memory|free_swap_space|total_physical_memory|total_swap_space)_size:' name: os_$1_bytes type: GAUGE attrNameSnakeCase: true - pattern: 'java.lang<type=OperatingSystem><>((?!process_cpu_time)\w+):' name: os_$1 type: GAUGE attrNameSnakeCase: true 解释代码后,解释# HELP jvm_info VM version info # TYPE jvm_info gauge jvm_info{runtime="Java(TM) SE Runtime Environment",vendor="Oracle Corporation",version="1.7.0_79-b15",} 1.0 # HELP os_process_cpu_load java.lang:name=null,type=OperatingSystem,attribute=ProcessCpuLoad # TYPE os_process_cpu_load gauge os_process_cpu_load 0.07142857142857142 # HELP os_open_file_descriptor_count java.lang:name=null,type=OperatingSystem,attribute=OpenFileDescriptorCount # TYPE os_open_file_descriptor_count gauge os_open_file_descriptor_count 84.0 # HELP os_max_file_descriptor_count java.lang:name=null,type=OperatingSystem,attribute=MaxFileDescriptorCount # TYPE os_max_file_descriptor_count gauge os_max_file_descriptor_count 4096.0 # HELP os_total_swap_space_bytes java.lang:name=null,type=OperatingSystem,attribute=TotalSwapSpaceSize # TYPE os_total_swap_space_bytes gauge os_total_swap_space_bytes 4.160745472E9 # HELP os_total_physical_memory_bytes java.lang:name=null,type=OperatingSystem,attribute=TotalPhysicalMemorySize # TYPE os_total_physical_memory_bytes gauge os_total_physical_memory_bytes 8.201289728E9 # HELP os_system_cpu_load java.lang:name=null,type=OperatingSystem,attribute=SystemCpuLoad # TYPE os_system_cpu_load gauge os_system_cpu_load 0.10714285714285714 # HELP os_committed_virtual_memory_bytes java.lang:name=null,type=OperatingSystem,attribute=CommittedVirtualMemorySize # TYPE os_committed_virtual_memory_bytes gauge os_committed_virtual_memory_bytes 3.57505024E9 # HELP os_system_load_average java.lang:name=null,type=OperatingSystem,attribute=SystemLoadAverage # TYPE os_system_load_average gauge os_system_load_average 0.17 # HELP os_free_physical_memory_bytes java.lang:name=null,type=OperatingSystem,attribute=FreePhysicalMemorySize # TYPE os_free_physical_memory_bytes gauge os_free_physical_memory_bytes 6.509023232E9 # HELP os_available_processors java.lang:name=null,type=OperatingSystem,attribute=AvailableProcessors # TYPE os_available_processors gauge os_available_processors 2.0 # HELP os_free_swap_space_bytes java.lang:name=null,type=OperatingSystem,attribute=FreeSwapSpaceSize # TYPE os_free_swap_space_bytes gauge os_free_swap_space_bytes 4.160745472E9 # HELP jmx_scrape_duration_seconds Time this JMX scrape took, in seconds. # TYPE jmx_scrape_duration_seconds gauge jmx_scrape_duration_seconds 0.001119413 # HELP jmx_scrape_error Non-zero if this scrape failed. # TYPE jmx_scrape_error gauge jmx_scrape_error 0.0 # HELP jmx_scrape_cached_beans Number of beans with their matching rule cached # TYPE jmx_scrape_cached_beans gauge jmx_scrape_cached_beans 0.0 # HELP jvm_buffer_pool_used_bytes Used bytes of a given JVM buffer pool. # TYPE jvm_buffer_pool_used_bytes gauge jvm_buffer_pool_used_bytes{pool="direct",} 8192.0 jvm_buffer_pool_used_bytes{pool="mapped",} 0.0 # HELP jvm_buffer_pool_capacity_bytes Bytes capacity of a given JVM buffer pool. # TYPE jvm_buffer_pool_capacity_bytes gauge jvm_buffer_pool_capacity_bytes{pool="direct",} 8192.0 jvm_buffer_pool_capacity_bytes{pool="mapped",} 0.0 # HELP jvm_buffer_pool_used_buffers Used buffers of a given JVM buffer pool. # TYPE jvm_buffer_pool_used_buffers gauge jvm_buffer_pool_used_buffers{pool="direct",} 1.0 jvm_buffer_pool_used_buffers{pool="mapped",} 0.0 # HELP jvm_memory_objects_pending_finalization The number of objects waiting in the finalizer queue. # TYPE jvm_memory_objects_pending_finalization gauge jvm_memory_objects_pending_finalization 0.0 # HELP jvm_memory_bytes_used Used bytes of a given JVM memory area. # TYPE jvm_memory_bytes_used gauge jvm_memory_bytes_used{area="heap",} 2.38314152E8 jvm_memory_bytes_used{area="nonheap",} 5.160628E7 # HELP jvm_memory_bytes_committed Committed (bytes) of a given JVM memory area. # TYPE jvm_memory_bytes_committed gauge jvm_memory_bytes_committed{area="heap",} 5.19569408E8 jvm_memory_bytes_committed{area="nonheap",} 5.2822016E7 # HELP jvm_memory_bytes_max Max (bytes) of a given JVM memory area. # TYPE jvm_memory_bytes_max gauge jvm_memory_bytes_max{area="heap",} 1.823473664E9 jvm_memory_bytes_max{area="nonheap",} 1.3631488E8 # HELP jvm_memory_bytes_init Initial bytes of a given JVM memory area. # TYPE jvm_memory_bytes_init gauge jvm_memory_bytes_init{area="heap",} 1.28145152E8 jvm_memory_bytes_init{area="nonheap",} 2.4576E7 # HELP jvm_memory_pool_bytes_used Used bytes of a given JVM memory pool. # TYPE jvm_memory_pool_bytes_used gauge jvm_memory_pool_bytes_used{pool="Code Cache",} 3370048.0 jvm_memory_pool_bytes_used{pool="PS Eden Space",} 1.78591736E8 jvm_memory_pool_bytes_used{pool="PS Survivor Space",} 2.4223408E7 jvm_memory_pool_bytes_used{pool="PS Old Gen",} 3.5499008E7 jvm_memory_pool_bytes_used{pool="PS Perm Gen",} 4.8236232E7 # HELP jvm_memory_pool_bytes_committed Committed bytes of a given JVM memory pool. # TYPE jvm_memory_pool_bytes_committed gauge jvm_memory_pool_bytes_committed{pool="Code Cache",} 4063232.0 jvm_memory_pool_bytes_committed{pool="PS Eden Space",} 4.09468928E8 jvm_memory_pool_bytes_committed{pool="PS Survivor Space",} 2.4641536E7 jvm_memory_pool_bytes_committed{pool="PS Old Gen",} 8.5458944E7 jvm_memory_pool_bytes_committed{pool="PS Perm Gen",} 4.8758784E7 # HELP jvm_memory_pool_bytes_max Max bytes of a given JVM memory pool. # TYPE jvm_memory_pool_bytes_max gauge jvm_memory_pool_bytes_max{pool="Code Cache",} 5.0331648E7 jvm_memory_pool_bytes_max{pool="PS Eden Space",} 6.31242752E8 jvm_memory_pool_bytes_max{pool="PS Survivor Space",} 2.4641536E7 jvm_memory_pool_bytes_max{pool="PS Old Gen",} 1.367343104E9 jvm_memory_pool_bytes_max{pool="PS Perm Gen",} 8.5983232E7 # HELP jvm_memory_pool_bytes_init Initial bytes of a given JVM memory pool. # TYPE jvm_memory_pool_bytes_init gauge jvm_memory_pool_bytes_init{pool="Code Cache",} 2555904.0 jvm_memory_pool_bytes_init{pool="PS Eden Space",} 3.2505856E7 jvm_memory_pool_bytes_init{pool="PS Survivor Space",} 5242880.0 jvm_memory_pool_bytes_init{pool="PS Old Gen",} 8.5458944E7 jvm_memory_pool_bytes_init{pool="PS Perm Gen",} 2.2020096E7 # HELP jvm_memory_pool_collection_used_bytes Used bytes after last collection of a given JVM memory pool. # TYPE jvm_memory_pool_collection_used_bytes gauge jvm_memory_pool_collection_used_bytes{pool="PS Eden Space",} 0.0 jvm_memory_pool_collection_used_bytes{pool="PS Survivor Space",} 2.4223408E7 jvm_memory_pool_collection_used_bytes{pool="PS Old Gen",} 0.0 jvm_memory_pool_collection_used_bytes{pool="PS Perm Gen",} 0.0 # HELP jvm_memory_pool_collection_committed_bytes Committed after last collection bytes of a given JVM memory pool. # TYPE jvm_memory_pool_collection_committed_bytes gauge jvm_memory_pool_collection_committed_bytes{pool="PS Eden Space",} 4.09468928E8 jvm_memory_pool_collection_committed_bytes{pool="PS Survivor Space",} 2.4641536E7 jvm_memory_pool_collection_committed_bytes{pool="PS Old Gen",} 0.0 jvm_memory_pool_collection_committed_bytes{pool="PS Perm Gen",} 0.0 # HELP jvm_memory_pool_collection_max_bytes Max bytes after last collection of a given JVM memory pool. # TYPE jvm_memory_pool_collection_max_bytes gauge jvm_memory_pool_collection_max_bytes{pool="PS Eden Space",} 6.31242752E8 jvm_memory_pool_collection_max_bytes{pool="PS Survivor Space",} 2.4641536E7 jvm_memory_pool_collection_max_bytes{pool="PS Old Gen",} 1.367343104E9 jvm_memory_pool_collection_max_bytes{pool="PS Perm Gen",} 8.5983232E7 # HELP jvm_memory_pool_collection_init_bytes Initial after last collection bytes of a given JVM memory pool. # TYPE jvm_memory_pool_collection_init_bytes gauge jvm_memory_pool_collection_init_bytes{pool="PS Eden Space",} 3.2505856E7 jvm_memory_pool_collection_init_bytes{pool="PS Survivor Space",} 5242880.0 jvm_memory_pool_collection_init_bytes{pool="PS Old Gen",} 8.5458944E7 jvm_memory_pool_collection_init_bytes{pool="PS Perm Gen",} 2.2020096E7 # HELP jvm_classes_currently_loaded The number of classes that are currently loaded in the JVM # TYPE jvm_classes_currently_loaded gauge jvm_classes_currently_loaded 8198.0 # HELP jvm_classes_loaded_total The total number of classes that have been loaded since the JVM has started execution # TYPE jvm_classes_loaded_total counter jvm_classes_loaded_total 8198.0 # HELP jvm_classes_unloaded_total The total number of classes that have been unloaded since the JVM has started execution # TYPE jvm_classes_unloaded_total counter jvm_classes_unloaded_total 0.0 # HELP jmx_exporter_build_info A metric with a constant '1' value labeled with the version of the JMX exporter. # TYPE jmx_exporter_build_info gauge jmx_exporter_build_info{version="0.18.0",name="jmx_prometheus_javaagent",} 1.0 # HELP jvm_threads_current Current thread count of a JVM # TYPE jvm_threads_current gauge jvm_threads_current 29.0 # HELP jvm_threads_daemon Daemon thread count of a JVM # TYPE jvm_threads_daemon gauge jvm_threads_daemon 28.0 # HELP jvm_threads_peak Peak thread count of a JVM # TYPE jvm_threads_peak gauge jvm_threads_peak 31.0 # HELP jvm_threads_started_total Started thread count of a JVM # TYPE jvm_threads_started_total counter jvm_threads_started_total 33.0 # HELP jvm_threads_deadlocked Cycles of JVM-threads that are in deadlock waiting to acquire object monitors or ownable synchronizers # TYPE jvm_threads_deadlocked gauge jvm_threads_deadlocked 0.0 # HELP jvm_threads_deadlocked_monitor Cycles of JVM-threads that are in deadlock waiting to acquire object monitors # TYPE jvm_threads_deadlocked_monitor gauge jvm_threads_deadlocked_monitor 0.0 # HELP jvm_threads_state Current count of threads by state # TYPE jvm_threads_state gauge jvm_threads_state{state="NEW",} 0.0 jvm_threads_state{state="WAITING",} 14.0 jvm_threads_state{state="TIMED_WAITING",} 7.0 jvm_threads_state{state="UNKNOWN",} 0.0 jvm_threads_state{state="TERMINATED",} 0.0 jvm_threads_state{state="RUNNABLE",} 8.0 jvm_threads_state{state="BLOCKED",} 0.0 # HELP process_cpu_seconds_total Total user and system CPU time spent in seconds. # TYPE process_cpu_seconds_total counter process_cpu_seconds_total 17.38 # HELP process_start_time_seconds Start time of the process since unix epoch in seconds. # TYPE process_start_time_seconds gauge process_start_time_seconds 1.749808021796E9 # HELP process_open_fds Number of open file descriptors. # TYPE process_open_fds gauge process_open_fds 84.0 # HELP process_max_fds Maximum number of open file descriptors. # TYPE process_max_fds gauge process_max_fds 4096.0 # HELP process_virtual_memory_bytes Virtual memory size in bytes. # TYPE process_virtual_memory_bytes gauge process_virtual_memory_bytes 3.575046144E9 # HELP process_resident_memory_bytes Resident memory size in bytes. # TYPE process_resident_memory_bytes gauge process_resident_memory_bytes 6.88590848E8 # HELP jmx_config_reload_failure_total Number of times configuration have failed to be reloaded. # TYPE jmx_config_reload_failure_total counter jmx_config_reload_failure_total 0.0 # HELP jmx_config_reload_success_total Number of times configuration have successfully been reloaded. # TYPE jmx_config_reload_success_total counter jmx_config_reload_success_total 0.0 # HELP jvm_memory_pool_allocated_bytes_total Total bytes allocated in a given JVM memory pool. Only updated after GC, not continuously. # TYPE jvm_memory_pool_allocated_bytes_total counter jvm_memory_pool_allocated_bytes_total{pool="PS Survivor Space",} 3.523552E7 jvm_memory_pool_allocated_bytes_total{pool="Code Cache",} 3718208.0 jvm_memory_pool_allocated_bytes_total{pool="PS Perm Gen",} 4.5692072E7 jvm_memory_pool_allocated_bytes_total{pool="PS Eden Space",} 1.43917056E9 jvm_memory_pool_allocated_bytes_total{pool="PS Old Gen",} 3.5499008E7 # HELP jvm_gc_collection_seconds Time spent in a given JVM garbage collector in seconds. # TYPE jvm_gc_collection_seconds summary jvm_gc_collection_seconds_count{gc="PS Scavenge",} 11.0 jvm_gc_collection_seconds_sum{gc="PS Scavenge",} 0.15 jvm_gc_collection_seconds_count{gc="PS MarkSweep",} 0.0 jvm_gc_collection_seconds_sum{gc="PS MarkSweep",} 0.0 # HELP jmx_config_reload_failure_created Number of times configuration have failed to be reloaded. # TYPE jmx_config_reload_failure_created gauge jmx_config_reload_failure_created 1.749808021823E9 # HELP jmx_config_reload_success_created Number of times configuration have successfully been reloaded. # TYPE jmx_config_reload_success_created gauge jmx_config_reload_success_created 1.749808021822E9 # HELP jvm_memory_pool_allocated_bytes_created Total bytes allocated in a given JVM memory pool. Only updated after GC, not continuously. # TYPE jvm_memory_pool_allocated_bytes_created gauge jvm_memory_pool_allocated_bytes_created{pool="PS Survivor Space",} 1.749808022447E9 jvm_memory_pool_allocated_bytes_created{pool="Code Cache",} 1.749808022448E9 jvm_memory_pool_allocated_bytes_created{pool="PS Perm Gen",} 1.749808022448E9 jvm_memory_pool_allocated_bytes_created{pool="PS Eden Space",} 1.749808022448E9 jvm_memory_pool_allocated_bytes_created{pool="PS Old Gen",} 1.749808022448E9
06-14
评论
添加红包

请填写红包祝福语或标题

红包个数最小为10个

红包金额最低5元

当前余额3.43前往充值 >
需支付:10.00
成就一亿技术人!
领取后你会自动成为博主和红包主的粉丝 规则
hope_wisdom
发出的红包
实付
使用余额支付
点击重新获取
扫码支付
钱包余额 0

抵扣说明:

1.余额是钱包充值的虚拟货币,按照1:1的比例进行支付金额的抵扣。
2.余额无法直接购买下载,可以购买VIP、付费专栏及课程。

余额充值