


<!DOCTYPE html>
<html lang="en">
<head>
<meta charset="UTF-8">
<title>Document</title>
<script src="https://cdn.bootcss.com/jquery/2.2.3/jquery.js"></script>
<script src="https://cdn.bootcss.com/echarts/3.5.4/echarts.js"></script>
</head>
<body>
<div id="pie01" style="width:500px;height:350px;margin-top:10px"></div>
<script>
var myChart2 = echarts.init(document.getElementById('pie01'));
option = {
title: {
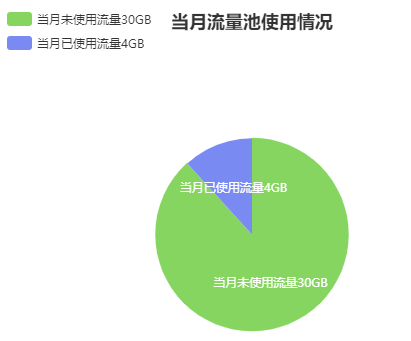
text: '当月流量池使用情况',
subtext: '',
x: 'center'
},
tooltip: {},
legend: {
orient: 'vertical',
x: 'left',
y: 'top',
data: ['当月未使用流量' + 30 + 'GB', '当月已使用流量' + 4 + 'GB']
},
color: ['#86d560', '#798af2'],
series: [{
name: '',
type: 'pie',
radius: '55%',
center: ['50%', '65%'],
data: [{
value: 30,
name: '当月未使用流量' + 30 + 'GB'
},
{
value: 4,
name: '当月已使用流量' + 4 + 'GB'
}
],
itemStyle: {
emphasis: {
shadowBlur: 10,
shadowOffsetX: 0,
shadowColor: 'rgba(0, 0, 0, 0.5)'
},
normal: {
label: {
show: true,
position: 'inner',
}
}
}
}]
};
myChart2.setOption(option);
</script>
</body>
</html>


 7万+
7万+

 被折叠的 条评论
为什么被折叠?
被折叠的 条评论
为什么被折叠?
 到【灌水乐园】发言


