


 本文介绍了Java内存管理的各种技巧,包括如何使用jmap获取内存dump、jstack进行系统运行缓慢及FullGC问题的排查,以及如何通过不同的JVM参数来监控和调整内存使用情况。

java 获取内存dump 的几种方式
1、获取内存详情:jmap -dump:format=b,file=e.bin pid
这种方式可以用 jvisualvm.exe 进行内存分析,或者采用 Eclipse Memory Analysis Tools (MAT)这个工具
2. 获取内存dump: jmap -histo:live pid
这种方式会先出发fullgc,所有如果不希望触发fullgc 可以使用jmap -histo pid
3.第三种方式:jdk启动加参数:
-XX:+HeapDumpBeforeFullGC
-XX:HeapDumpPath=/httx/logs/dump
这种方式会产生dump日志,再通过jvisualvm.exe 或者Eclipse Memory Analysis Tools 工具进行分析
jstack
系统运行缓慢,CPU 100%,以及Full GC次数过多问题的排查思路
Trace跟踪参数
-verbose:gc
-XX:+printGC
可以打印GC的简要信息
[GC 4790K->374K(15872K), 0.0001606 secs]
[GC 4790K->374K(15872K), 0.0001474 secs]
[GC 4790K->374K(15872K), 0.0001563 secs]
[GC 4790K->374K(15872K), 0.0001682 secs]
-XX:+PrintGCTimeStamps
打印CG发生的时间戳
[GC[DefNew: 4416K->0K(4928K), 0.0001897 secs] 4790K->374K(15872K), 0.0002232 secs]
 [Times: user=0.00 sys=0.00, real=0.00 secs]
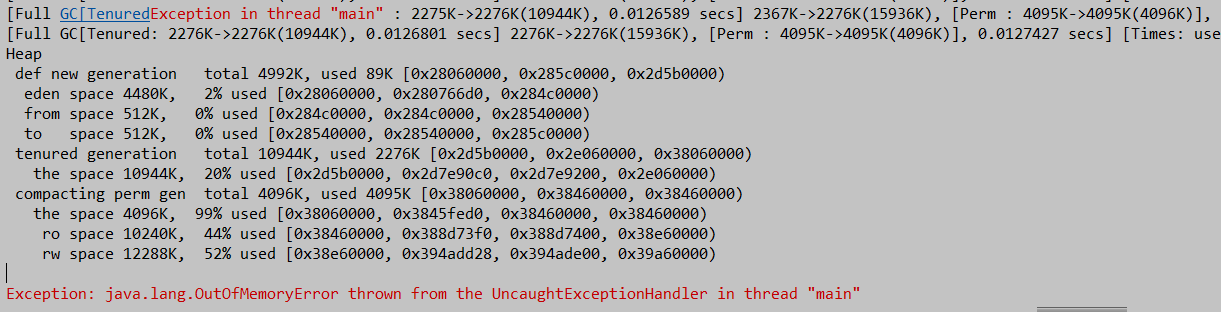
-XX:+PrintGCDetails 打印GC详细信息
Heap
 def new generation   total 13824K, used 11223K [0x27e80000, 0x28d80000, 0x28d80000)
  eden space 12288K,  91% used [0x27e80000, 0x28975f20, 0x28a80000)
  from space 1536K,   0% used [0x28a80000, 0x28a80000, 0x28c00000)
  to   space 1536K,   0% used [0x28c00000, 0x28c00000, 0x28d80000)
 tenured generation   total 5120K, used 0K [0x28d80000, 0x29280000, 0x34680000)
   the space 5120K,   0% used [0x28d80000, 0x28d80000, 0x28d80200, 0x29280000)
 compacting perm gen  total 12288K, used 142K [0x34680000, 0x35280000, 0x38680000)
   the space 12288K,   1% used [0x34680000, 0x346a3a90, 0x346a3c00, 0x35280000)
    ro space 10240K,  44% used [0x38680000, 0x38af73f0, 0x38af7400, 0x39080000)
    rw space 12288K,  52% used [0x39080000, 0x396cdd28, 0x396cde00, 0x39c80000)
-Xloggc:log/gc.log
指定GC log的位置,以文件输出
帮助开发人员分析问题
-XX:+PrintHeapAtGC
每次一次GC后,都打印堆信息
{Heap before GC invocations=0 (full 0):
 def new generation   total 3072K, used 2752K [0x33c80000, 0x33fd0000, 0x33fd0000)
  eden space 2752K, 100% used [0x33c80000, 0x33f30000, 0x33f30000)
  from space 320K,   0% used [0x33f30000, 0x33f30000, 0x33f80000)
  to   space 320K,   0% used [0x33f80000, 0x33f80000, 0x33fd0000)
 tenured generation   total 6848K, used 0K [0x33fd0000, 0x34680000, 0x34680000)
   the space 6848K,   0% used [0x33fd0000, 0x33fd0000, 0x33fd0200, 0x34680000)
 compacting perm gen  total 12288K, used 143K [0x34680000, 0x35280000, 0x38680000)
   the space 12288K,   1% used [0x34680000, 0x346a3c58, 0x346a3e00, 0x35280000)
    ro space 10240K,  44% used [0x38680000, 0x38af73f0, 0x38af7400, 0x39080000)
    rw space 12288K,  52% used [0x39080000, 0x396cdd28, 0x396cde00, 0x39c80000)
[GC[DefNew: 2752K->320K(3072K), 0.0014296 secs] 2752K->377K(9920K), 0.0014604 secs] [Times: user=0.00 sys=0.00, real=0.00 secs]
Heap after GC invocations=1 (full 0):
 def new generation   total 3072K, used 320K [0x33c80000, 0x33fd0000, 0x33fd0000)
  eden space 2752K,   0% used [0x33c80000, 0x33c80000, 0x33f30000)
  from space 320K, 100% used [0x33f80000, 0x33fd0000, 0x33fd0000)
  to   space 320K,   0% used [0x33f30000, 0x33f30000, 0x33f80000)
 tenured generation   total 6848K, used 57K [0x33fd0000, 0x34680000, 0x34680000)
   the space 6848K,   0% used [0x33fd0000, 0x33fde458, 0x33fde600, 0x34680000)
 compacting perm gen  total 12288K, used 143K [0x34680000, 0x35280000, 0x38680000)
   the space 12288K,   1% used [0x34680000, 0x346a3c58, 0x346a3e00, 0x35280000)
    ro space 10240K,  44% used [0x38680000, 0x38af73f0, 0x38af7400, 0x39080000)
    rw space 12288K,  52% used [0x39080000, 0x396cdd28, 0x396cde00, 0x39c80000)
}
-XX:+TraceClassLoading
监控类的加载
[Loaded java.lang.Object from shared objects file]
[Loaded java.io.Serializable from shared objects file]
[Loaded java.lang.Comparable from shared objects file]
[Loaded java.lang.CharSequence from shared objects file]
[Loaded java.lang.String from shared objects file]
[Loaded java.lang.reflect.GenericDeclaration from shared objects file]
[Loaded java.lang.reflect.Type from shared objects file]
-XX:+PrintClassHistogram
按下Ctrl+Break后,打印类的信息:
分别显示:序号、实例数量、总大小、类型
 num     #instances         #bytes  class name
----------------------------------------------
   1:        890617      470266000  [B
   2:        890643       21375432  java.util.HashMap$Node
   3:        890608       14249728  java.lang.Long
   4:            13        8389712  [Ljava.util.HashMap$Node;
   5:          2062         371680  [C
   6:           463          41904  java.lang.Class
堆的分配参数
-Xmx
指定最大堆
–Xms
指定最小堆
-Xmn
设置新生代大小
-XX:NewRatio
新生代(eden+2*s)和老年代(不包含永久区)的比值
4 表示 新生代:老年代=1:4,即年轻代占堆的1/5
-XX:SurvivorRatio
设置两个Survivor区和eden的比
8表示 两个Survivor:eden=2:8,即一个Survivor占年轻代的1/10
-XX:+HeapDumpPath
导出OOM的路径
-XX:+HeapDumpOnOutOfMemoryError
OOM时导出堆到文件
-Xmx20m -Xms5m -XX:HeapDumpOnOutofMemoryError -XX:HeapDumpPath=/apps/logs/oomError.dump
分配了20M最大空间 ,启动 最小空间5M , 发生了 内存溢出错误时 dump路径为/apps/logs/oomError.dump
-XX:OnOutOfMemoryError
在OOM时,执行一个脚本
"-XX:OnOutOfMemoryError=D:/tools/jdk1.7_40/bin/printstack.bat %p“
当程序OOM时,在D:/a.txt中将会生成线程的dump
可以在OOM时,发送邮件,甚至是重启程序
# pritstack.bat中内容:
D:/tools/jdk1.7_40/bin/jstack -F %1 > D:/a.txt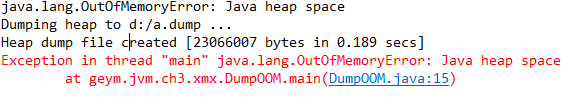
堆的分配参数 – 总结
根据实际事情调整新生代和幸存代的大小
官方推荐新生代占堆的3/8
幸存代占新生代的1/10
在OOM时,记得Dump出堆,确保可以排查现场问题
永久区分配参数
-XX:PermSize -XX:MaxPermSize
设置永久区的初始空间和最大空间
这两个参数的大小决定了一个系统可以容纳java类的多少
实验:使用CGLIB等库的时候,可能会产生大量的类,这些类,有可能撑爆永久区导致OOM
for(int i=0;i<100000;i++){
    CglibBean bean = new CglibBean("geym.jvm.ch3.perm.bean"+i,new HashMap());
}
在使用java7时,如果web项目中jsp数量比较多,可能出现Perm OOM。使用cglib库的一些框架,如hibernate,可能出现Perm OOM。
栈的分配参数
-Xss
为每个线程分配独立的栈空间
通常只有几百K
决定了函数调用的深度
局部变量、参数 分配在栈上
java.lang.StackOverflowError异常是由于当前线程的栈满了 ,也就是函数调用层级过多导致。比如死递归。


 960
960

 被折叠的 条评论
为什么被折叠?
被折叠的 条评论
为什么被折叠?
 到【灌水乐园】发言


