


 本文介绍如何使用Pygal绘制不同类型的浏览器使用趋势图,包括线图、水平线图和叠加线图,并展示了如何处理时间相关的数据标签。
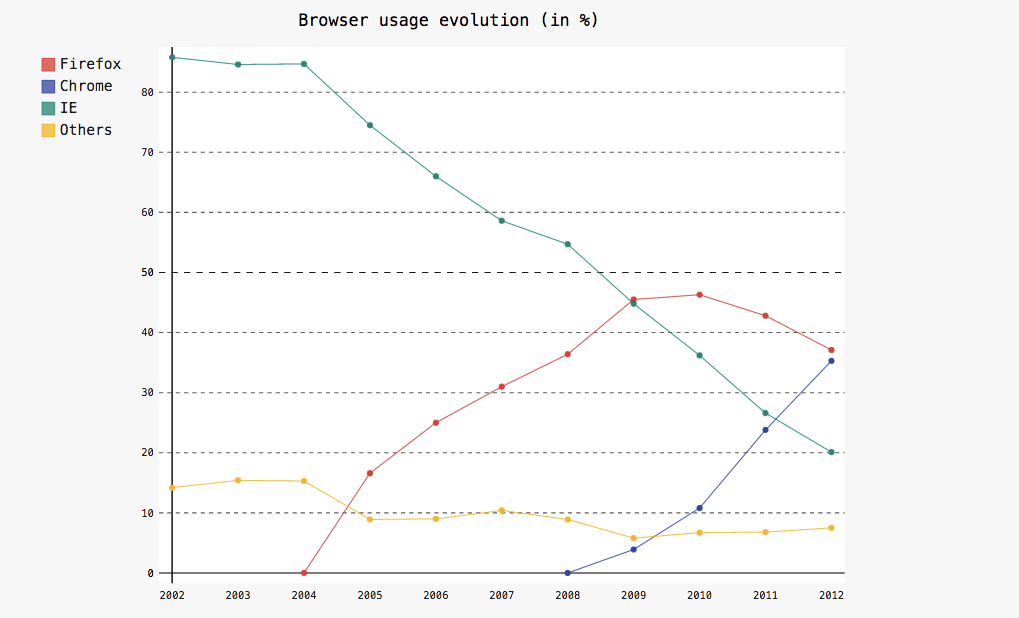
线图:
import pygal

line_chart = pygal.Line()
line_chart.title = 'Browser usage evolution (in %)'
line_chart.x_labels = map(str, range(2002, 2013))
line_chart.add('Firefox', [None, None,    0, 16.6,   25,   31, 36.4, 45.5, 46.3, 42.8, 37.1])
line_chart.add('Chrome',  [None, None, None, None, None, None,    0,  3.9, 10.8, 23.8, 35.3])
line_chart.add('IE',      [85.8, 84.6, 84.7, 74.5,   66, 58.6, 54.7, 44.8, 36.2, 26.6, 20.1])
line_chart.add('Others',  [14.2, 15.4, 15.3,  8.9,    9, 10.4,  8.9,  5.8,  6.7,  6.8,  7.5])
line_chart.render_to_file('bar_chart.svg')
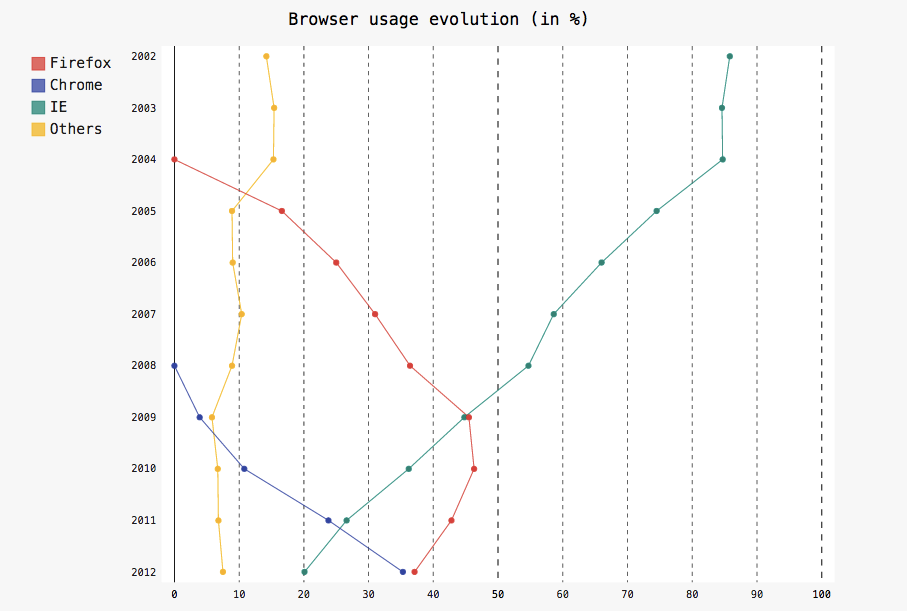
水平线图:
line_chart = pygal.HorizontalLine()
line_chart.title = 'Browser usage evolution (in %)'
line_chart.x_labels = map(str, range(2002, 2013))
line_chart.add('Firefox', [None, None,    0, 16.6,   25,   31, 36.4, 45.5, 46.3, 42.8, 37.1])
line_chart.add('Chrome',  [None, None, None, None, None, None,    0,  3.9, 10.8, 23.8, 35.3])
line_chart.add('IE',      [85.8, 84.6, 84.7, 74.5,   66, 58.6, 54.7, 44.8, 36.2, 26.6, 20.1])
line_chart.add('Others',  [14.2, 15.4, 15.3,  8.9,    9, 10.4,  8.9,  5.8,  6.7,  6.8,  7.5])
line_chart.range = [0, 100]
line_chart.render_to_file('bar_chart.svg')
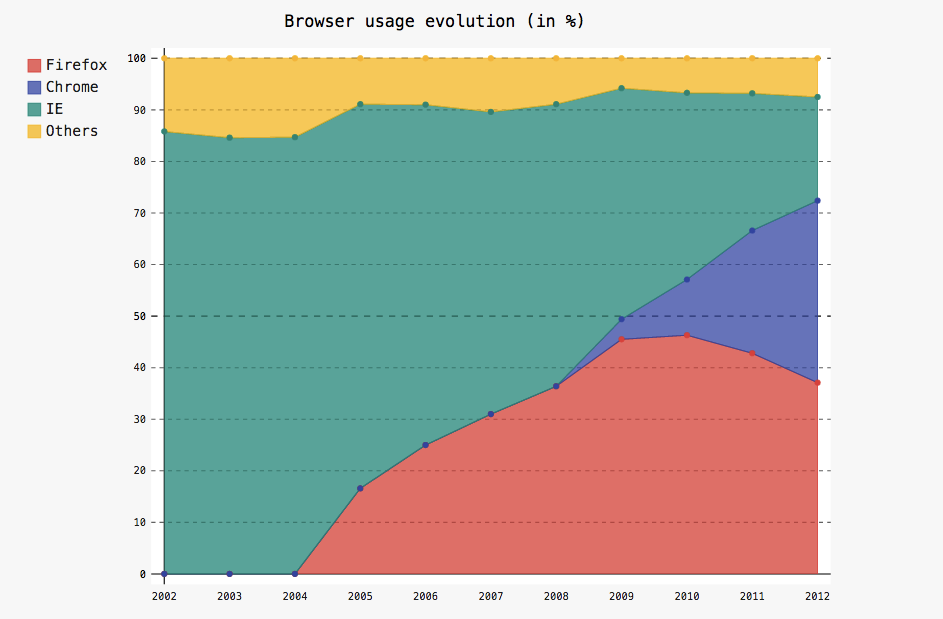
叠加测线:
line_chart = pygal.StackedLine(fill=True)
line_chart.title = 'Browser usage evolution (in %)'
line_chart.x_labels = map(str, range(2002, 2013))
line_chart.add('Firefox', [None, None, 0, 16.6,   25,   31, 36.4, 45.5, 46.3, 42.8, 37.1])
line_chart.add('Chrome',  [None, None, None, None, None, None,    0,  3.9, 10.8, 23.8, 35.3])
line_chart.add('IE',      [85.8, 84.6, 84.7, 74.5,   66, 58.6, 54.7, 44.8, 36.2, 26.6, 20.1])
line_chart.add('Others',  [14.2, 15.4, 15.3,  8.9,    9, 10.4,  8.9,  5.8,  6.7,  6.8,  7.5])
line_chart.render_to_file('bar_chart.svg')
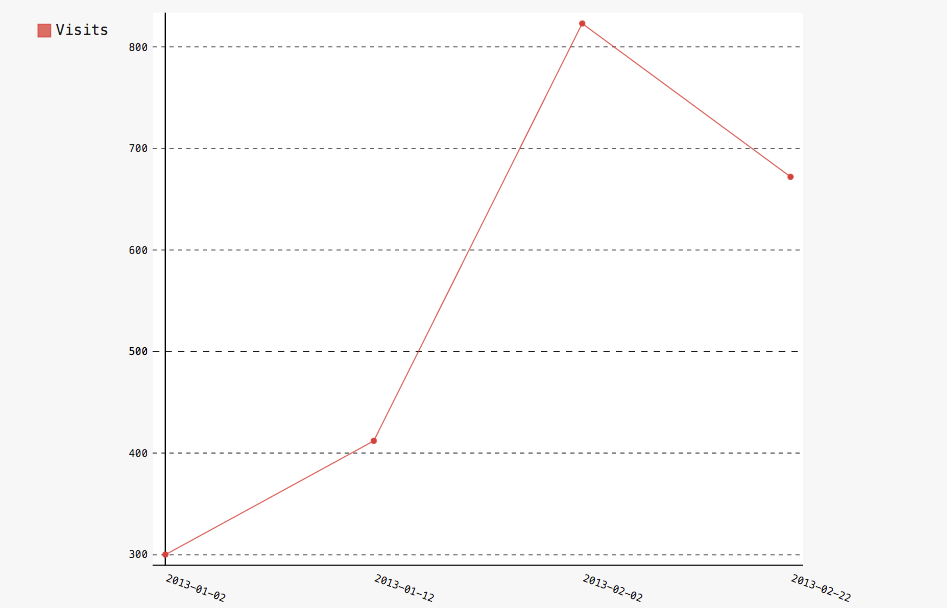
对于时间相关的图,只需格式化标签或使用xy图表的一个变体:
from datetime import datetime
date_chart = pygal.Line(x_label_rotation=20)
date_chart.x_labels = map(lambda d: d.strftime('%Y-%m-%d'), [
 datetime(2013, 1, 2),
 datetime(2013, 1, 12),
 datetime(2013, 2, 2),
 datetime(2013, 2, 22)])
date_chart.add("Visits", [300, 412, 823, 672])
date_chart.render_to_file('bar_chart.svg')


 4446
4446

 被折叠的 条评论
为什么被折叠?
被折叠的 条评论
为什么被折叠?
 到【灌水乐园】发言


