曲线拟合——(2)拉普拉斯/瑞利/对数正态 曲线

本文介绍拉普拉斯、瑞利及对数正态曲线的拟合方法,包括理论推导与MATLAB代码实现。重点讲解如何通过优化准则函数进行参数估计。

摘要生成于 C知道 ,由 DeepSeek-R1 满血版支持, 前往体验 >

作者:桂。

时间:2017-03-15  21:12:18

链接:http://www.cnblogs.com/xingshansi/p/6556517.html 

声明:欢迎被转载,不过记得注明出处哦~


本文为拟合系列中的一部分,主要介绍拉普拉斯曲线 、瑞利曲线、对数正态曲线的拟合,并给出理论推导。


一、理论分析

  A-拉普拉斯(Laplace)

对于拉普拉斯分布:

$f(x) = \frac{1}{{2b}}{e^{ - \frac{{\left| {x - \mu } \right|}}{b}}}$

假设数据点{$x_i$,$y_i$}($i = 1,2,3,...N$)符合Laplace分布曲线,对其进行拟合(曲线拟合不同于分布拟合,需要乘以幅度$A$),给出准则函数:


对准则函数$J_0$求解即可实现参数估计。

由于求导比较复杂(可以借助Mathmatica/Maple),因此这里换一个思路:如果$e^x$—>$y$,则$x$—>$lny$,重新定义准则函数:

后续求参就方便了。

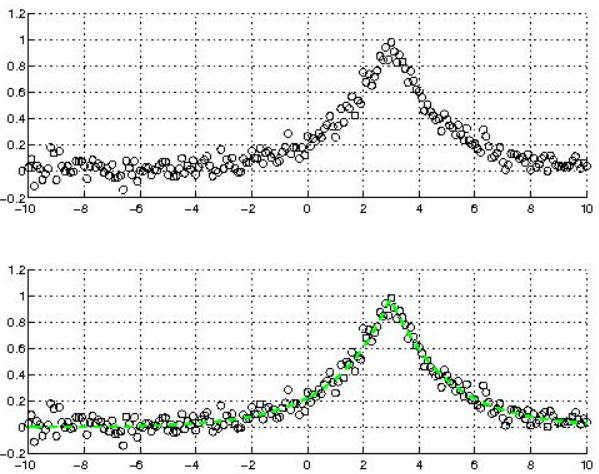
给出调用fit实现的代码:

clc;clear all;close all;
%generate the orignal data
mu = 3;
b = 2;
A = 4;
x=-10:.1:10;
y=A/2/b*exp(-abs(x-mu)/b)+0.05*randn(1,length(x));
subplot 211
scatter(x,y,'k');grid on;
 
%%curve fitting
%2-Laplace distribution
f = fittype('a*exp(-(abs(x-b)/c))');
[cfun,gof] = fit(x(:),y(:),f);
yo = cfun.a*exp(-(abs(x-cfun.b)/cfun.c));
%plot
subplot 212
scatter(x,y,'k');hold on;
grid on;
plot(x,yo,'g--','linewidth',2);

对应结果图:
  B-瑞利(Rayleigh)

对于瑞利分布:

$f(x) = \frac{x}{{{\sigma ^2}}}{e^{ - \frac{{{x^2}}}{{2{\sigma ^2}}}}}$

给出准则函数:

只涉及一个参数$\sigma$,同样是利用对数转化,进而求取参数估计。

  C-对数正态(Log-normal)

对数正态就是正态分布的变形,即$lnx$—>$x$,求参过程完全一致,可以参考:正态曲线拟合


二、拟合优化

对于求取对数的估计准则,都会有误差在0处较大的问题。关于优化的小trick,在分析正态分布曲线拟合时,已经给出详细理论,此处不再展开。

转载于:https://www.cnblogs.com/xingshansi/p/6556517.html

% This folder contains a collection of "fitting" functions. % (Some has demo options - the third section) % The GENERAL input to the functions should be samples of the distribution. % % for example, if we are to fit a normal distribution ('gaussian') with a mean "u" and varaince "sig"^2 % then the samples will distribute like: % samples = randn(1,10000)*sig + u % %fitting with Least-Squares is done on the histogram of the samples. % fitting with Maximum likelihood is done directly on the samples. % % % Contents of this folder % ======================= % 1) Maximum likelihood estimators % 2) Least squares estimators % 3) EM algorithm for estimation of multivariant gaussian distribution (mixed gaussians) % 4) added folders: Create - which create samples for the EM algorithm test % Plot - used to plot each of the distributions (parametric plot) % % % % % % Maximum likelihood estimators % ============================= % fit_ML_maxwell - fit maxwellian distribution % fit_ML_rayleigh - fit rayleigh distribution % (which is for example: sqrt(abs(randn)^2+abs(randn)^2)) % fit_ML_laplace - fit laplace distribution % fit_ML_log_normal- fit log-normal distribution % fit_ML_normal - fit normal (gaussian) distribution % % NOTE: all estimators are efficient estimators. for this reason, the distribution % might be written in a different way, for example, the "Rayleigh" distribution % is given with a parameter "s" and not "s^2". % % % least squares estimators % ========================= % fit_maxwell_pdf - fits a given curve of a maxwellian distribution % fit_rayleigh_pdf - fits a given curve of a rayleigh distribution % % NOTE: these fit function are used on a histogram output which is like a sampled % distribution function. the given curve MUST be normalized, since the estimator % is trying to fit a normalized distribution function. % % % % % Multivariant Gaussian distribution % ================================== % for demo of 1
评论
添加红包

请填写红包祝福语或标题

红包个数最小为10个

红包金额最低5元

当前余额3.43前往充值 >
需支付:10.00
成就一亿技术人!
领取后你会自动成为博主和红包主的粉丝 规则
hope_wisdom
发出的红包
实付
使用余额支付
点击重新获取
扫码支付
钱包余额 0

抵扣说明:

1.余额是钱包充值的虚拟货币,按照1:1的比例进行支付金额的抵扣。
2.余额无法直接购买下载,可以购买VIP、付费专栏及课程。

余额充值