


 本文详细介绍了如何使用Highcharts创建高响应式的图表,包括下载、解压、引入JS文件、编写HTML代码等步骤,并提供了调整图表大小的示例代码。
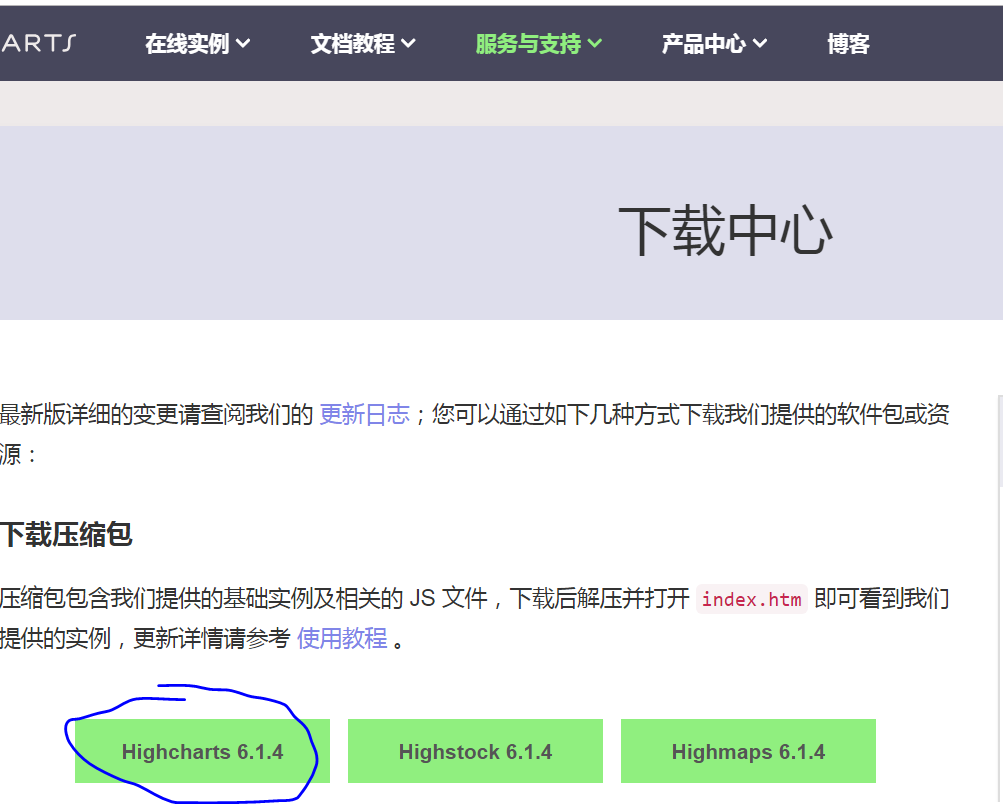
1、下载
https://www.hcharts.cn/download
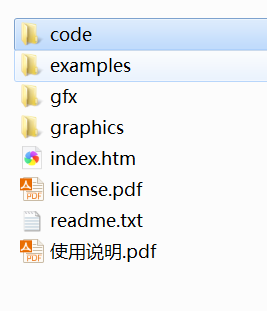
2、解压

目录结构:
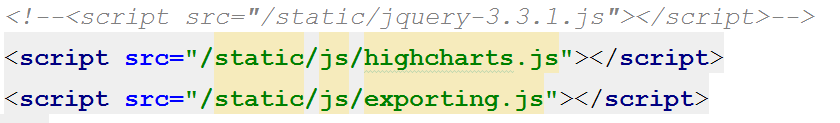
3、将code的highcharts.js 和 code\modules的exporting.js引入html中,可以不要jquery.js
4、html代码:
<div id="container"></div>
<button id="large" onclick="setSize(800)">放大</button>
<button id="small" onclick="setSize(400)">缩小</button>

<script>
var chart = Highcharts.chart('container', {
    chart: {
        type: 'column'
    },
    title: {
        text: '高级响应式图表'
    },
    subtitle: {
        text: '请点击按钮查看坐标轴变化'
    },
    xAxis: {
        categories: ['一月', '二月', '三月', '四月', '五月', '六月',
                     '七月', '八月', '九月', '十月', '十一月', '十二月']
    },
    yAxis: {
        labels: {
            x: -15
        },
        title: {
            text: '项目'
        }
    },
    series: [{
        name: '销售',
        data: [434, 523, 345, 785, 565, 843, 726, 590, 665, 434, 312, 432]
    }],
    responsive: {
        rules: [{
            condition: {
                maxWidth: 500
            },
            // Make the labels less space demanding on mobile
            chartOptions: {
                xAxis: {
                    labels: {
                        formatter: function () {
                            return this.value.replace('月', '')
                        }
                    }
                },
                yAxis: {
                    labels: {
                        align: 'left',
                        x: 0,
                        y: -2
                    },
                    title: {
                        text: ''
                    }
                }
            }
        }]
    }
});
function setSize(width) {
    chart.setSize(width, 300);
}
</script>
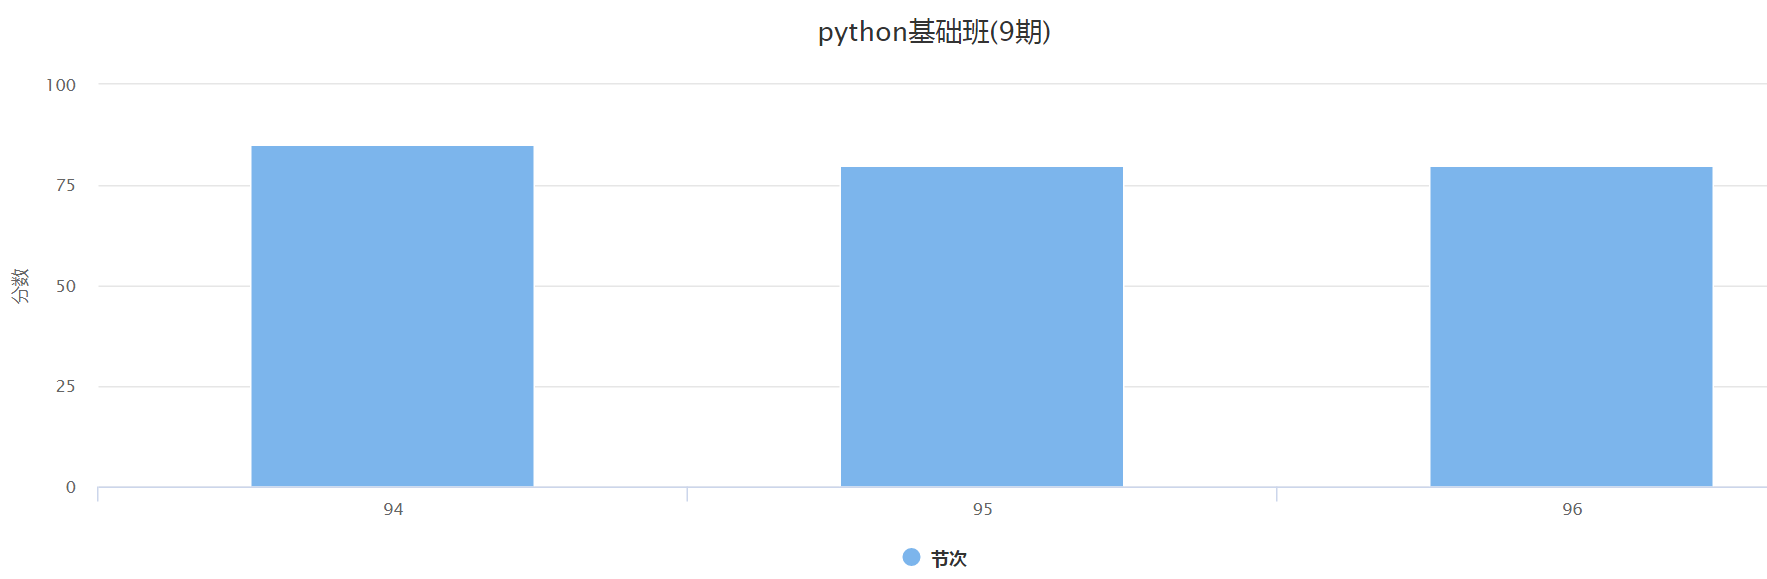
5、效果:


 1389
1389

 被折叠的 条评论
为什么被折叠?
被折叠的 条评论
为什么被折叠?
 到【灌水乐园】发言


