


 本文介绍了Node_exporter的安装步骤及其与Prometheus的配置方法,并提供了Grafana的模板下载地址。
Node_exporter是可以在* Nix和Linux系统上运行的计算机度量标准的导出器。
Node_exporter 主要用于暴露 metrics 给 Prometheus,其中 metrics 包括:cpu 的负载,内存的使用情况,网络等。
1、安装Node_exporter
解压缩node_exporter并将目录重命名为“node_exporter”放到/usr/local/下。
tar -xf node_exporter-0.17.0.linux-amd64.tar.gz
mv node_exporter-0.17.0.linux-amd64 /usr/local/node_exporter
放在后台启动即可:
nohup ./node_exporter &
2、修改Prometheus的配置文件 prometheus.yml的scrape_configs下添加node_exporter,后重启Prometheus。
scrape_configs:
  # The job name is added as a label `job=<job_name>` to any timeseries scraped from this config.
  - job_name: 'prometheus'

    # metrics_path defaults to '/metrics'
    # scheme defaults to 'http'.

    static_configs:
    - targets: ['localhost:9090']
  - job_name: 'node_exporter'
    static_configs:
      - targets:
        - '172.31.182.140:9100'
        - '172.31.182.141:9100'
        - '172.31.182.142:9100'
        - '172.31.182.143:9100'
        - '172.31.182.144:9100'
        - '172.31.182.145:9100'
        - '172.31.182.146:9100'
        - '172.31.182.147:9100'
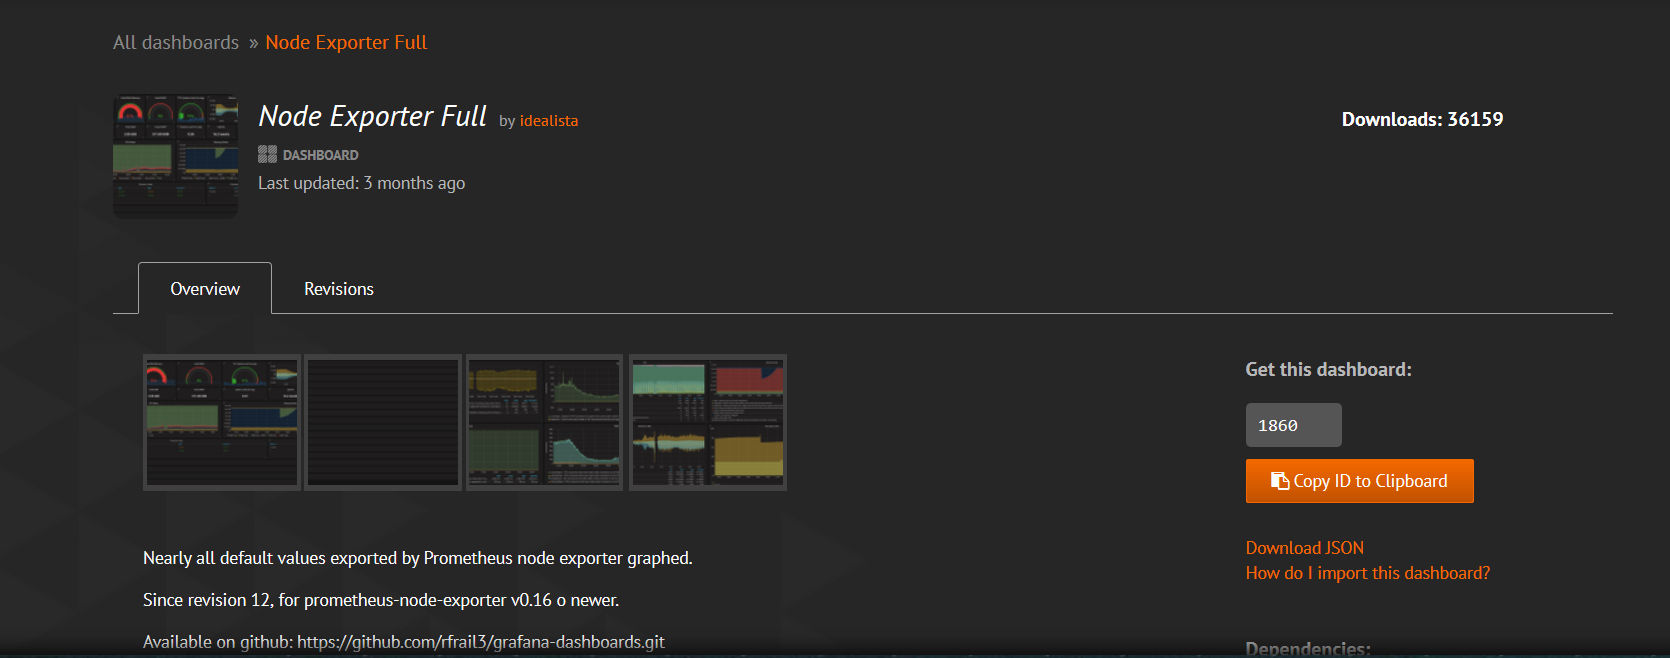
3、添加granfana
模板下载地址:https://grafana.com/api/dashboards/1860/revisions/13/download
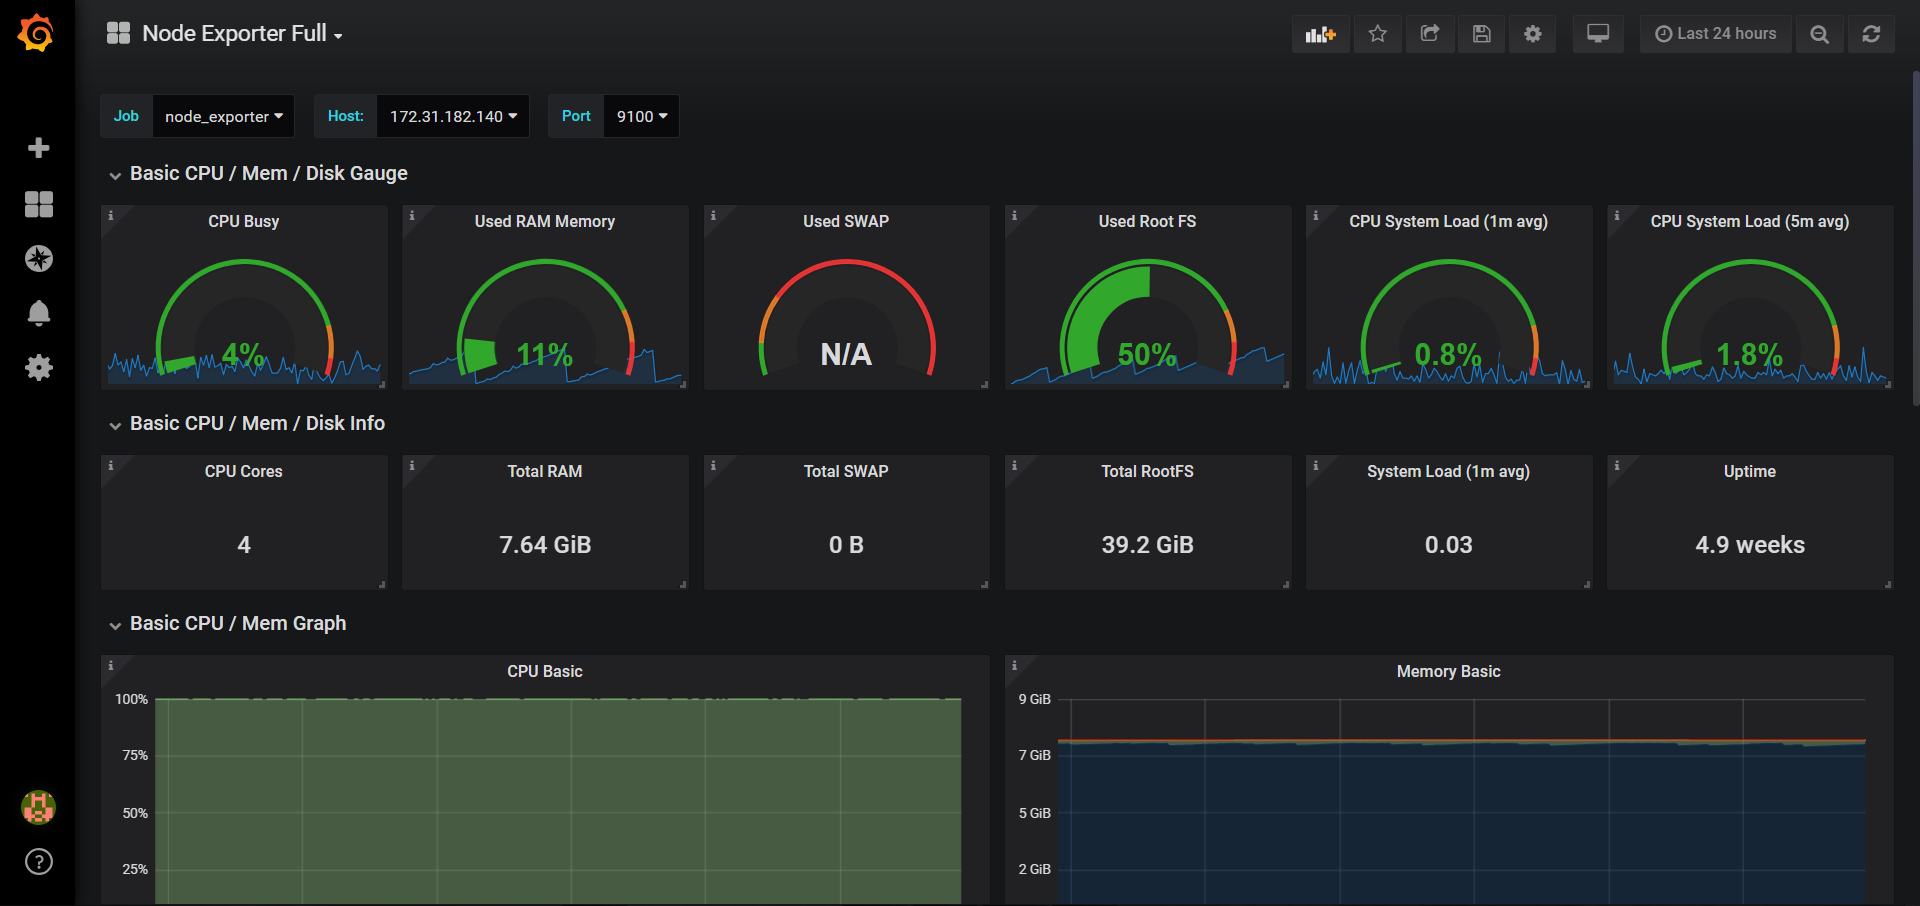
导入后的效果:


 1560
1560

 被折叠的 条评论
为什么被折叠?
被折叠的 条评论
为什么被折叠?
 到【灌水乐园】发言


