


 本文介绍如何使用sklearn.datasets.make_blobs生成用于聚类的数据集。通过设置不同参数,如样本数量、特征数、中心点及方差等,可以灵活创建多样化的数据集。
# 生成用于聚类的各向同性高斯blob
sklearn.datasets.make_blobs(n_samples = 100,n_features = 2,center = 3,cluster_std = 1.0,center_box =( - 10.0,10.0),shuffle = True,random_state = None)
参数
n_samples: int, optional (default=100)
待生成的样本的总数。
n_features: int, optional (default=2)
每个样本的特征数。
centers: int or array of shape [n_centers, n_features], optional (default=3)
要生成的样本中心(类别)数,或者是确定的中心点。
cluster_std: float or sequence of floats, optional (default=1.0)
每个类别的方差,例如我们希望生成2类数据,其中一类比另一类具有更大的方差,可以将cluster_std设置为[1.0,3.0]。
center_box: pair of floats (min, max), optional (default=(-10.0, 10.0))
中心随机生成时每个聚类中心的边界框。
shuffle:布尔值,可选(默认= True)
对样本进行随机播放。
random_state:int,RandomState实例或None,可选(default = None)
如果为int,random_state是随机数生成器使用的种子; 如果RandomState实例,random_state是随机数生成器; 如果为None,则随机数生成器是np.random使用的RandomState实例。
返回
X : array of shape [n_samples, n_features]
生成的样本数据集。
y : array of shape [n_samples]
样本数据集的标签。
例子
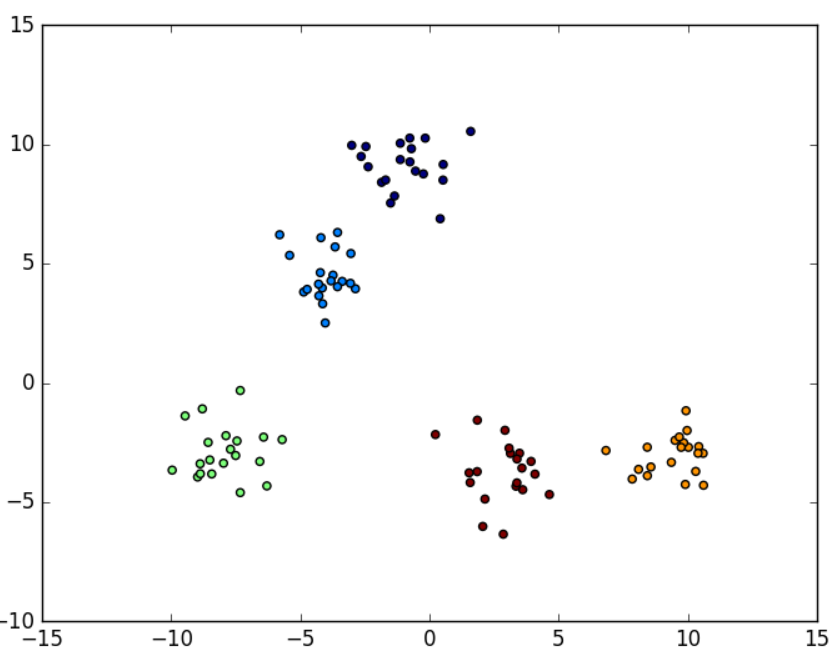
例如要生成5类数据(100个样本,每个样本有2个特征),代码如下
from sklearn.datasets import make_blobs
from matplotlib import pyplot

data, label = make_blobs(n_samples=100, n_features=2, centers=5)
# 绘制样本显示
pyplot.scatter(data[:, 0], data[:, 1], c=label)
pyplot.show()
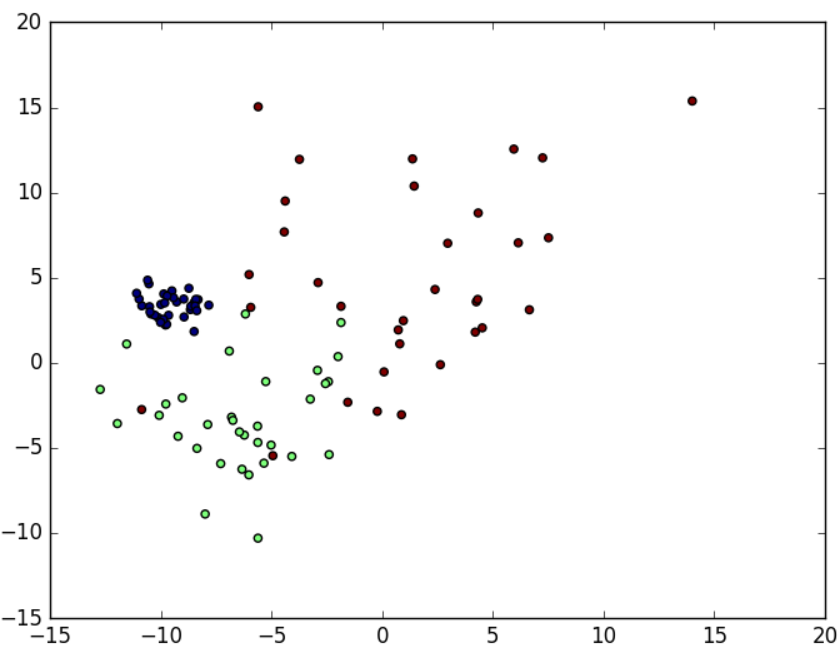
如果希望为每个类别设置不同的方差,需要在上述代码中加入cluster_std参数:
from sklearn.datasets import make_blobs
from matplotlib import pyplot

data, label = make_blobs(n_samples=10, n_features=2, centers=3, cluster_std=[0.8, 2.5, 4.5])
# 绘制样本显示
pyplot.scatter(data[:, 0], data[:, 1], c=label)
pyplot.show()


 1万+
1万+

 被折叠的 条评论
为什么被折叠?
被折叠的 条评论
为什么被折叠?
 到【灌水乐园】发言


