


 本文介绍如何使用Python的matplotlib库绘制平方数的折线图和散点图,包括自定义颜色和保存图表的方法。
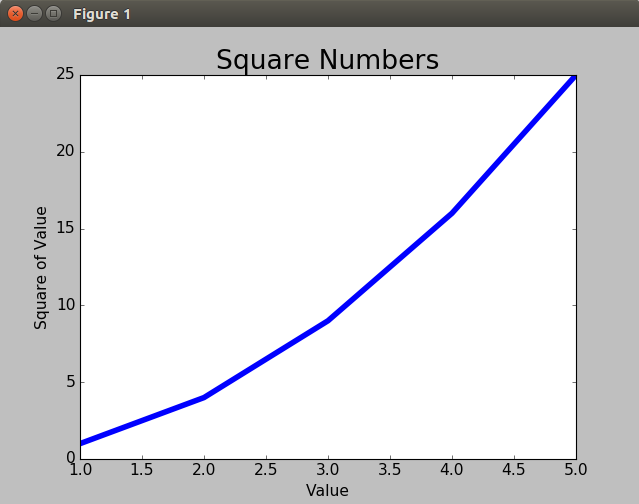
1.平方数折线图
import matplotlib.pyplot as plt

input_values=[1,2,3,4,5]
squares=[1,4,9,16,25]
plt.plot(input_values,squares,linewidth=5)

plt.title("Square Numbers", fontsize=24)
plt.xlabel("Value", fontsize=14)
plt.ylabel("Square of Value", fontsize=14)

plt.tick_params(axis='both',labelsize=14)
plt.show()
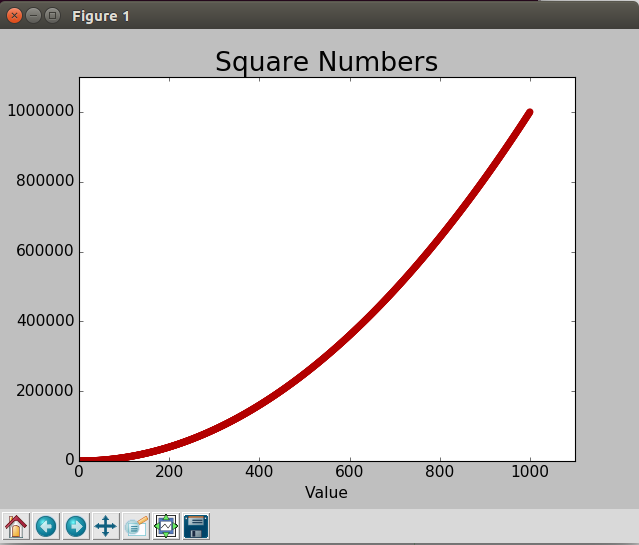
2.平方数自动生成散点图
import matplotlib.pyplot as plt

x_values=list(range(1,1001))
y_values=[x**2 for x in x_values]

plt.scatter(x_values,y_values,c=(0.7,0,0),edgecolor='none',s=40)

plt.title("Square Numbers",fontsize=24)
plt.xlabel("Value",fontsize=14)
plt.ylabel("Square of Value",fontsize=14)

plt.tick_params(axis='both',which='major',labelsize=14)

plt.axis([0,1100,0,1100000])

plt.show()
散点默认为蓝色点和黑色轮廓,可通过参数c指定自定义颜色,并将其设置一个元组,其中包含三个0~1之间的小数值,它们分别表示红色、绿色和蓝色分量。
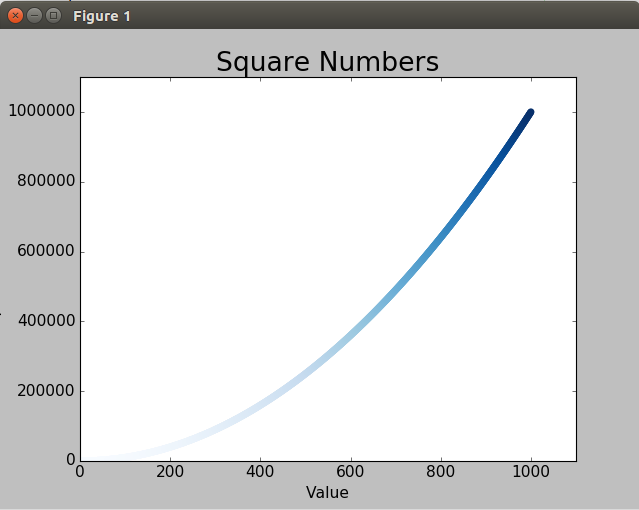
使用颜色映射:
plt.scatter(x_values,y_values,c=y_values,cmap=plt.cm.Blues,edgecolor='none',s=40)
自动保存图表可将对plt.show()的调用替换为对plt.savefig()的调用:
plt.savefig('squares_plot.png',bbox_inchs='tight')
其中第二个参数指定将图表多余的空白区域裁剪掉。


 219
219

 被折叠的 条评论
为什么被折叠?
被折叠的 条评论
为什么被折叠?
 到【灌水乐园】发言


