import matplotlib.pyplot as plt
import numpy as np
import pandas as pd
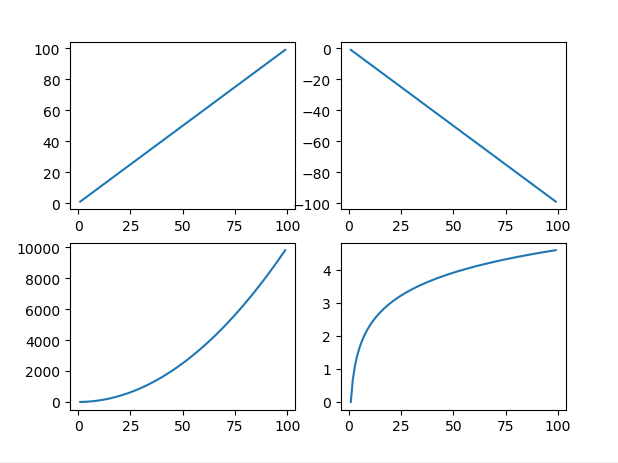
x=np.arange(1,100)
fig=plt.figure()
ax1=fig.add_subplot(221) #2*2的图形 在第一个位置
ax1.plot(x,x)
ax2=fig.add_subplot(222)
ax2.plot(x,-x)
ax3=fig.add_subplot(223)
ax3.plot(x,x**2)
ax3=fig.add_subplot(224)
ax3.plot(x,np.log(x))
plt.show()
同时绘制两张图
import matplotlib.pyplot as plt
import numpy as np
import pandas as pd
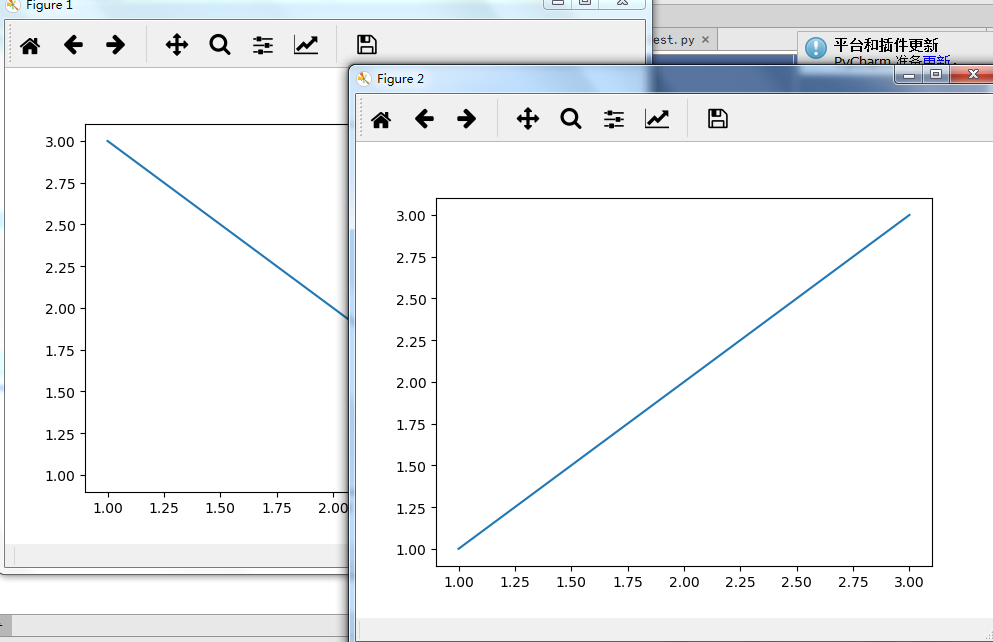
fig1=plt.figure()
ax1=fig1.add_subplot(111)
ax1.plot([1,2,3],[3,2,1])
fig2=plt.figure()
ax2=fig2.add_subplot(111)
ax2.plot([1,2,3],[1,2,3])
plt.show()


 本文介绍了使用Matplotlib库绘制不同类型的二维图形的方法,并展示了如何在同一窗口中展示多个子图,以及如何创建独立的多个图表。


 1232
1232

 被折叠的 条评论
为什么被折叠?
被折叠的 条评论
为什么被折叠?
 到【灌水乐园】发言


