


方法一:主要是inshow()函数的使用
首先基本的画图流程为:
import matplotlib.pyplot as plt
#创建新的figure
fig = plt.figure()
#必须通过add_subplot()创建一个或多个绘图
#ax = fig.add_subplot(221)
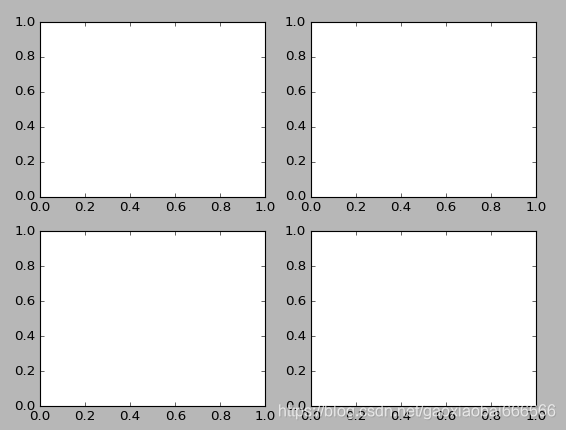
#绘制2x2两行两列共四个图,编号从1开始
ax1 = fig.add_subplot(221)
ax2 = fig.add_subplot(222)
ax3 = fig.add_subplot(223)
ax4 = fig.add_subplot(224)
#图片的显示
plt.show()然后就会有四个在同一张图上的figure
然后我们可以用python中的Matplotlib库中的,imshow()函数实现绘图。imshow()可以用来绘制热力图
#coding=utf-8
import matplotlib.pyplot as plt
import numpy as np

points = np.arange(-5,5,0.01)

xs,ys = np.meshgrid(points,points)

z = np.sqrt(xs**2 + ys**2)

#创建新的figure
fig = plt.figure()

#绘制2x2两行两列共四个图,编号从1开始
ax = fig.add_subplot(221)
ax.imshow(z)

ax = fig.add_subplot(222)
#使用自定义的colormap(灰度图)
ax.imshow(z,cmap=plt.cm.gray)

ax = fig.add_subplot(223)
#使用自定义的colormap
ax.im
最低0.47元/天 解锁文章


 被折叠的 条评论
为什么被折叠?
被折叠的 条评论
为什么被折叠?
 到【灌水乐园】发言


