 决策树ID3算法详解


 本文深入探讨了经典的决策树算法ID3,介绍了其通过计算信息熵选择最优特征进行决策的过程,展示了如何利用Python实现ID3算法,包括构建决策树、绘制决策树以及存储决策树的完整流程。
机器学习实战 -- 决策树(ID3)
ID3是什么我也不知道,不急,知道他是干什么的就行
ID3是最经典最基础的一种决策树算法,他会将每一个特征都设为决策节点,有时候,一个数据集中,某些特征属性是不必要的或者说信息熵增加的很少,这种决策信息是可以合并的修剪的,但是ID3算法并不会这么做
决策树的核心论点是香农信息论,借此理论得出某种分类情况下的信息熵
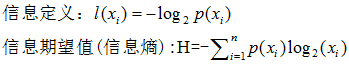
某种决策下,分类趋向于统一,则香农熵很小(熵描述杂乱无序的程度,如果'YES', 'NO' 可能性对半分,那么这个分类决策最终是趋向于杂乱的熵值会很大, 只出现 'YES' 那么表示这个决策的结果趋向于一个统一的结果,固定,那么熵就很小)
综上:某个决策节点下,信息熵越小,说明这个决策方式越好
整个决策树分为三个部分:1.学习出决策树 2.绘制决策树 3.存储决策树
比起sklearn这个决策树更简单,没有考虑基尼系数,只关注信息熵
-
from math import log
-
-
'''''
-
计算香农熵
-
'''
-
def calcShannonEnt(dataset):
-
'''''
-
dataset —— 数据集 eg:[[f1,f2,f3,L1],[f1,f2,f3,L2]]
-
f表示特征,L表示标签
-
-
shannonEnt —— 香农熵
-
'''
-
numEntries=len(dataset) #统计数据集中样本数量
-
labelCounts={}
-
for featVec in dataset:
-
currentLabel=featVec[-1]
-
if currentLabel not in labelCounts.keys():
-
labelCounts[currentLabel]=0
-
labelCounts[currentLabel] +=1
-
-
#for循环统计数据集中各个标签量的个数。如:有几种情况下是'no'
-
-
shannonEnt=0.0
-
for key in labelCounts:
-
prob=float(labelCounts[key])/numEntries
-
shannonEnt-=prob*log(prob,2)
-
-
#香农熵计算见word
-
return shannonEnt
-
-
'''''
-
根据特征值划分数据集
-
'''
-
def splitDataSet(dataSet,axis,value):
-
'''''
-
dataset ——要数据集
-
axis ——要从哪一个特征划分
-
value ——精确到特征下的哪一个值
-
eg:(dataSet,0,0) 表示划分dataSet数据集,按照第0个特征值为0时划分
-
实际效果:将每个样本中特征值符合(axis,value)定位条件的样本找出来,并删除这个特征
-
-
retDataSet——按照特征值划分出的数据子集
-
'''
-
retDataSet=[]
-
for featVec in dataSet:
-
if featVec[axis] == value: #找到定位点
-
_=featVec.copy() #拷贝,防止删除特征时影响到原数据集
-
del _[axis] #删除特征
-
retDataSet.append(_) #将该样本添加到子集中
-
return retDataSet
-
-
-
'''''
-
判断当前数据集中最好的数据划分形式
-
'''
-
def Best(dataSet):
-
numFeatures=len(dataSet[0])-1
-
baseEntropy=calcShannonEnt(dataSet)
-
bestInfoGain=0.0
-
bestFeature=-1
-
for i in range(numFeatures):
-
#将每个特征都作为决策节点进行一一尝试,找出最佳
-
featList=[example[i] for example in dataSet]
-
#提取每个样本中第i个特征
-
uniqueVals=set(featList)
-
newEntropy=0.0
-
for value in uniqueVals:
-
#一个特征下有几个特征值,分特征值进行香农熵计算
-
subDataSet=splitDataSet(dataSet,i,value)
-
prob=len(subDataSet)/float(len(dataSet))
-
newEntropy+=prob*calcShannonEnt(subDataSet)
-
infoGain=baseEntropy-newEntropy
-
if(infoGain>bestInfoGain):
-
bestInfoGain=infoGain
-
bestFeature=i
-
return bestFeature
-
-
'''''
-
多数表决
-
当所有特征都决策完时,标签还没有统一,此时就使用多数服从少数的原则
-
该分类下,哪种标签多,就以哪种标签作为分类依据
-
'''
-
def majorityCnt(classList):
-
-
'''''
-
classlist ——关于标签的列表
-
-
书上的
-
classCount={}
-
for vote in classList:
-
if vote not in classCount.keys():
-
classCount[vote]=0
-
classCount[vote]+=1
-
sortedClassCount=sorted(classCount.items(),
-
key=operator.itemgetter(1),
-
reverse=True)
-
return sortedClassCount[0][0]
-
'''
-
value=0
-
for i in classList:
-
if classlist.count(i) >value:
-
max_label=i
-
value=classlist.count(i)
-
return max_label
-
-
def createTree(dataSet,labels):
-
classList=[example[-1] for example in dataSet]
-
#标签中只有一种了,说明到叶子节点了,直接返回标签
-
if len(set(classList)) ==1:
-
return classList[0]
-
#样本中没有特征了,只能多数服从小数了
-
if len(dataSet[0])==1:
-
return majorityCnt(classList)
-
#先找好决策节点
-
bestFeat=Best(dataSet)
-
bestFeatlabel=labels[bestFeat]
-
myTree={bestFeatlabel:{}}
-
del labels[bestFeat]#此处,标签列表要随着子集变化而变化
-
-
#找出决策节点后,继续深入分析特征值
-
featValues=[example[bestFeat] for example in dataSet]
-
uniqueVals=set(featValues)
-
#遍历特征值进行树创建
-
for value in uniqueVals:
-
subLabels=labels[:]
-
#此处,记得保留最顶层的标签,不能递归的时候让孙子辈的子节点把爷爷辈的标签给改了
-
myTree[bestFeatlabel][value]=createTree(
-
splitDataSet(dataSet,bestFeat,value),
-
subLabels)
-
-
return myTree
-
-
-
'''''
-
-------------------------
-
绘制决策树
-
主要是接通matplotlib中的annotate函数来绘画
-
实际上现在可以借用graphviz来绘制,没去了解这个东西
-
-------------------------
-
'''
-
import matplotlib.pyplot as plt
-
#建立绘图参数
-
decisionNode=dict(boxstyle='sawtooth',fc='0.8')
-
leafNode=dict(boxstyle='round',fc='0.8')
-
arrow_args=dict(arrowstyle='<-')
-
-
#创建图纸,以及设立好初始xoff和yoff
-
def createPlot(inTree):
-
fig=plt.figure(1,facecolor='white')
-
fig.clf()
-
axprops=dict(xticks=[],yticks=[])
-
createPlot.ax1=plt.subplot(111,frameon=False,**axprops)
-
plotTree.totalW=float(getNumLeafs(inTree))
-
plotTree.totalD=float(getTreeDepth(inTree))
-
plotTree.xoff=-0.5/plotTree.totalW
-
plotTree.yoff=1.0
-
plotTree(inTree,(0.5,1.0),'')
-
plt.show()
-
-
#递归绘制决策树,遇到决策节点就递归,所以最后会有那条+1.0/plotTree.totalD语句返回分叉点
-
def plotTree(myTree,parentPt,nodeTxt):
-
numLeafs=getNumLeafs(myTree)
-
depth=getTreeDepth(myTree)
-
firstStr=list(myTree.keys())[0]
-
cntrPt=(plotTree.xoff+(1+float(numLeafs))/2.0/plotTree.totalW,plotTree.yoff)
-
#上面关于子节点的x值计算,有点绕,可以慢慢调整参数值,知道如何影响决策图的
-
plotMidText(cntrPt,parentPt,nodeTxt)
-
plotNode(firstStr,cntrPt,parentPt,decisionNode)
-
secondDict=myTree[firstStr]
-
-
plotTree.yoff=plotTree.yoff-1.0/plotTree.totalD
-
for key in secondDict.keys():
-
if type(secondDict[key])==dict:
-
plotTree(secondDict[key],cntrPt,str(key))
-
else:
-
plotTree.xoff=plotTree.xoff+1.0/plotTree.totalW
-
plotNode(secondDict[key],(plotTree.xoff,plotTree.yoff),cntrPt,leafNode)
-
plotMidText((plotTree.xoff,plotTree.yoff),cntrPt,str(key))
-
plotTree.yoff=plotTree.yoff+1.0/plotTree.totalD
-
-
-
'''''
-
获取叶子节点数量
-
遍历所有节点,只要不是dict即不是决策节点,numLeafs就+1
-
'''
-
def getNumLeafs(myTree):
-
numLeafs=0
-
firstStr=list(myTree.keys())[0]
-
secondDict=myTree[firstStr]
-
for key in secondDict.keys():
-
if type(secondDict[key]) ==dict:
-
numLeafs+=getNumLeafs(secondDict[key])
-
else:
-
numLeafs+=1
-
return numLeafs
-
-
'''''
-
获取决策节点的数量
-
遍历所有节点,只要是dict,即决策节点,深度就+1
-
注意的是,没遍历一个特征就需要和储存的depth比较一番,选取最深的才是树的深度
-
'''
-
def getTreeDepth(myTree):
-
maxDepth=0
-
firstStr=list(myTree.keys())[0]
-
secondDict=myTree[firstStr]
-
for key in secondDict.keys():
-
if type(secondDict[key])==dict:
-
thisTreeDepth=1+getTreeDepth(secondDict[key])
-
else:
-
thisTreeDepth=1
-
if thisTreeDepth>maxDepth:
-
maxDepth=thisTreeDepth
-
return maxDepth
-
-
#在连接线的中间标注特征值
-
def plotMidText(cntrPt,parentPt,txtString):
-
xmid=(parentPt[0]-cntrPt[0])/2.0+cntrPt[0]
-
ymid=(parentPt[1]-cntrPt[1])/2.0+cntrPt[1]
-
createPlot.ax1.text(xmid,ymid,txtString)
-
-
#绘制节点以及箭头
-
def plotNode(nodeTxt,centerPt,parentPt,nodeType):
-
createPlot.ax1.annotate(nodeTxt,xy=parentPt,xycoords='axes fraction',
-
xytext=centerPt,textcoords='axes fraction',
-
va='center',ha='center',bbox=nodeType,
-
arrowprops=arrow_args)
-
-
'''''
-
-------------------------
-
储存决策树,使用pickle,序列化存储
-
-------------------------
-
'''
-
import pickle
-
def storeTree(inputTree,filename):
-
with open(filename,'wb') as fw:
-
pickle.dump(inputTree,fw)
-
-
def loadTree(filename):
-
with open(filename,'rb') as fr:
-
return pickle.load(fr)
-
-
if __name__=='__main__':
-
fr=open('lenses.txt')
-
lenses=[inst.strip().split('\t') for inst in fr.readlines()]
-
lensesLabels=['age','prescript','astigmatic','tearRate']
-
lensesTree=createTree(lenses,lensesLabels)
-
createPlot(lensesTree)
-
storeTree(lensesTree,'lensesTree-syt.txt')


 5760
5760

 被折叠的 条评论
为什么被折叠?
被折叠的 条评论
为什么被折叠?
 到【灌水乐园】发言


