


 本文介绍如何使用Python的numpy库中的meshgrid函数生成网格数据,并结合matplotlib库绘制3D散点图。通过实例展示了meshgrid函数的工作原理及其在三维图形绘制中的应用。
meshgrid的适用于生成网格型数据,可以接受两个一维数组生成两个二维矩阵,对应两个数组中所有的(x,y)对
例子
x = np.arange(1,4)
x
Out[13]: array([1, 2, 3])
y = np.arange(5,10)
x
Out[15]: array([1, 2, 3])
y
Out[16]: array([5, 6, 7, 8, 9])
z1, z2 = np.meshgrid(x, y)
z1
Out[21]:
array([[1, 2, 3],
       [1, 2, 3],
       [1, 2, 3],
       [1, 2, 3],
       [1, 2, 3]])
z2
Out[22]:
array([[5, 5, 5],
       [6, 6, 6],
       [7, 7, 7],
       [8, 8, 8],
       [9, 9, 9]])
z1.shape
Out[23]: (5, 3)
小结:meshgrid 后生成的二个数组的形状shape: (y.size, x.size),第一个数组每行都是x,第二个数组每列都是y
绘制3维图
import numpy as np
import matplotlib.pyplot as plt
from mpl_toolkits.mplot3d import Axes3D
# 绘制散点图
x1 = np.arange(-4, 4, 0.25)
x2 = np.arange(-4, 4, 0.25)
x, y = np.meshgrid(x1, x2)
r = np.sqrt(x ** 2 + y ** 2)
z = np.sin(r)
fig = plt.figure()
ax = Axes3D(fig)
ax.scatter(x, y, z)
# 添加坐标轴(顺序是x, y, z)
ax.set_xlabel('x', fontdict={'size': 10, 'color': 'red'})
ax.set_ylabel('y', fontdict={'size': 10, 'color': 'green'})
ax.set_zlabel('z', fontdict={'size': 10, 'color': 'blue'})
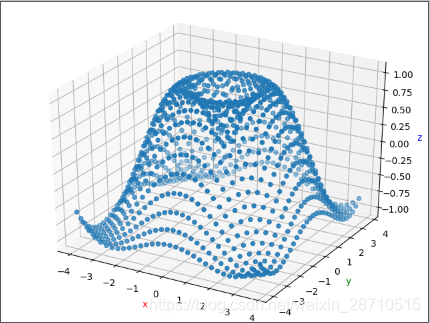
plt.show()
图像如下


 1396
1396

 被折叠的 条评论
为什么被折叠?
被折叠的 条评论
为什么被折叠?
 到【灌水乐园】发言


