


 本文档详细介绍了如何搭建Prometheus监控系统,包括Prometheus主程序、Alertmanager、Pushgateway以及各种Exporter的下载和配置。此外,还讲解了如何部署Grafana进行可视化监控,并提供了Linux、MySQL、Redis的监控模板。整个过程包括从下载软件到配置文件,再到启动服务和验证监控状态。最后,提到了MySQL和Redis的监控部署步骤。
prometheus:
Prometheus是一个开源的系统监控和报警的工具包,最初由SoundCloud发布。
组件介绍:
1Prometheus 主程序,主要是负责存储、抓取、聚合、查询方面。
2 Alertmanager 程序,主要是负责实现报警功能。3 Pushgateway 程序,主要是实现接收由Client push过来的指标数据,在指定的时间间隔,由主程序来抓取。4 *_exporter 这类是不同系统已经实现了的集成。
下载地址:
1 软件下在地址 https://github.com/prometheus/prometheus/releases/download/v2.17.1/prometheus-2.17.1.linux-amd64.tar.gz
2 报警插件下载地址 https://github.com/prometheus/alertmanager/releases/download/v0.20.0/alertmanager-0.20.0.linux-amd64.tar.gz
3 mysql监控客户端下载地址 https://github.com/prometheus/mysqld_exporter/releases/download/v0.12.1/mysqld_exporter-0.12.1.linux-amd64.tar.gz
4 Linux服务器客户端下载地址 https://github.com/prometheus/node_exporter/releases/download/v1.0.0-rc.0/node_exporter-1.0.0-rc.0.linux-amd64.tar.gz
5 模板下载地址 https://grafana.com/grafana/dashboards?dataSource=influxdb&orderBy=name&direction=asc
prometheus部署:
下载解压:
1 wget https://github.com/prometheus/prometheus/releases/download/v2.17.1/prometheus-2.17.1.linux-amd64.tar.gz
2 wgethttps://github.com/prometheus/node_exporter/releases/download/v1.0.0-rc.0/node_exporter-1.0.0-rc.0.linux-amd64.tar.gz
3 tar -xvzf prometheus-2.17.1.linux-amd64.tar.gz
4 tar -xvzf node_exporter-1.0.0-rc.0.linux-amd64.tar.gz
5 cd prometheus-2.17.1.linux-amd64
6 mkdir Linux Redis Mysql Mongodb
添加修改prometheus配置文件:
static_configs:
- targets: ['本机IP:9090']
- job_name: 'Linux'file_sd_configs:- files: ['/usr/local/src/prometheus-2.17.0.linux-amd64/Linux/Linux.yml']
refresh_interval: 5s- job_name: 'MysqlLinux'file_sd_configs:- files: ['/usr/local/src/prometheus-2.17.0.linux-amd64/Linux/MysqlLinux.yml']
refresh_interval: 5s- job_name: 'RedislLinux'file_sd_configs:- files: ['/usr/local/src/prometheus-2.17.0.linux-amd64/Linux/RedisLinux.yml']
refresh_interval: 5s- job_name: 'MongodbLinux'file_sd_configs:- files: ['/usr/local/src/prometheus-2.17.0.linux-amd64/Linux/MongodbLinux.yml']
refresh_interval: 5s- job_name: 'Mysql'file_sd_configs:- files: ['/usr/local/src/prometheus-2.17.0.linux-amd64/Mysql/Mysql.yml']
refresh_interval: 5s- job_name: 'Redis'file_sd_configs:- files: ['/usr/local/src/prometheus-2.17.0.linux-amd64/Redis/Redis.yml']
refresh_interval: 5s
编写子配置文件,每个监控客户端的端口都不同:
vim Linux/Linux.yml- targets: ['监控主机IP:9100']
labels:
name: Linux
启动prometheus
nohup ./prometheus --config.file=prometheus.yml &
启动node_exporter
nohup ./node_exporter >>/dev/null &
登录 http://prometheus:9090/targets 可以查看到监控主机是否正常
说明:
node_exporter 为prometheus 数据采集器,需要部署到要监控的服务器上面,部署好后,在prometheus 对应的子配置文件里添加服务对应的地址和端口
- targets: ['监控主机IP:9100']
labels:
name: Linux
grafana部署
官网下载地址 http://docs.grafana.org/installation/rpm/
#下载软件
wget https://dl.grafana.com/oss/release/grafana-6.7.1-1.x86_64.rpm
#现在软件依赖包
yum install initscripts fontconfig urw-fonts -y
#安装grafana软件
yum install grafana-6.7.1-1.x86_64.rpm -y
#启动服务
systemctl start grafana-server.service
grafana 默认启动3000端口 ,访问 http://IP:3000 默认账号、密码admin/admin
1.登录grafang系统

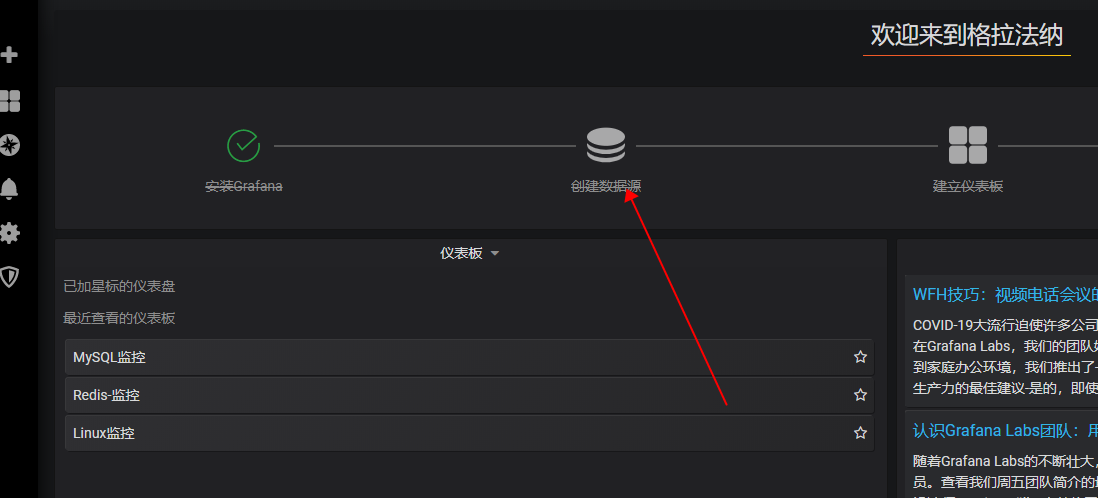
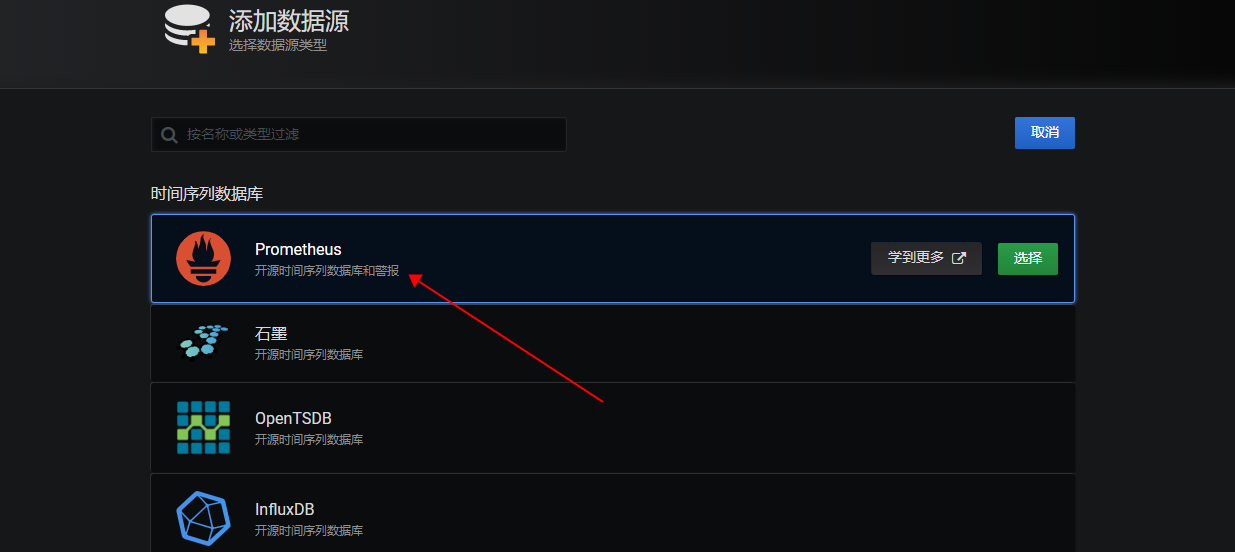
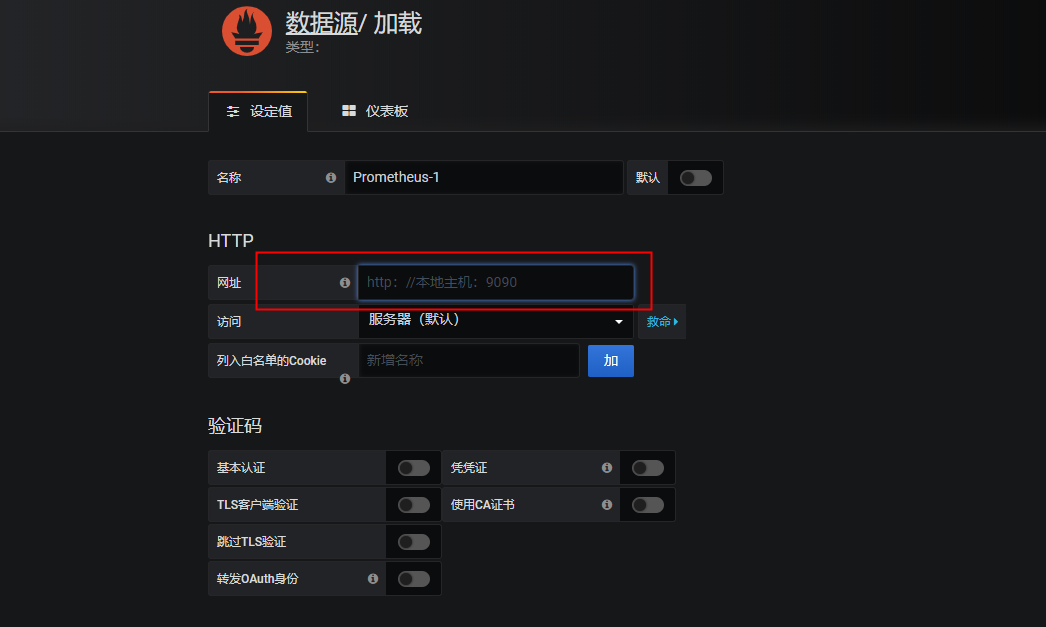
2.配置Prometheus 和 Grafana 连接 添加数据源
选择prometheus
填写prometheus对应IP地址和端口保存
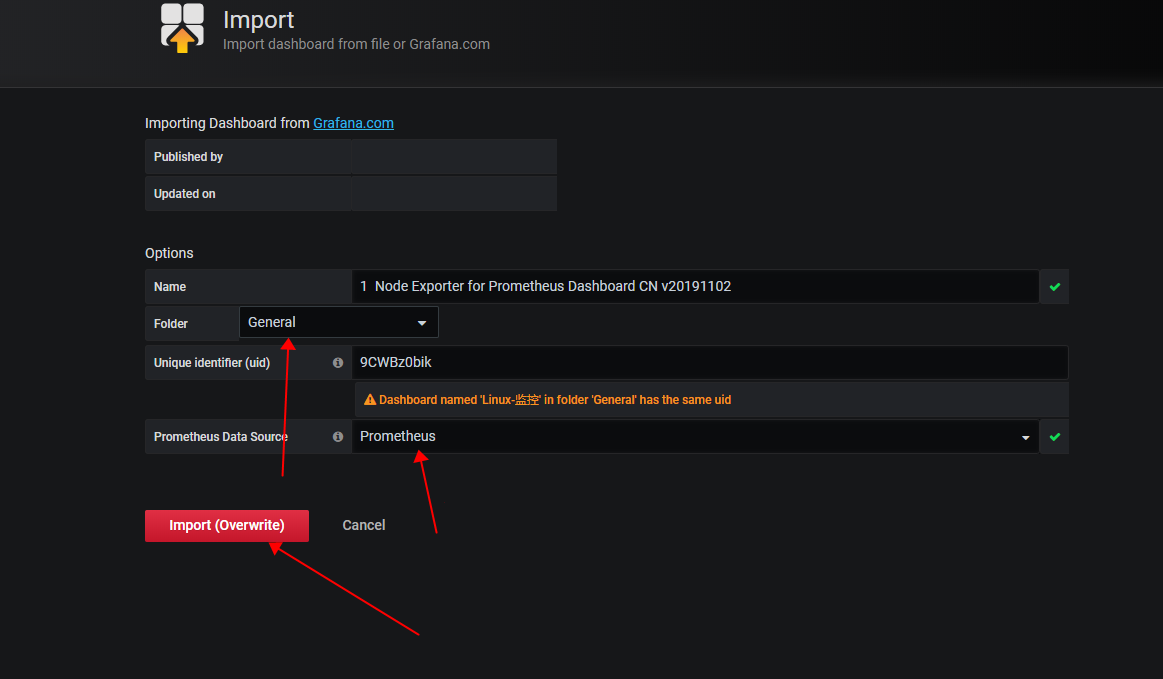
导入Linux监控模板
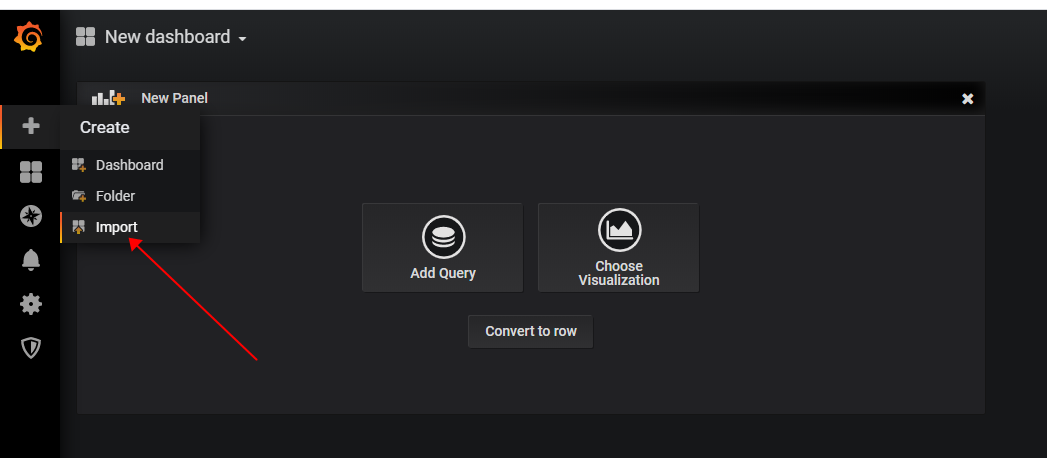
选择下载好的模板
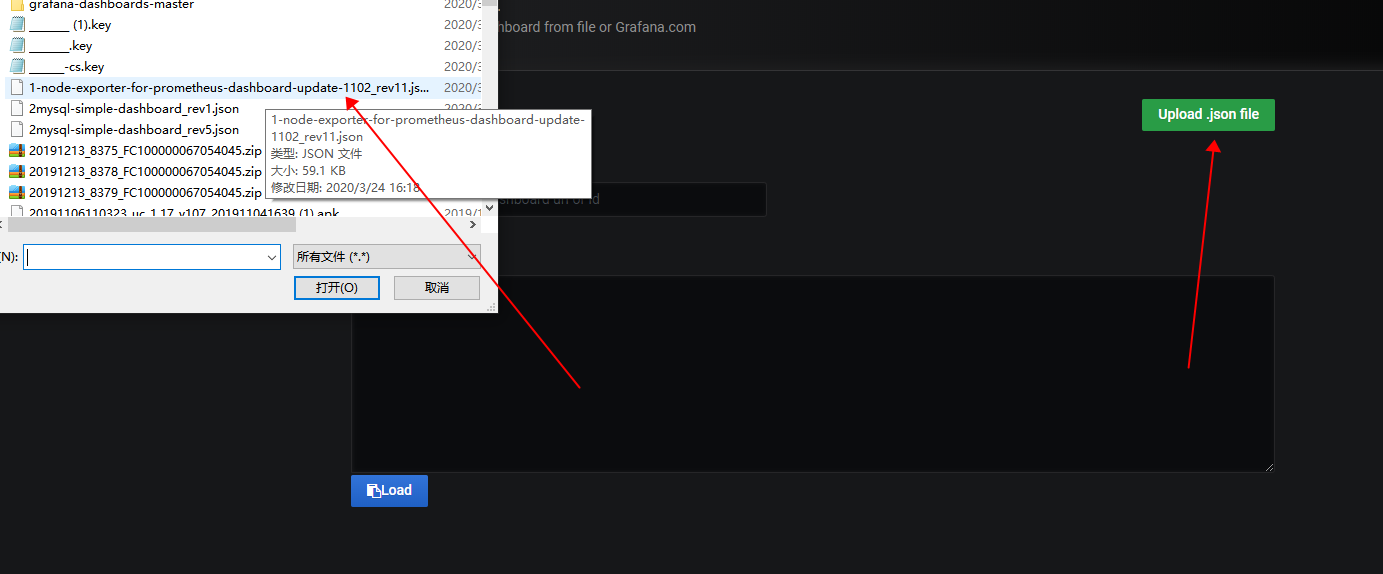
导入模板:
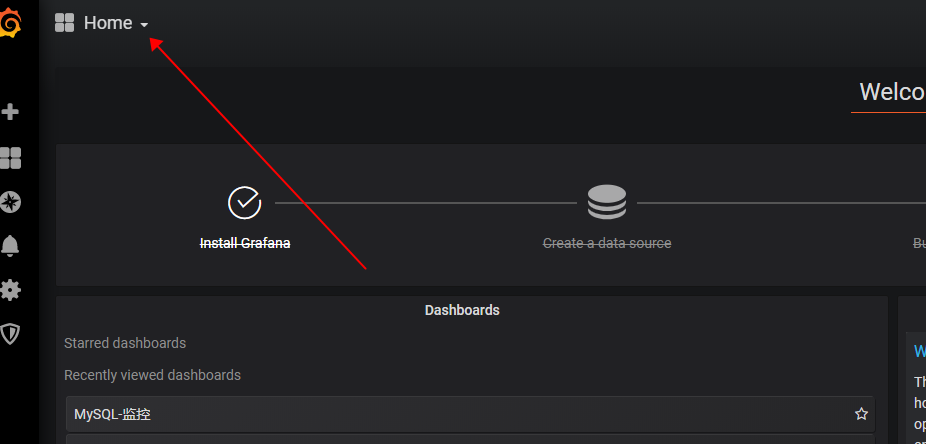
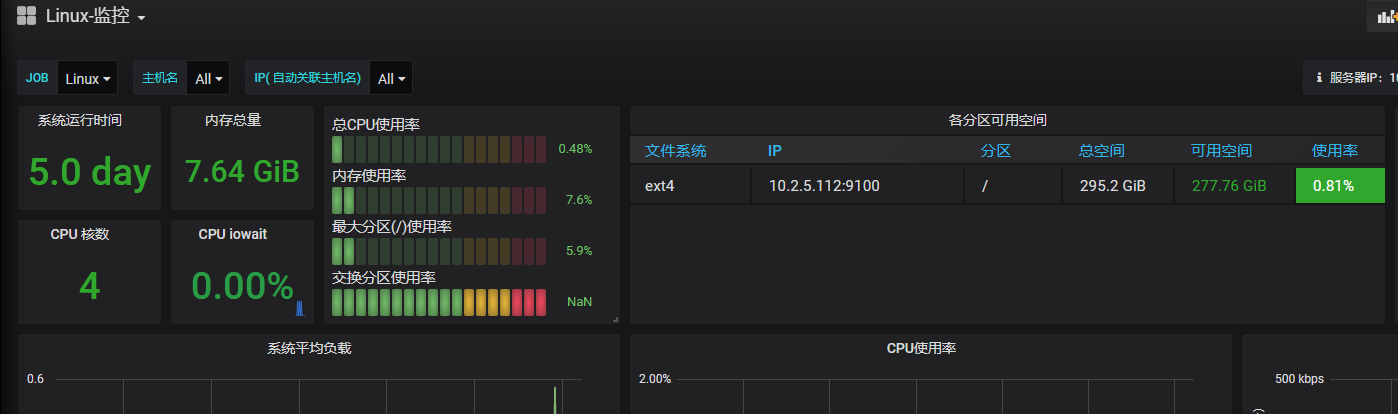
查看Linux监控:
mysql监控部署:
在需要监控的mysql上安装 node_exporter和 mysqld_exporter
tar -xvf node_exporter-0.14.0.linux-amd64.tar.gz
cd node_exporter-0.14.0.linux-amd64
nohup ./node_exporter &tar-xvf mysqld_exporter-0.10.0.linux-amd64.tar.gz
cd mysqld_exporter-0.10.0.linux-amd64
vi .my.cnf
[client]
user=root
password=rootnohup./mysqld_exporter -config.my-cnf=".my.cnf" &
添加服务器配置:
1 vim Linux/MysqlLinux.yml2 - targets: ['监控主机IP:9100']3 labels:4 name: Linux
1 vim Mysql/Mysql.yml2 - targets: ['mysqIP:9104']3 labels:4 name: Mysql
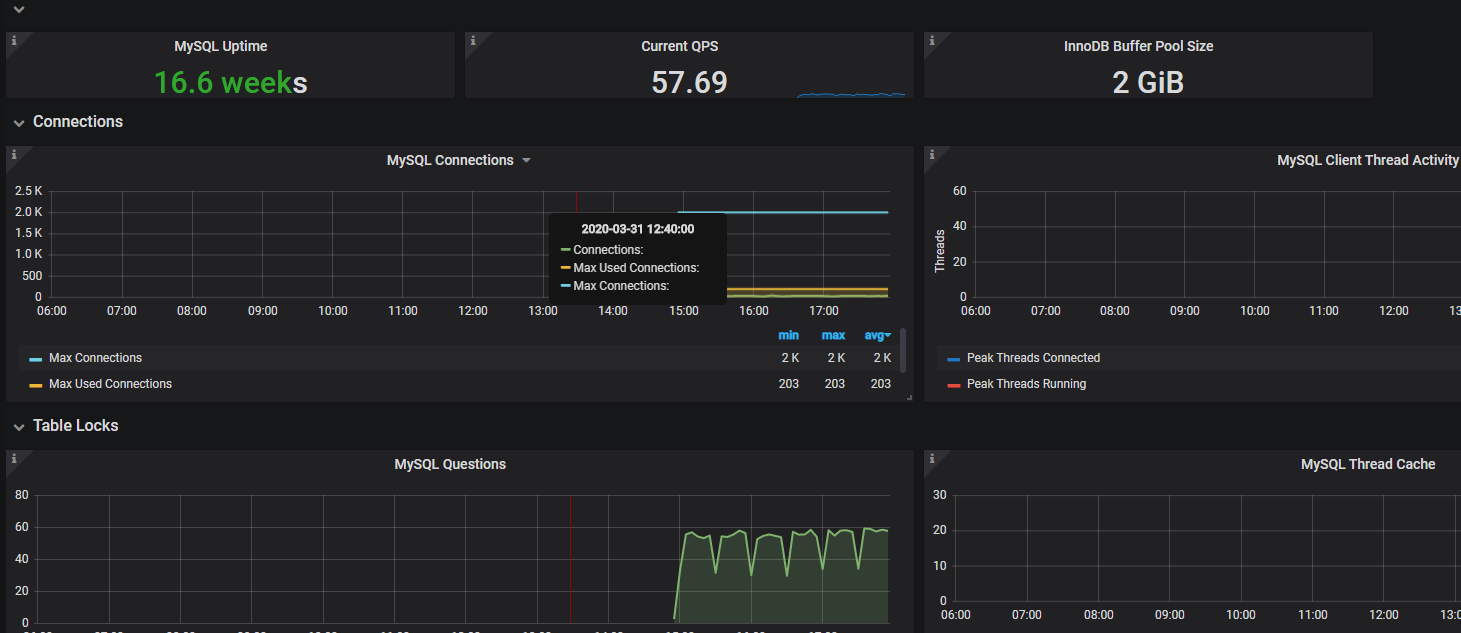
导入对应的mysql模板
redis监控部署:
在需要监控的mysql上安装 node_exporter和 redis_exporter
1 tar -xvf redis_exporter-v0.11.linux-amd64.tar.gz2 nohup /opt/redis_exporter -redis.addr redis://IP地址:16379 -redis.password 密码 &
添加服务器配置:
vim Linux/RedisLinux.yml- targets: ['监控主机IP:9100']
labels:
name: Linux
vim Redis/Redis.yml- targets: ['RedisIP:端口']
labels:
name: Redis
mongodb监控部署:
更新中.....................


 被折叠的 条评论
为什么被折叠?
被折叠的 条评论
为什么被折叠?
 到【灌水乐园】发言


