大家好!
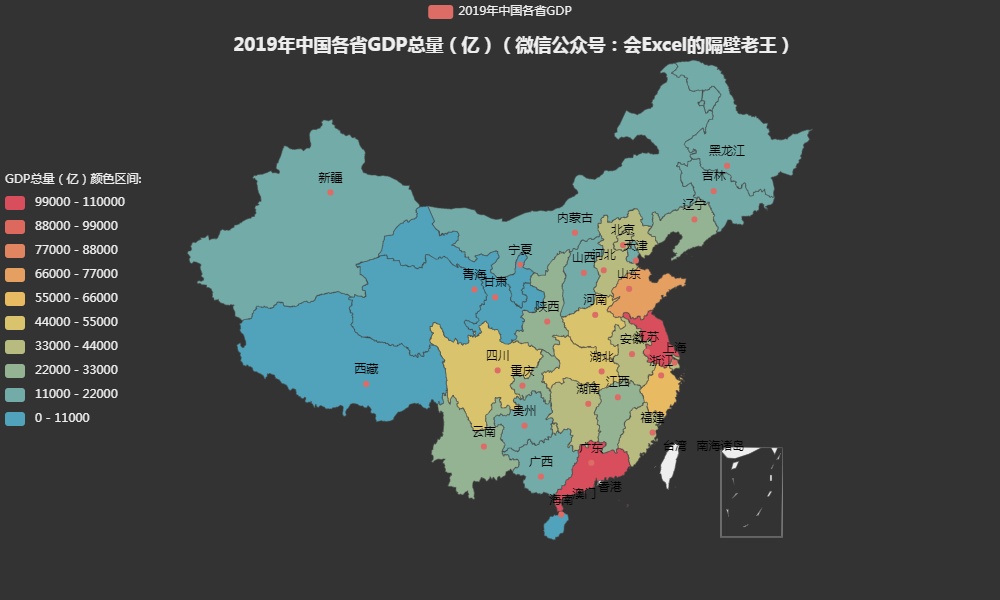
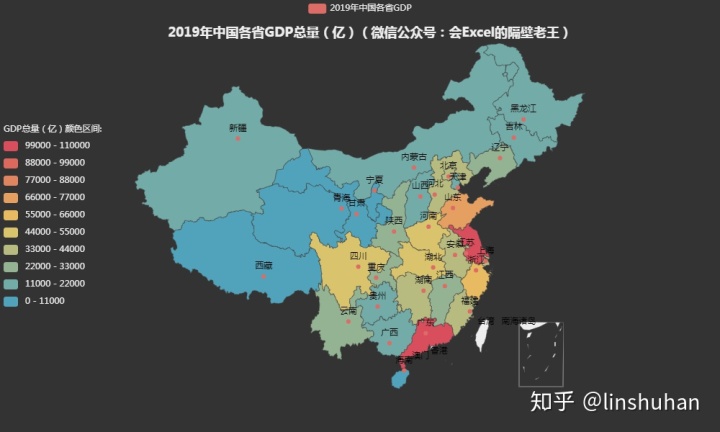
今天来分享一下如何用Python工具来帮助我们制作一张展示2019年中国各省GDP的可视化地图。

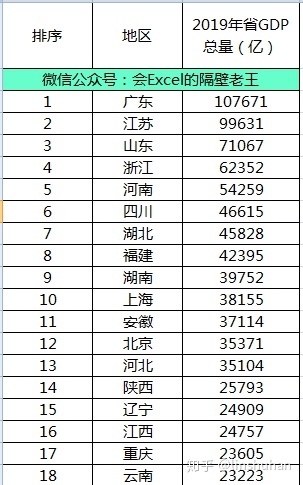
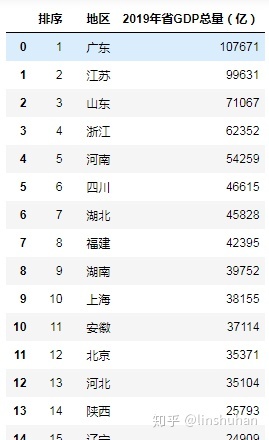
案例中数据表格结构如下:

代码及演示:
import numpy as np
import pandas as pd
from pyecharts.globals import ThemeType
from pyecharts import options as opts
from pyecharts.charts import Map

df_map = pd.read_excel("D:01会Excel的隔壁老王Excel报表20200506-Python地图可视化:2019年中国各省GDP情况Python地图可视化:2019年中国各省GDP情况.xlsx")

df_map
c = (
    Map(init_opts=opts.InitOpts(width="1000px", height="600px",theme = ThemeType.DARK))
    .add("2019年中国各省GDP", df_map[["地区","2019年省GDP总量(亿)"]].values.tolist(), "china")
    .set_global_opts(
        title_opts=opts.TitleOpts(title="2019年中国各省GDP总量(亿)(微信公众号:会Excel的隔壁老王)",pos_bottom = "90%", pos_right = "20%"),
        visualmap_opts=opts.VisualMapOpts(type_= "color",max_=110000, range_text = ['GDP总量(亿)颜色区间:', ''],is_piecewise=1,pos_top= "middle",pos_left="left",orient="vertical",split_number=10),
        #tooltip_opts = opts.TooltipOpts(formatter="{c} %")
    )
    #.render("map_visualmap_piecewise.html")
)

c.render_notebook()
完整python代码参考:
import numpy as np
import pandas as pd
from pyecharts.globals import ThemeType
from pyecharts import options as opts
from pyecharts.charts import Map

df_map = pd.read_excel("D:01会Excel的隔壁老王Excel报表20200506-Python地图可视化:2019年中国各省GDP情况Python地图可视化:2019年中国各省GDP情况.xlsx")

c = (
    Map(init_opts=opts.InitOpts(width="1000px", height="600px",theme = ThemeType.DARK))
    .add("2019年中国各省GDP", df_map[["地区","2019年省GDP总量(亿)"]].values.tolist(), "china")
    .set_global_opts(
        title_opts=opts.TitleOpts(title="2019年中国各省GDP总量(亿)(微信公众号:会Excel的隔壁老王)",pos_bottom = "90%", pos_right = "20%"),
        visualmap_opts=opts.VisualMapOpts(type_= "color",max_=110000, range_text = ['GDP总量(亿)颜色区间:', ''],is_piecewise=1,pos_top= "middle",pos_left="left",orient="vertical",split_number=10),
        #tooltip_opts = opts.TooltipOpts(formatter="{c} %")
    )
    #.render("map_visualmap_piecewise.html")
)

c.render_notebook()


 被折叠的 条评论
为什么被折叠?


