


 TUTU网站现提供Lefse(LDA Effect Size)分析工具,包括LDA值柱状图、物种分类分支图等。用户可免费使用,需注意文件格式和内容要求,确保数据正确上传。完成分析后,结果以PDF格式提供,支持进一步编辑。
前言
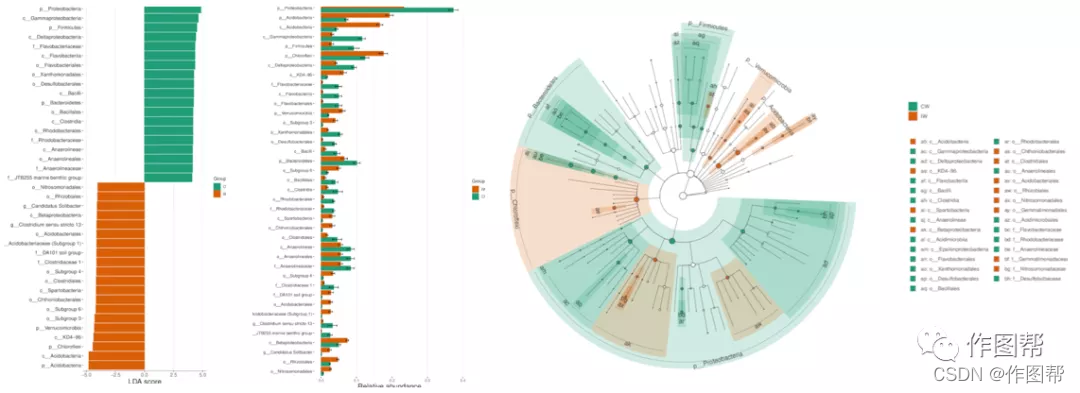
今天小编给大家介绍的是TUTU(https://www.cloudtutu.com/)网站上新添的Lefse分析,即LDA Effect Size分析。咱之前有上过这个分析(lefse),但是只能画出LDA值柱状图,今天新添的工具lefse2基本可以实现完整的分析内容,包括LDA值柱状图、物种分类分支图、组间丰度柱状图等等。
Lefse分析文献应用举例:
Fig. 7 The main taxa of bacteria that were different in HMG vs. SMG vs. FMG. a: Cladogram of the main taxa of mi-crobiota that were different on the basis of LEfSe analysis. b: LEfSe analysis (taxa with LDA score > 4). (The different dietary sugars modulate the composition of the gut microbiota in honeybee during overwintering)
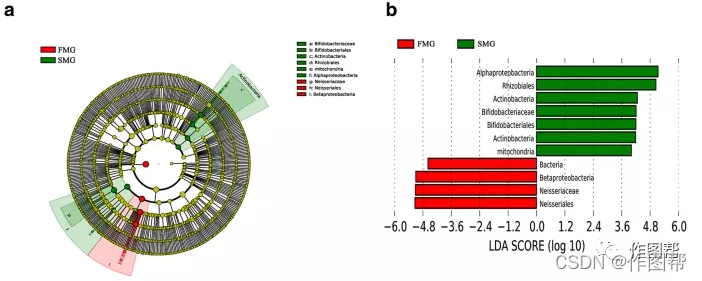
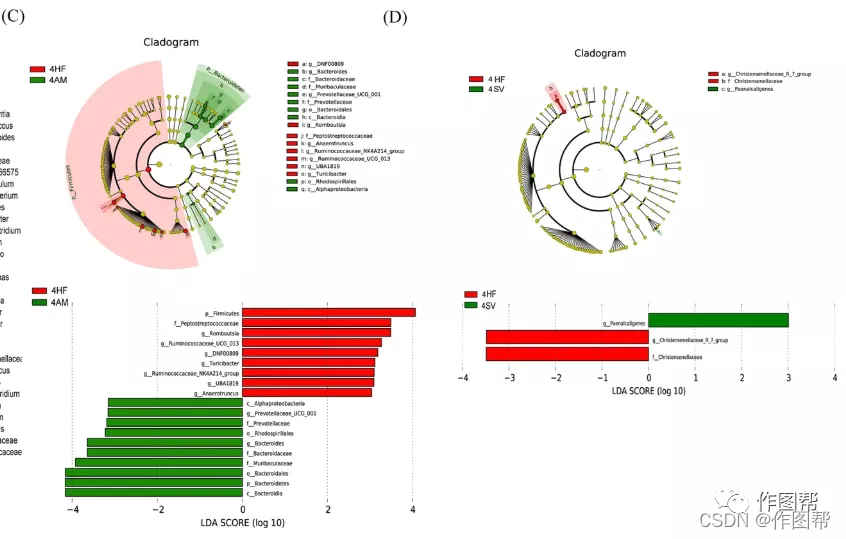
Fig.2 The linear discriminant analysis (LDA) effect size (LEfSe) was used to identify the biomarkers with significant differences between the two groups: c 4HF vs 4 AM and d 4HF vs 4SV. Values are presented as mean ± SEM. *P < 0.05; **P < 0.01; ***P < 0.001; ns P > 0.05(The polyphenol-rich extract from chokeberry (Aronia melanocarpa L.) modulates gut microbiota and improves lipid metabolism in diet-induced obese rats)
注意事项
以下是关于网站使用的一些注意事项:
1.绘图免费:网站绘图是免费的,免费的,免费的,重要的话说三遍。网址是:https://www.cloudtutu.com/,一般用谷歌或者火狐浏览器登录,输入验证码即可登录成功并使用,遇到网络不好的情况,也可以换下其他浏览器。
2.工具查找:在“微生物分析”一栏,所有的工具都在里面,没有找到相应工具的小伙伴可能需要耐心往下翻翻,一般新上的工具会排在前面。
3.使用说明:有用户反映上传数据上传不上去,这种情况一般是因为文件格式或者内容里有不识别的字符,与示例数据形式相左或者文件数据量太大了,需要时间上传。每个工具右侧有“帮助文档”一栏,使用较多的部分工具也新增了“常见问题”,小伙伴使用时需按照这两个说明进行操作,不然可能会出现上传不成功甚至画不出来的情况。很多用户以为画图画不出来是因为收费问题,小编已哭晕在厕所…
4.问题反馈:如果有画图的问题解决不了,或者有一些画图需求,改进建议等等,可以联系“小图”,小图的二维码贴在页面右侧,一眼就可以看到。
5.其他:TUTU网站上的绘图工具可以处理一般数据量的文件,但是如果数据太大,有些工具是画不出来的…毕竟资源有限,还请各位客官见谅.
使用说明
1 TUTU网站登录
①登录网址:www.cloudtutu.com(推荐使用360或者谷歌浏览器)
②输入用户名和密码(小编已经为大家填好了,如果不显示可添加文末二维码添加小编获取),输入验证码后即可登录;
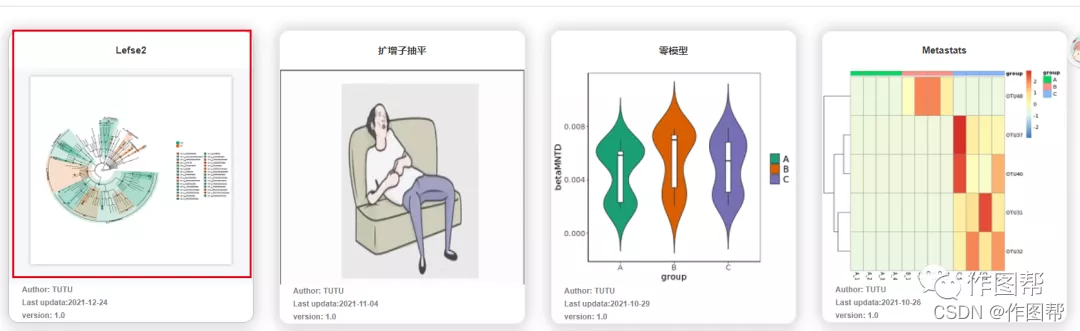
③登录后在“微生物分析”那一栏找到lefse2,点击进入;
④请按照界面右侧的说明书或者下文进行操作。
2 上传文件
※※※目前平台仅支持.txt(制表符分隔)文本文件或者.csv文件的文件上传,最好传txt文本文件!
※※※请您务必按照示例数据的格式调整数据!上传文件中不可带有:中文、中文字符、空格、重复名称等!!!
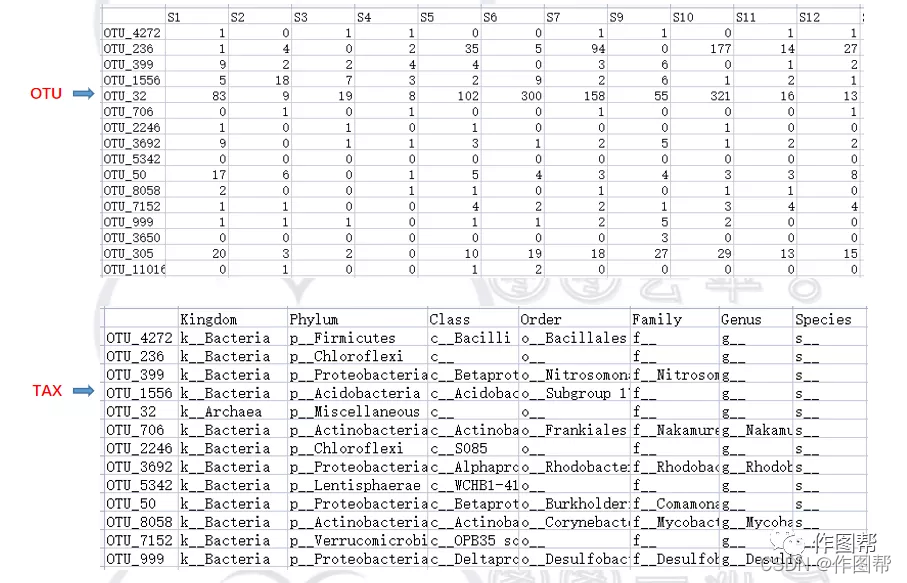
a)准备2个数据文件(形式参照示例数据,如微生物物种丰度表、基因表达量矩阵等等);
b)文件1:OTU表,表格需要带表头和列名,每一列为样本名,每一行为各种指标数据名,例如OTU等;文件2:TAX表:表格需要带表头和列名,文件1中otu对应的分类水平;
c)请提交txt(制表符分隔)文本文件或者.csv文件。操作方法为:全选excel中的所有内容(ctrl+A),复制到记事本中,将记事本文件另存后点击“上传”按钮上传该文件。
3 参数设置
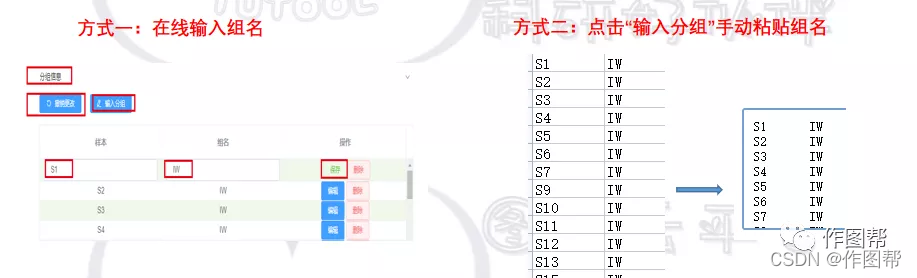
3.1 在界面右侧编辑分组信息:需要对所有样品进行分组,本网站支持在线修改分组名称的功能。有在线输入(方式一)和手动粘贴(方式二)两种方式。(绘图前必须检查分组名称)
3.2 选择比较组:按需自行选择
3.3 LDA:LDA阈值选择,默认为4
4 下载文件
点击“运行”开始作图,点击“下载”保存结果文件(表格内容可先复制到记事本中查看)。PDF格式的文件可通过矢量图编辑工具进行编辑。
5 作图后处理
TUTU云平台提供的是PDF格式的矢量图,可通过矢量图处理软件进行编辑和调整(如:文字字体,文字大小,图片分辨率等)。图形处理软件可扫描文后的二维码添加小编获取。
6 写作建议
XXXX was performed on Tutools platform (https://www.cloudtutu.com), a free online data analysis website.
尊敬的用户,如果图图云平台在您的科研中有幸提供了些许帮助,我们期望您能在方法学或者致谢中提及我们,引用方法如下:XXXX analysis was performed on Tutools platform (https://www.cloudtutu.com/#/index), a free online data analysis website. 目前平台还处于测试阶段,使用过程中有任何疑问或者报错欢迎随时联系小编反馈。您的反馈和建议是我们最大的动力。


 5984
5984

 被折叠的 条评论
为什么被折叠?
被折叠的 条评论
为什么被折叠?
 到【灌水乐园】发言


