# coding: utf-8
# https://blog.youkuaiyun.com/zhangf666/article/details/70183788
# https://blog.youkuaiyun.com/bryan__/article/details/51769118
from sklearn.model_selection import train_test_split
from pandas import DataFrame
from sklearn import metrics
from sklearn.datasets import make_hastie_10_2
from xgboost.sklearn import XGBClassifier
import xgboost as xgb
# (1). get datasets
X, y = make_hastie_10_2(random_state=0)
X = DataFrame(X)
y = DataFrame(y)
y.columns={"label"}
label={-1:0,1:1}
y.label=y.label.map(label)
X_train, X_test, y_train, y_test = train_test_split(X, y, test_size=0.2, random_state=0)#划分数据集
y_train.head()
#(2).XGBoost两种接口定义
# XGBoost自带接口
params={
'eta': 0.3,
'max_depth':3,
'min_child_weight':1,
'gamma':0.3,
'subsample':0.8,
'colsample_bytree':0.8,
'booster':'gbtree',
'objective': 'binary:logistic',
'nthread':12,
'scale_pos_weight': 1,
'lambda':1,
'seed':27,
'silent':0 ,
'eval_metric': 'auc'
}
d_train = xgb.DMatrix(X_train, label=y_train)
d_valid = xgb.DMatrix(X_test, label=y_test)
d_test = xgb.DMatrix(X_test)
watchlist = [(d_train, 'train'), (d_valid, 'valid')]
# sklearn接口
clf = XGBClassifier(
n_estimators=30,#三十棵树
learning_rate =0.3,
max_depth=3,
min_child_weight=1,
gamma=0.3,
subsample=0.8,
colsample_bytree=0.8,
objective= 'binary:logistic',
nthread=12,
scale_pos_weight=1,
reg_lambda=1,
seed=27)
model_bst = xgb.train(params, d_train, 30, watchlist, early_stopping_rounds=500, verbose_eval=10)
model_sklearn=clf.fit(X_train, y_train)
y_bst= model_bst.predict(d_test)
y_sklearn= clf.predict_proba(X_test)[:,1]
print("XGBoost_自带接口 AUC Score : %f" % metrics.roc_auc_score(y_test, y_bst))
print("XGBoost_sklearn接口 AUC Score : %f" % metrics.roc_auc_score(y_test, y_sklearn))
# (3).生成两组新特征
print("原始train大小:",X_train.shape)
print("原始test大小:",X_test.shape)
# XGBoost自带接口生成的新特征
train_new_feature= model_bst.predict(d_train, pred_leaf=True)
test_new_feature= model_bst.predict(d_test, pred_leaf=True)
train_new_feature1 = DataFrame(train_new_feature)
test_new_feature1 = DataFrame(test_new_feature)
print("新的特征集(自带接口):",train_new_feature1.shape)
print("新的测试集(自带接口):",test_new_feature1.shape)
# sklearn接口生成的新特征
train_new_feature= clf.apply(X_train)#每个样本在每颗树叶子节点的索引值
test_new_feature= clf.apply(X_test)
train_new_feature2 = DataFrame(train_new_feature)
test_new_feature2 = DataFrame(test_new_feature)
print("新的特征集(sklearn接口):",train_new_feature2.shape)
print("新的测试集(sklearn接口):",test_new_feature2.shape)
train_new_feature1.head()
train_new_feature2.head()
# (4).基于新特征训练、预测
#用两组新的特征分别训练,预测
#用 sklearn 接口生成的新特征训练
new_feature1=clf.fit(train_new_feature1, y_train)
y_new_feature1= clf.predict_proba(test_new_feature1)[:,1]
#用 sklearn 接口生成的新特征训练
new_feature2=clf.fit(train_new_feature2, y_train)
y_new_feature2= clf.predict_proba(test_new_feature2)[:,1]
print("sklearn 接口生成的新特征预测结果 AUC Score : %f" % metrics.roc_auc_score(y_test, y_new_feature1))
print("sklearn 接口生成的新特征预测结果 AUC Score : %f" % metrics.roc_auc_score(y_test, y_new_feature2))
# (5).Plotting API画图
from xgboost import plot_tree
from xgboost import plot_importance
import matplotlib.pyplot as plt
from graphviz import Digraph
import pydot
#model_bst = xgb.train(params, d_train, 30, watchlist, early_stopping_rounds=500, verbose_eval=10)
#model_sklearn=clf.fit(X_train, y_train)
#model_bst
xgb.plot_tree(model_bst, num_trees=0) # xgb.to_graphviz(model_bst, num_trees=0)
plot_importance(model_bst)
plt.show()
#model_sklearn:
plot_tree(model_sklearn)
plot_importance(model_sklearn)
plt.show()
'''
画图时出现关于 GraphViz 错误,windows system
0. Install python graphviz package: pip install graphviz
1. Download and install graphviz-2.38.msi https://graphviz.gitlab.io/_pages/Download/Download_windows.html
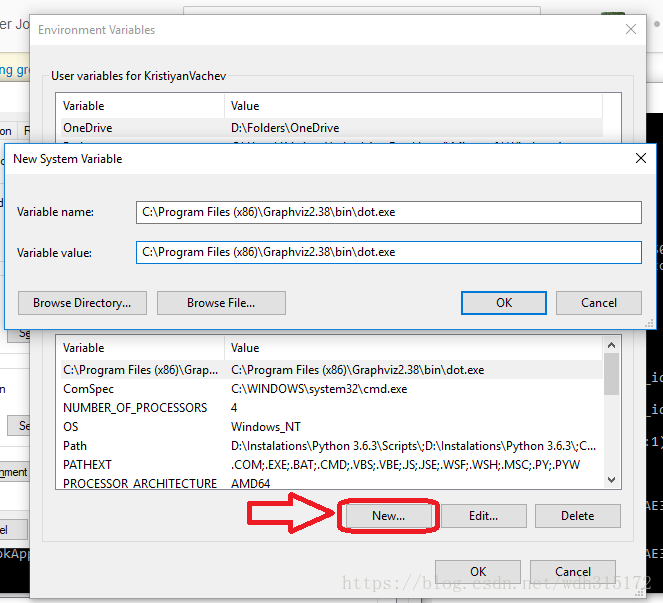
2. Set the path variable
Control Panel > System and Security > System > Advanced System Settings > Environment Variables > Path > Edit add 'C:\Program Files (x86)\Graphviz2.38\bin'
Add C:\Program Files (x86)\Graphviz2.38\bin to User path
Add C:\Program Files (x86)\Graphviz2.38\bin\dot.exe to System Path
3. Restart your currently running application that requires the path
参考:
https://stackoverflow.com/questions/18438997/why-is-pydot-unable-to-find-graphvizs-executables-in-windows-8
https://stackoverflow.com/questions/35064304/runtimeerror-make-sure-the-graphviz-executables-are-on-your-systems-path-aft
'''


 本文介绍如何使用XGBoost进行二分类任务,包括两种接口的使用方法、新特征生成及利用这些特征进行训练预测的过程,并展示了如何绘制决策树及特征重要性。


 4797
4797

 被折叠的 条评论
为什么被折叠?
被折叠的 条评论
为什么被折叠?
 到【灌水乐园】发言


