


1 创建用户
adduser --system --home /home/prometheus --shell /bin/bash prometheus
mkdir -p /home/prometheus
chown -R prometheus:prometheus prometheus
2 安装
# 安装prometheus
wget https://github.com/prometheus/prometheus/releases/download/v2.45.5/prometheus-2.45.5.linux-amd64.tar.gz
tar -xvf prometheus-2.45.5.linux-amd64.tar.gz
ln -s prometheus-2.45.5.linux-amd64 prometheus

# 设置启动
[root@es4 data]# cat /usr/lib/systemd/system/prometheus.service
[Unit]
Description=Prometheus Server
Documentation=https://prometheus.io
After=network.target

[Service]
User=prometheus
Group=prometheus
Type=simple
ExecStart=/home/prometheus/prometheus/prometheus \
--config.file=/home/prometheus/prometheus/prometheus.yml \
--storage.tsdb.path=/home/prometheus/prometheus/data/ \
--storage.tsdb.retention=30d \
--web.enable-lifecycle

ExecReload=/bin/kill -HUP $MAINPID
Restart=on-failure

[Install]
WantedBy=multi-user.target

systemctl daemon-reload
systemctl start prometheus


# 安装grafana
yum install -y https://dl.grafana.com/oss/release/grafana-11.0.0-1.x86_64.rpm
firewall-cmd --zone=public --add-port=3000/tcp --permanent
firewall-cmd --reload
systemctl enable --now grafana-server
systemctl status grafana-server

# 安装alertmanager
tar -xvf alertmanager-0.27.0.linux-amd64.tar.gz
ln -s alertmanager-0.27.0.linux-amd64 alertmanager
mkdir -p /home/prometheus/alertmanager/data
[prometheus@es4 data]$ cat /usr/lib/systemd/system/alertmanager.service
[Unit]
Description=alertmanager System
Documentation=https://prometheus.io
After=network.target


[Service]
User=prometheus
Group=prometheus
ExecStart=/home/prometheus/alertmanager/alertmanager \
--config.file=/home/prometheus/alertmanager/alertmanager.yml \
--storage.path=/home/prometheus/alertmanager/data
ExecReload=/bin/kill -HUP $MAINPID
Restart=on-failure


[Install]
WantedBy=multi-user.target

systemctl daemon-reload
systemctl start alertmanager
systemctl enable alertmanager
3 grafana
3.1 配置
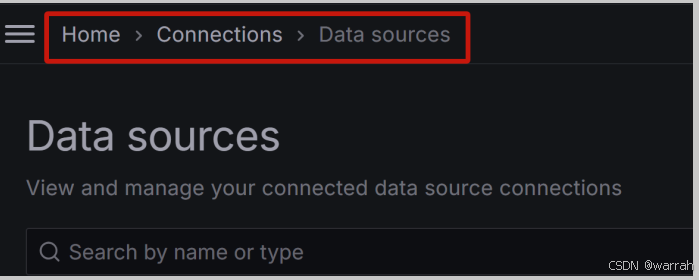
(1)进入“Data sources”页面,路径:HOME —> Connections —> Data sources
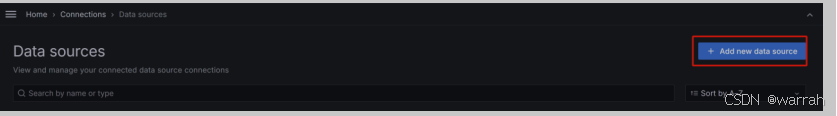
(2)点击“Add new data source”按钮。
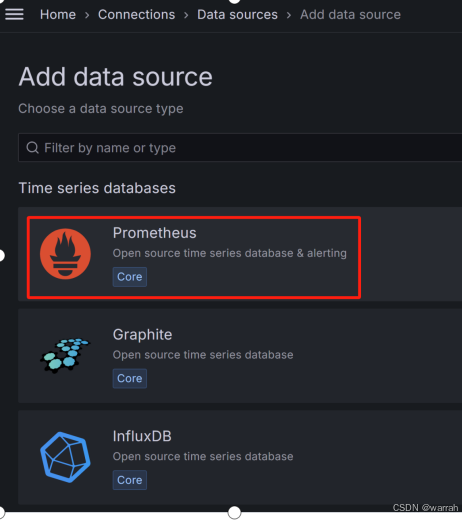
(3)选择Prometheus作为数据源。
(4)填写Prometheus地址。
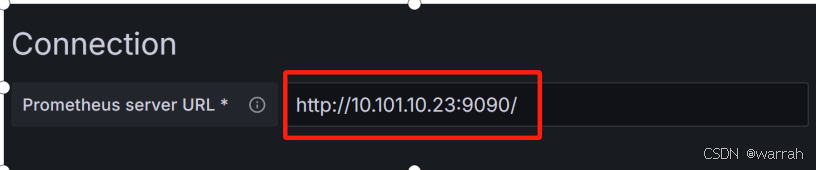
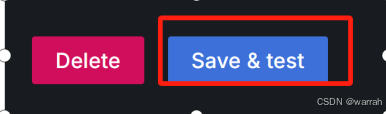
(5)点击“Save & test”按钮。
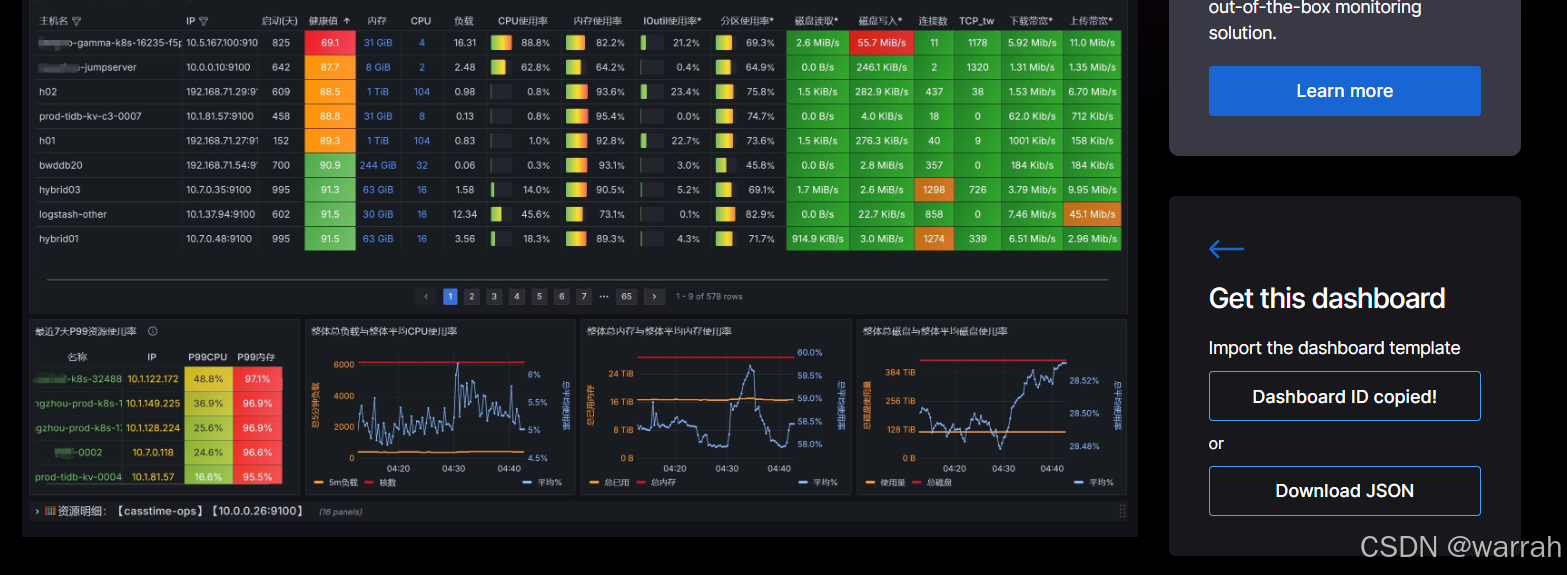
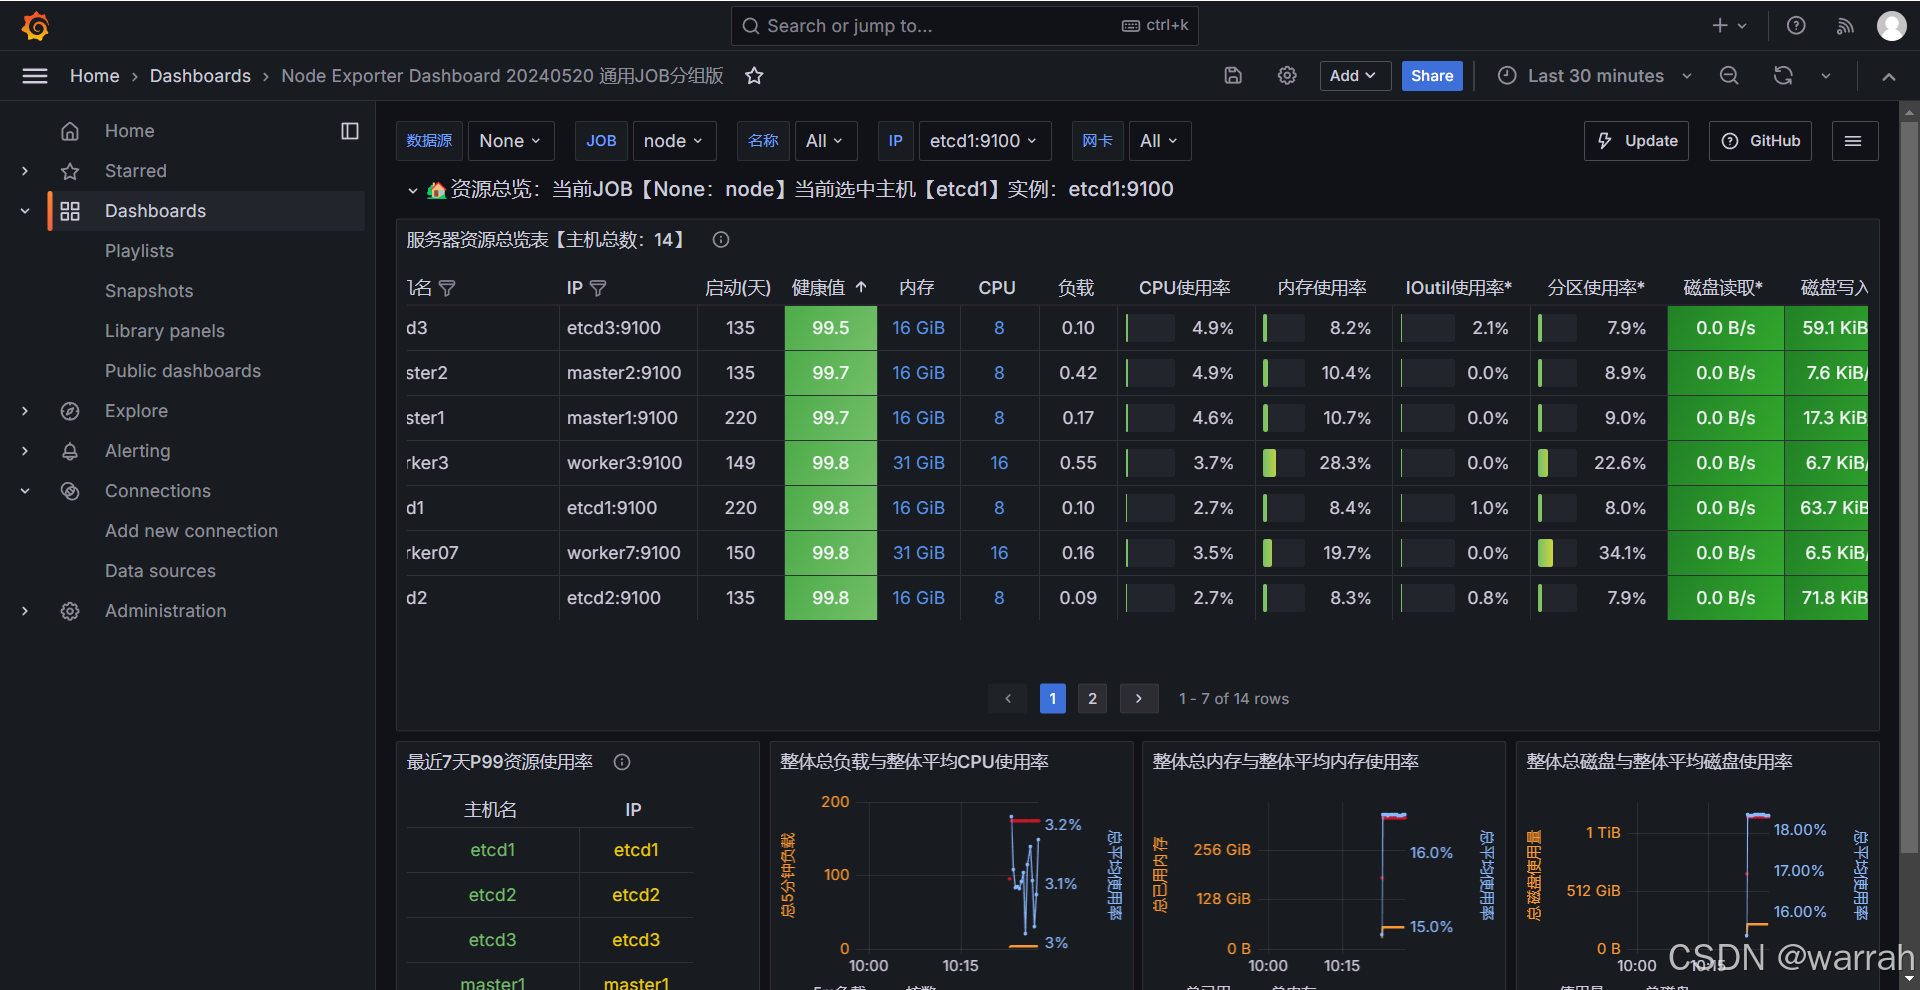
(6) 下载看板文件
Node Exporter Dashboard 20240520 通用JOB分组版,点击download json
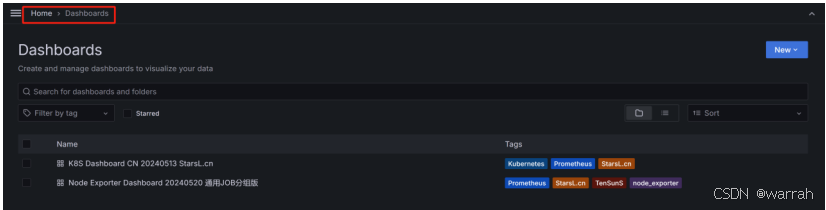
(7)进入dashboard,路径:HOME —> Dashboards
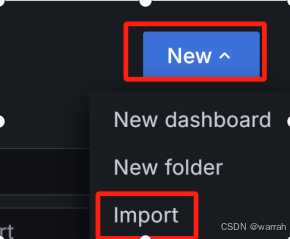
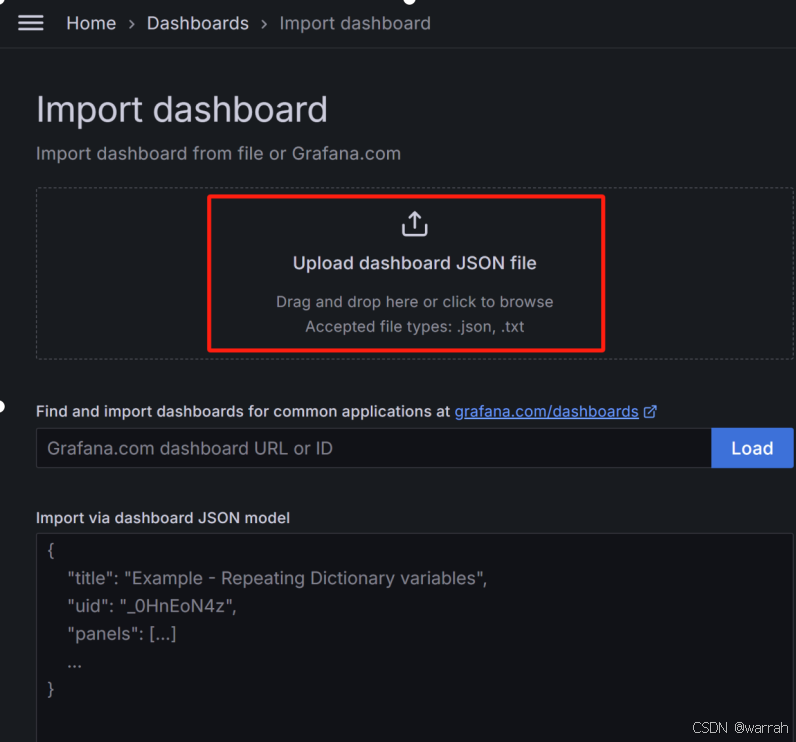
(8)打开“看板导入”页面
在Dashboards页面,点击“New —> Import”按钮。
(9)导入看板
在“Import dashboard”页面,导入看板文件。
3.2 使用
3.2.1 prometheus.yml
# my global config
global:
  scrape_interval: 15s # Set the scrape interval to every 15 seconds. Default is every 1 minute.
  evaluation_interval: 15s # Evaluate rules every 15 seconds. The default is every 1 minute.
  # scrape_timeout is set to the global default (10s).

# Alertmanager configuration
alerting:
  alertmanagers:
    - static_configs:
        - targets: ["10.101.10.4:9093"]


# Load rules once and periodically evaluate them according to the global 'evaluation_interval'.
rule_files:
  - /home/prometheus/prometheus/rules/*.rules
  # - "first_rules.yml"
  # - "second_rules.yml"

# A scrape configuration containing exactly one endpoint to scrape:
# Here it's Prometheus itself.
scrape_configs:
  # The job name is added as a label `job=<job_name>` to any timeseries scraped from this config.
  - job_name: "prometheus"

    # metrics_path defaults to '/metrics'
    # scheme defaults to 'http'.

    static_configs:
      - targets: ["10.101.10.4:9090"]


  - job_name: "node"
    static_configs:
      - targets: ["worker1:9100","worker2:9100","worker3:9100","worker4:9100","worker5:9100","worker6:9100","worker7:9100","worker8:9100","worker9:9100","etcd1:9100","etcd2:9100","etcd3:9100","master1:9100","master2:9100","master3:9100"]


#配置接入kube-state-metrics
  - job_name: "kube-state-metrics"
    static_configs:
    - targets: ["10.101.10.83:30866"]

#配置接入cadvisor

  - job_name: "k8s-cadvisor"
    honor_timestamps: true
    metrics_path: /metrics
    scheme: https
    kubernetes_sd_configs:
    - api_server: https://10.101.10.84:6443  #k8s-master的api地址,这个地址可以在master节点的/root/.kube/config文件中的server字段找到
      role: node #角色有5中node/service/ingress/pod/Endpoints,这里使用node
      bearer_token_file: /home/prometheus/prometheus/k8s.token #上一步得到的k8s的api-token文件
      tls_config:
        insecure_skip_verify: true
    bearer_token_file: /home/prometheus/prometheus/k8s.token
    tls_config:
      insecure_skip_verify: true
    relabel_configs:
    - action: labelmap
      regex: __meta_kubernetes_node_label_(.+)
    - separator: ;
      regex: (.*)
      target_label: __address__
      replacement: 10.101.10.84:6443
      action: replace
    - source_labels: [__meta_kubernetes_node_name]
      separator: ;
      regex: (.+)
      target_label: __metrics_path__
      replacement: /api/v1/nodes/${1}/proxy/metrics/cadvisor
      action: replace
可以看到监控信息
 3.2.2 hoststats-alert.rules
[root@es4 rules]# cat hoststats-alert.rules
groups:
   - name: hostStatsAlert
     rules:
     - alert: hostCpuUsageAlert
       expr: sum(avg without (cpu)(irate(node_cpu_seconds_total{mode!='idle'}[5m]))) by (instance) * 100 > 80
       for: 1m
       labels:
         severity: page
       annotations:
         summary: "Instance {{ $labels.instance }} CPU usgae high"
         description: "{{ $labels.instance }} CPU usage above 80% (current value: {{ $value }})"
     - alert: hostMemUsageAlert
       expr: 100 - ( node_memory_MemAvailable_bytes / node_memory_MemTotal_bytes ) * 100 > 80
       for: 1m
       labels:
         severity: page
       annotations:
         summary: "Instance {{ $labels.instance }} MEM usgae high"
         description: "{{ $labels.instance }} MEM usage above 80% (current value: {{ $value }})"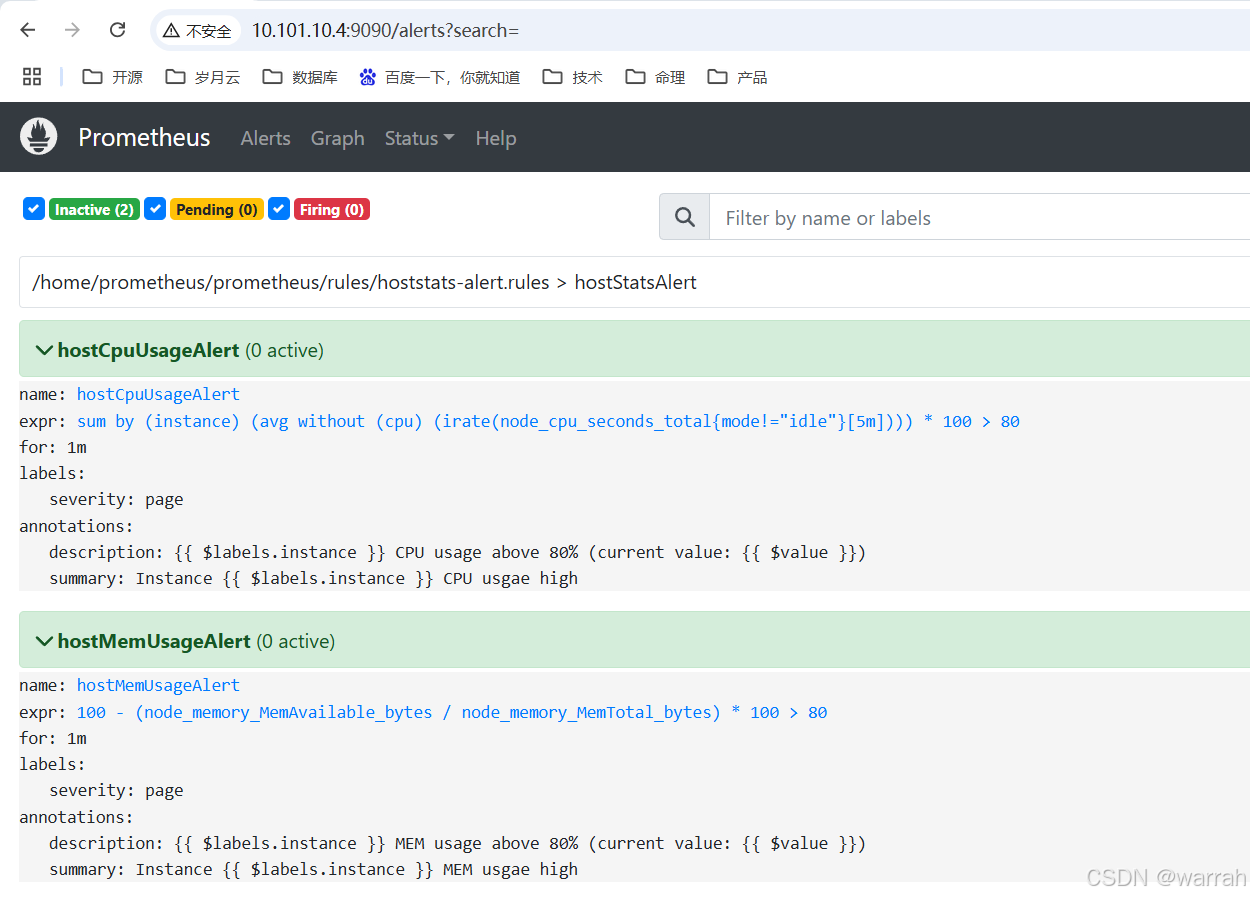
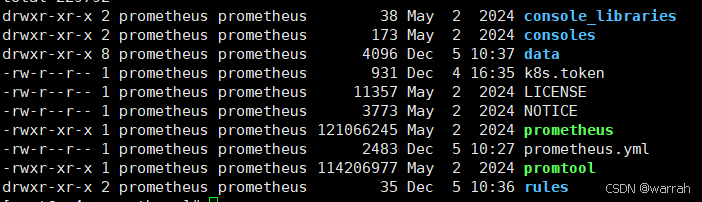
3.2.3 k8s.token
在prometheus根目录创建k8s.token文件,文件内容为对应kuboard的token,K8S Dashboard CN 20240513 StarsL.cn另外一个监控模板


 6571
6571

 被折叠的 条评论
为什么被折叠?
被折叠的 条评论
为什么被折叠?
 到【灌水乐园】发言


