


 这篇博客介绍了一种使用LaTeX制作动态GIF图的方法,包括使用preview宏包裁剪PDF多余空白,通过循环生成连续图像,将PDF转换为PNG,以及最后用 imagemagick 制作GIF。作者还分享了遇到的问题和解决方案,以及针对大量图像的优化技巧。
文章目录
引言
我们知道,一般我们作图都是用stata、matlab或其他软件,然后再将作出的图片另做他用,如做定格动画。但一般很少人直接用latex去做,原因有两点:(1)作出的图为PDF版本,还需通过一定的途径转化为其他格式如PNG格式;(2)目前很多软件如imagemagick、Adobe acrobat DC转出的图片效果不是很好(失真率很大);(3)定格动画本身需要很多图片素材,一般需要跑循环才能完成,而latex的循环语句比较难阅读和使用的。本文的目的在于为大家创建一个用latex做定格动画的模式,以供大家套用。
先做出单张PDF图
这里我们先做一个角度为
12
0
∘
120^\circ
120∘的图。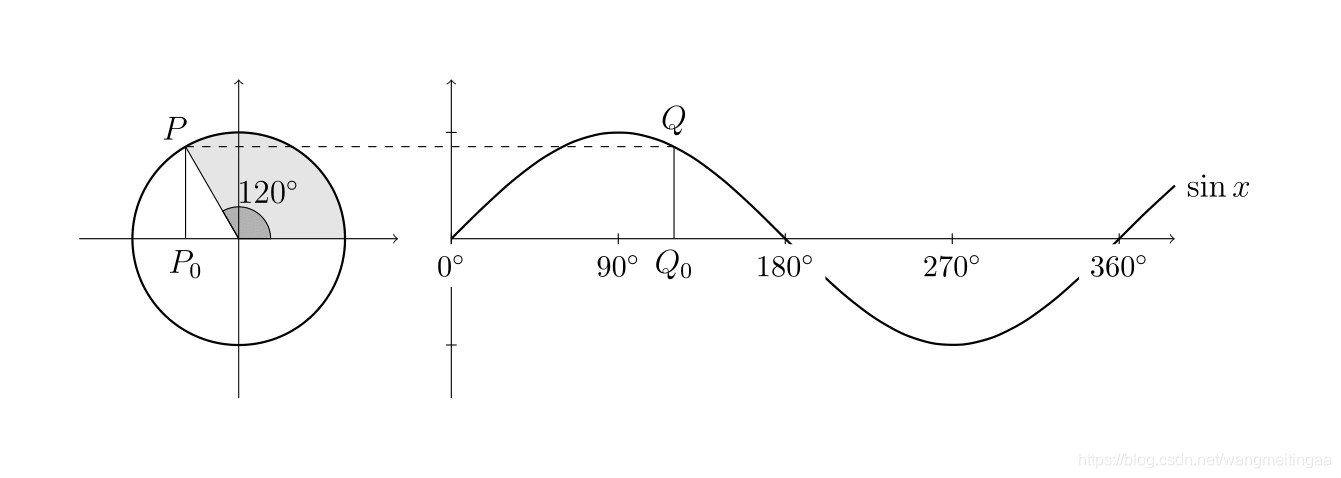
代码如下:
%采用pdflatex编译(速度大大提升)
\documentclass[12pt,a4paper,UTF8]{ctexart}
\usepackage{tikz}
\usepackage{siunitx} %需要用到\ang[options]{degrees}命令
\newcommand{\iangle}{120}
%\usepackage{ctex}
\usepackage[landscape]{geometry} %使得页面横置
%对于中文字体的处理:pdfLaTeX用CJK包或ctex包会出错,而用\documentclass[UTF8]{ctexart}则没有问题;XeLaTeX用CJK包,则可以正确编译。

\begin{document}
\begin{tikzpicture}[scale=1.5] %scale参数可以使得图形放大一定的倍数而本身的字体大小可以保持不变。
	%画左边的圆
	%scope环境里够成一整个区块,然后可以使这一整个区块进行平移。
	\begin{scope}[xshift=-1.75cm]
		\fill[fill=gray,fill opacity=0.2]
		(0,0) -- (0:1) arc (0:\iangle:1) -- cycle;
		\filldraw[fill=gray,fill opacity=0.5]
		(0,0) --(0:0.3) arc (0:\iangle:0.3) -- cycle;
		\draw[->] (-1.2,0) -- (1.2,0);
		\draw[->] (0,-1.2) -- (0,1.2);
		\draw[thick] (0,0) circle (1);
		\coordinate[label=\iangle:$P$] (P) at (\iangle:1);
		\coordinate[label=below:$P_0$] (P0) at (P |- 0,0);
		\draw (0,0) -- (P);
		\draw (P) -- (P0);
		\node[right] at (\iangle/2:0.3) {\ang{\iangle}};
	\end{scope}
	%画右边的正弦曲线
	\draw[->] (0,0) -- ({rad(210)},0);
	\draw[->] (0,-1.2) -- (0,1.2);
	\draw[thick,domain=0:rad(210)] plot(\x,{sin(\x r)}) node[right] {$\sin x$};
	\foreach \t in {0,90,180} {
		\draw ({rad(\t)},-0.05) -- ({rad(\t)},0.05);
		\node[below,outer sep=2pt,fill=white,font=\small]
		at ({rad(\t)},0) {\ang{\t}};
	}
	\foreach \y in {-1,1} {
		\draw (-0.05,\y) -- (0.05,\y);
	}
	\coordinate[label=above:$Q$] (Q) at ({rad(\iangle)},{sin(\iangle)});
	\coordinate[label=below:$Q_0$] (Q0) at (Q |- 0,0);
	\draw (Q) -- (Q0);
	%左右相互连接
	\draw[dashed] (P) -- (Q);
\end{tikzpicture}
\end{document}
用preview宏包切除tikzpicture环境周围多余的空白(或者也可以设定周围固定的空白长度)
代码如下:
%直接不用脚本,即注释掉\pgfrealjobname{survey}等系列命令,然后用pdflatex进行编译。
%编译后每一个tikzpicture环境中的图都在单独的一个页面存在,然后可以通过\setlength\PreviewBorder{距离}设置四周边界的大小,以达到更好的观赏目的。
\documentclass[12pt,a4paper]{article}
\usepackage{tikz}
%\pgfrealjobname{survey}
\usepackage{siunitx} %需要用到\ang[options]{degrees}命令
\newcommand{\iangle}{120}
\usepackage[pdftex,active,tightpage]{preview}
\setlength\PreviewBorder{2cm} % use to add a border around the image
\PreviewEnvironment{tikzpicture}

\begin{document}
%\beginpgfgraphicnamed{survey-f1}
\begin{tikzpicture}[scale=1.5]
	%画左边的圆
	\begin{scope}[xshift=-1.75cm]
		\fill[fill=gray,fill opacity=0.2]
		(0,0) -- (0:1) arc (0:\iangle:1) -- cycle;
		\filldraw[fill=gray,fill opacity=0.5]
		(0,0) --(0:0.3) arc (0:\iangle:0.3) -- cycle;
		\draw[->] (-1.2,0) -- (1.2,0);
		\draw[->] (0,-1.2) -- (0,1.2);
		\draw[thick] (0,0) circle (1);
		\coordinate[label=\iangle:$P$] (P) at (\iangle:1);
		\coordinate[label=below:$P_0$] (P0) at (P |- 0,0);
		\draw (0,0) -- (P);
		\draw (P) -- (P0);
		\node[right] at (\iangle/2:0.3) {\ang{\iangle}};
	\end{scope}
	%画右边的正弦曲线
	\draw[->] (0,0) -- ({rad(210)},0);
	\draw[->] (0,-1.2) -- (0,1.2);
	\draw[thick,domain=0:rad(210)] plot(\x,{sin(\x r)}) node[right] {$\sin x$};
	\foreach \t in {0,90,180} {
		\draw ({rad(\t)},-0.05) -- ({rad(\t)},0.05);
		\node[below,outer sep=2pt,fill=white,font=\small]
		at ({rad(\t)},0) {\ang{\t}};
	}
	\foreach \y in {-1,1} {
		\draw (-0.05,\y) -- (0.05,\y);
	}
	\coordinate[label=above:$Q$] (Q) at ({rad(\iangle)},{sin(\iangle)});
	\coordinate[label=below:$Q_0$] (Q0) at (Q |- 0,0);
	\draw (Q) -- (Q0);
	%左右相互连接
	\draw[dashed] (P) -- (Q);
\end{tikzpicture}
%\endpgfgraphicnamed
\end{document}
用循环语句生成连续的PDF图(在前面的preview宏包的作用下,每个tikzpicture都为单独的一页)
代码如下(从 0 ∘ 0^\circ 0∘到 36 0 ∘ 360^\circ 360∘共361页PDF图):
\documentclass[12pt,a4paper]{article}
\usepackage{tikz}
\usepackage{ifthen}
\usepackage{siunitx} %需要用到\ang[options]{degrees}命令
\usepackage[pdftex,active,tightpage]{preview}
\setlength\PreviewBorder{1cm} % use to add a border around the image
\PreviewEnvironment{tikzpicture}

%微调系数
\newcommand{\iangle}{0} %设定角度起始值
\newcommand{\ax}{0.3*1.85} %椭圆a值
\newcommand{\by}{0.3*1.7} %椭圆b值
\newcommand{\p}{1*1.2} %放置的P离原点的距离

\usepackage{xparse}
\ExplSyntaxOn
\NewDocumentCommand{\forrange}{mO{1}mm}
{
	\int_step_function:nnnN {#1} {#2} {#3} #4
}
\ExplSyntaxOff
\newcommand{\mycommand}[1]{
	\renewcommand{\iangle}{#1}
	\begin{tikzpicture}[scale=1.5]
	%画左边的圆
	\begin{scope}[xshift=-2cm]
	\fill[fill=gray,fill opacity=0.2]
	(0,0) -- (0:1) arc (0:\iangle:1) -- cycle;
	\filldraw[fill=gray,fill opacity=0.5]
	(0,0) --(0:0.3) arc (0:\iangle:0.3) -- cycle;
	\draw[->] (-1.5,0) -- (1.5,0);
	\draw[->] (0,-1.5) -- (0,1.5);
	\draw[thick] (0,0) circle (1);
	\coordinate (P) at (\iangle:1);
	\node at (\iangle:\p) {$P$};
	\coordinate[label=below:$P_0$] (P0) at (P |- 0,0);
	\draw (0,0) -- (P);
	\draw (P) -- (P0);
	\node at ({\ax*cos(\iangle/2)},{\by*sin(\iangle/2)}) {\ang{\iangle}};
	\end{scope}
	%画右边的正弦曲线
	\draw[->] (0,0) -- ({rad(390)},0);
	\draw[->] (0,-1.5) -- (0,1.5);
	\draw[thick,smooth,domain=0:rad(390)] plot(\x,{sin(\x r)}) node[right] {$\sin x$};
	\foreach \t in {0,90,...,360} {
		\draw ({rad(\t)},-0.05) -- ({rad(\t)},0.05);
		\node[below,outer sep=2pt,fill=white,font=\small]
		at ({rad(\t)},0) {\ang{\t}};
	}
	\foreach \y in {-1,1} {
		\draw (-0.05,\y) -- (0.05,\y);
	}
	\ifthenelse{\iangle < 180}{
		\coordinate[label=above:$Q$] (Q) at ({rad(\iangle)},{sin(\iangle)});}{
		\coordinate[label=below:$Q$] (Q) at ({rad(\iangle)},{sin(\iangle)});
		}
	\coordinate[label=below:$Q_0$] (Q0) at (Q |- 0,0);
	\draw (Q) -- (Q0);
	%左右相互连接
	\draw[dashed] (P) -- (Q);
	\end{tikzpicture}
}

\begin{document}
\forrange{0}[1]{360}{\mycommand}
\end{document}
PDF图转化为PNG图
这个我试过imagemagick的convert,Adobe acrobat DC自带的转化,效果都不是很好。这里提供一个国外的网站,效果是我用过最好的:它会把前面361页的PDF文档转化为361张图片(命名格式为:原文件名称+数字序号)。
做GIF图
这里可以用imagemagick的命令实现,具体为:
magick -delay 1 "./figures/*.png" together.gif
-delay标明每一张图片的时间间隔,我的测试结果是:这里的1单位长度时间接近0.04s(也就是我们在我们在做视频中常常见到的1s=25帧中的一帧)。./figures/*.png的意思是我的361张PNG图都放在了当前目录下的figures子目录下,最后生成的together.gif将被放在当前路径下。于是我们就得到了文章开头的图(不知道为什么,做出来的gif放在了网上之后速度就变慢了)。
扩展: 0. 0 ∘ − 360. 0 ∘ 0.0^\circ-360.0^\circ 0.0∘−360.0∘共3600个点形成的gif
过程大致如上,但需要注意以下几个问题:
- 里面的循环step不能出现小数。
\ang{}命令里面若写为\ang{a,b},则a和b都必须要是整数。- 用内核的循环比tizk的循环更快。
- 参数传递时尽量一步到位,以提升运行速度。
具体代码如下:
\documentclass[12pt,a4paper]{article}
\usepackage{tikz} %needed tikz library
\usetikzlibrary{math}
\usepackage{ifthen}
\usepackage{siunitx} %需要用到\ang[options]{degrees}命令
\usepackage[pdftex,active,tightpage]{preview}
\setlength\PreviewBorder{1cm} % use to add a border around the image
\PreviewEnvironment{tikzpicture}

%微调系数
\newcommand{\ax}{0.3*1.85} %椭圆a值
\newcommand{\by}{0.3*1.7} %椭圆b值
\newcommand{\p}{1*1.2} %放置的P离原点的距离

\usepackage{xparse}
\ExplSyntaxOn
\NewDocumentCommand{\forrange}{mO{1}mm}
{
	\int_step_function:nnnN {#1} {#2} {#3} #4
}
\ExplSyntaxOff
\newcommand{\mycommand}[1]{
	\begin{tikzpicture}[scale=2.05]
	\tikzmath{
		\xx = int(#1*0.1);
		\yy = int(mod(#1,10));
	}
	%画左边的圆
	\begin{scope}[xshift=-2cm]
	\fill[fill=gray,fill opacity=0.2]
	(0,0) -- (0:1) arc (0:#1/10:1) -- cycle;
	\filldraw[fill=gray,fill opacity=0.5]
	(0,0) --(0:0.3) arc (0:#1/10:0.3) -- cycle;
	\draw[->] (-1.5,0) -- (1.5,0);
	\draw[->] (0,-1.5) -- (0,1.5);
	\draw[thick] (0,0) circle (1);
	\coordinate (P) at (#1/10:1);
	\node at (#1/10:\p) {$P$};
	\coordinate[label=below:$P_0$] (P0) at (P |- 0,0);
	\draw (0,0) -- (P);
	\draw (P) -- (P0);
	\node at ({\ax*cos(#1/10/2)},{\by*sin(#1/10/2)}) {\ang{\xx,\yy}};
	\end{scope}
	%画右边的正弦曲线
	\draw[->] (0,0) -- ({rad(390)},0);
	\draw[->] (0,-1.5) -- (0,1.5);
	\draw[thick,smooth,domain=0:rad(390)] plot(\x,{sin(\x r)}) node[right] {$\sin x$};
	\foreach \t in {0,90,...,360} {
		\draw ({rad(\t)},-0.05) -- ({rad(\t)},0.05);
		\node[below,outer sep=2pt,fill=white,font=\small]
		at ({rad(\t)},0) {\ang{\t}};
	}
	\foreach \y in {-1,1} {
		\draw (-0.05,\y) -- (0.05,\y);
	}
	\ifthenelse{#1 < 1800}{
		\coordinate[label=above:$Q$] (Q) at ({rad(#1/10)},{sin(#1/10)});}{
		\coordinate[label=below:$Q$] (Q) at ({rad(#1/10)},{sin(#1/10)});
		}
	\coordinate[label=below:$Q_0$] (Q0) at (Q |- 0,0);
	\draw (Q) -- (Q0);
	%左右相互连接
	\draw[dashed] (P) -- (Q);
	\end{tikzpicture}
}

\begin{document}
\forrange{0}[1]{3600}{\mycommand}
\end{document}


 821
821


 到【灌水乐园】发言


