


 本文介绍如何在Ubuntu 20.04上安装配置Prometheus 2.30.2、Grafana 8.2.2及Node Exporter 1.2.2进行监控。包括下载、启动、配置数据源、安装模板等步骤。
安装环境
系统: ubuntu20.04
prometheus: 2.30.2
grafana: 8.2.2
node_exporter: 1.2.2
1. 下载prometheus并解压
wget https://github.com/prometheus/prometheus/releases/download/v2.30.2/prometheus-2.30.2.linux-amd64.tar.gz
tar -zxvf prometheus-2.30.2.linux-amd64.tar.gz
2. 下载grafana并解压
wget https://dl.grafana.com/oss/release/grafana-8.2.2.linux-amd64.tar.gz
tar -zxvf grafana-8.2.2.linux-amd64.tar.gz
3. 进入prometheus解压后的目录,启动prometheus
nohup ./prometheus --config.file="prometheus.yml" > prometheus.log 2>&1 &
4. 查看日志是否启动成功
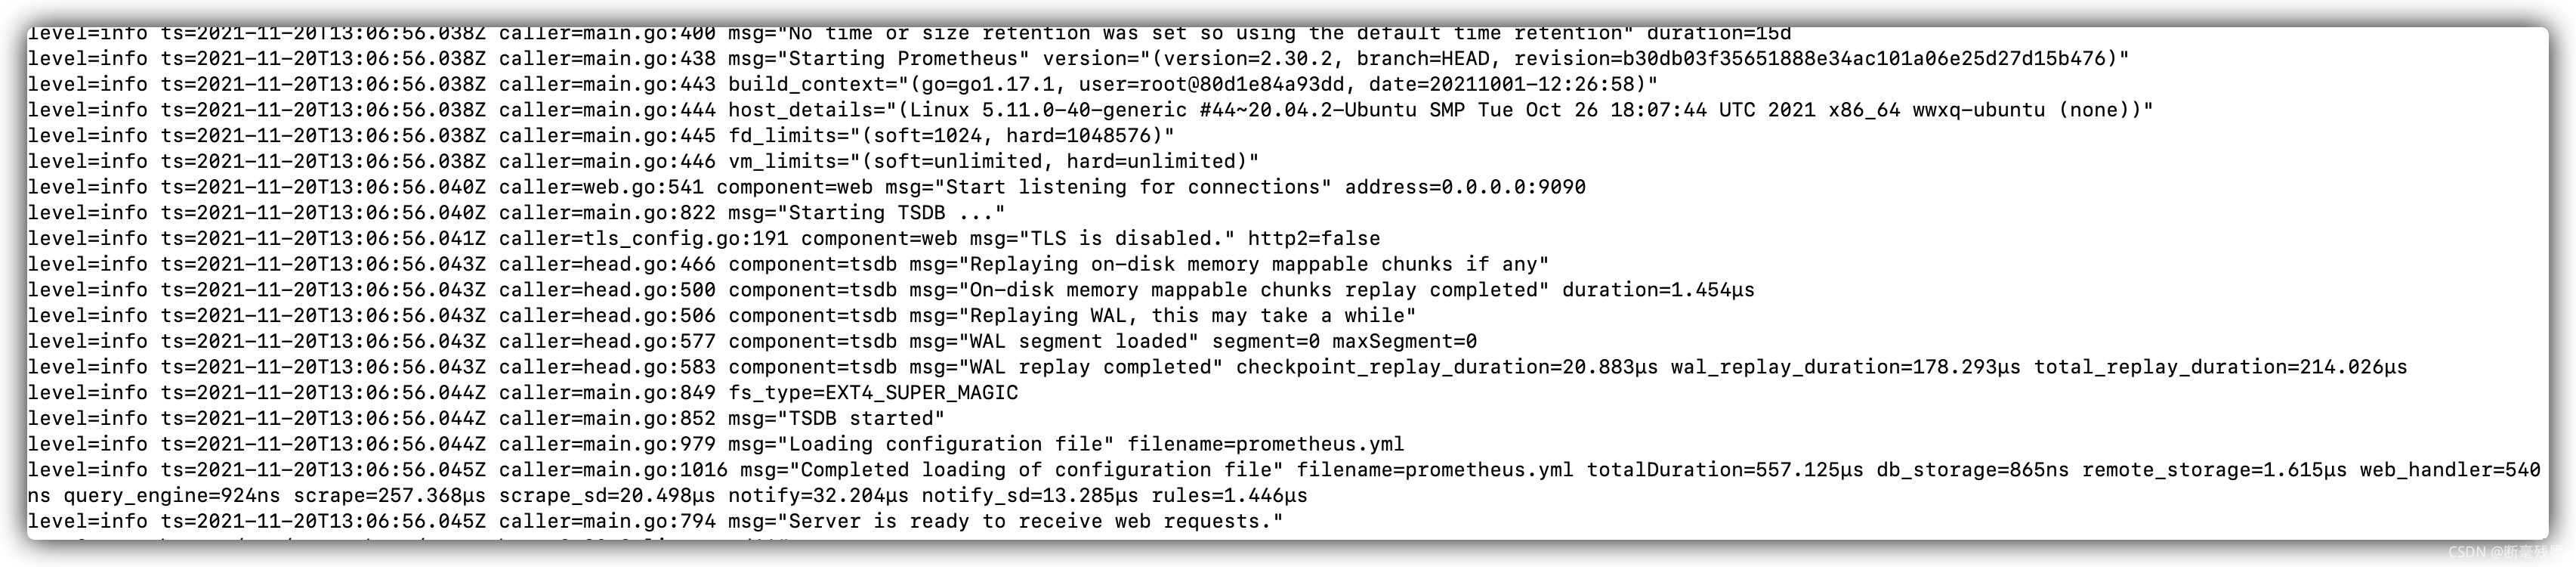
当prometheus启动成功后,你可以通过浏览器来访问 http://IP:9090,将看到如下页面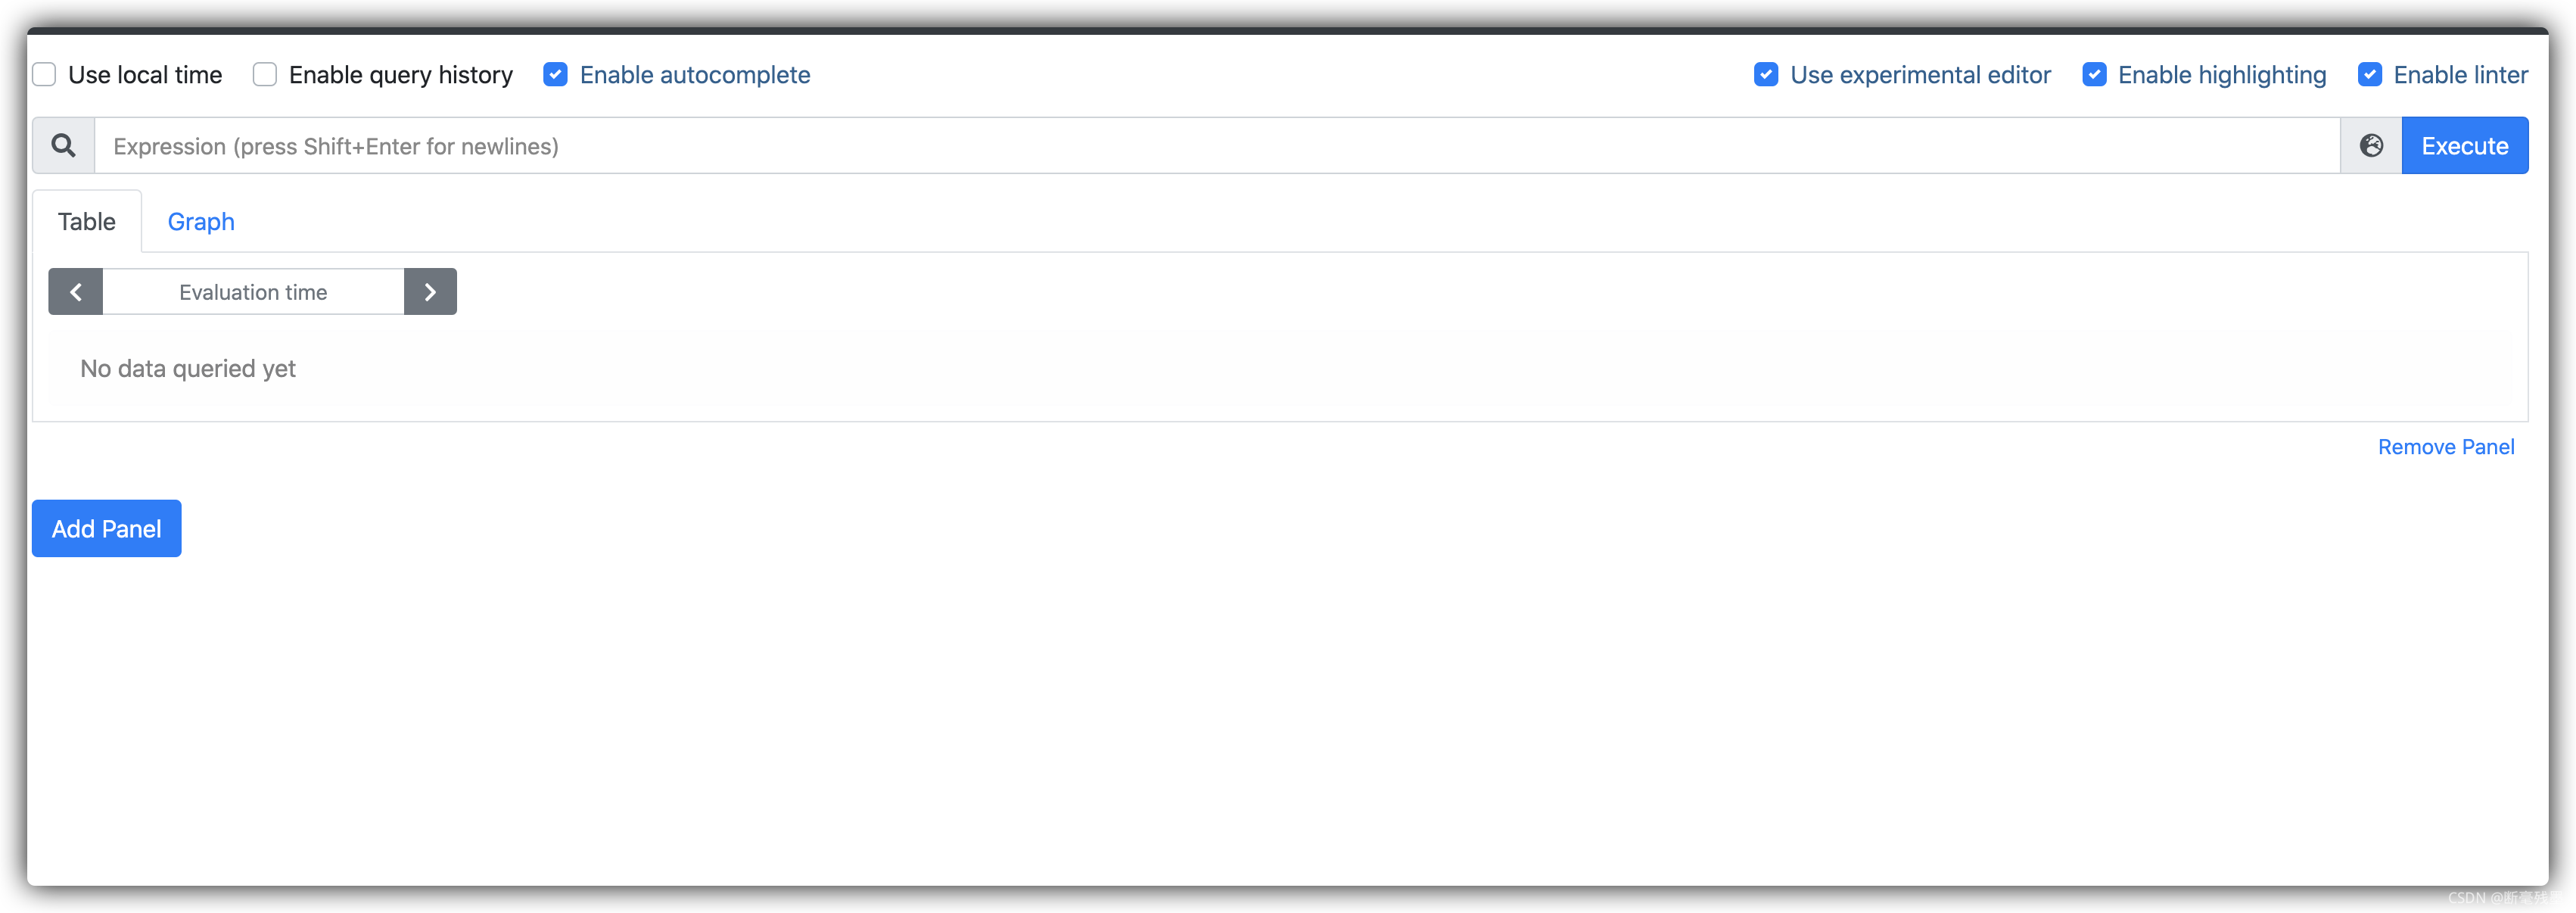 5. 进入grafana目录,并启动grafana
nohup ./bin/grafana-server > grafana.log 2>&1 &6. 查看日志是否启动成功
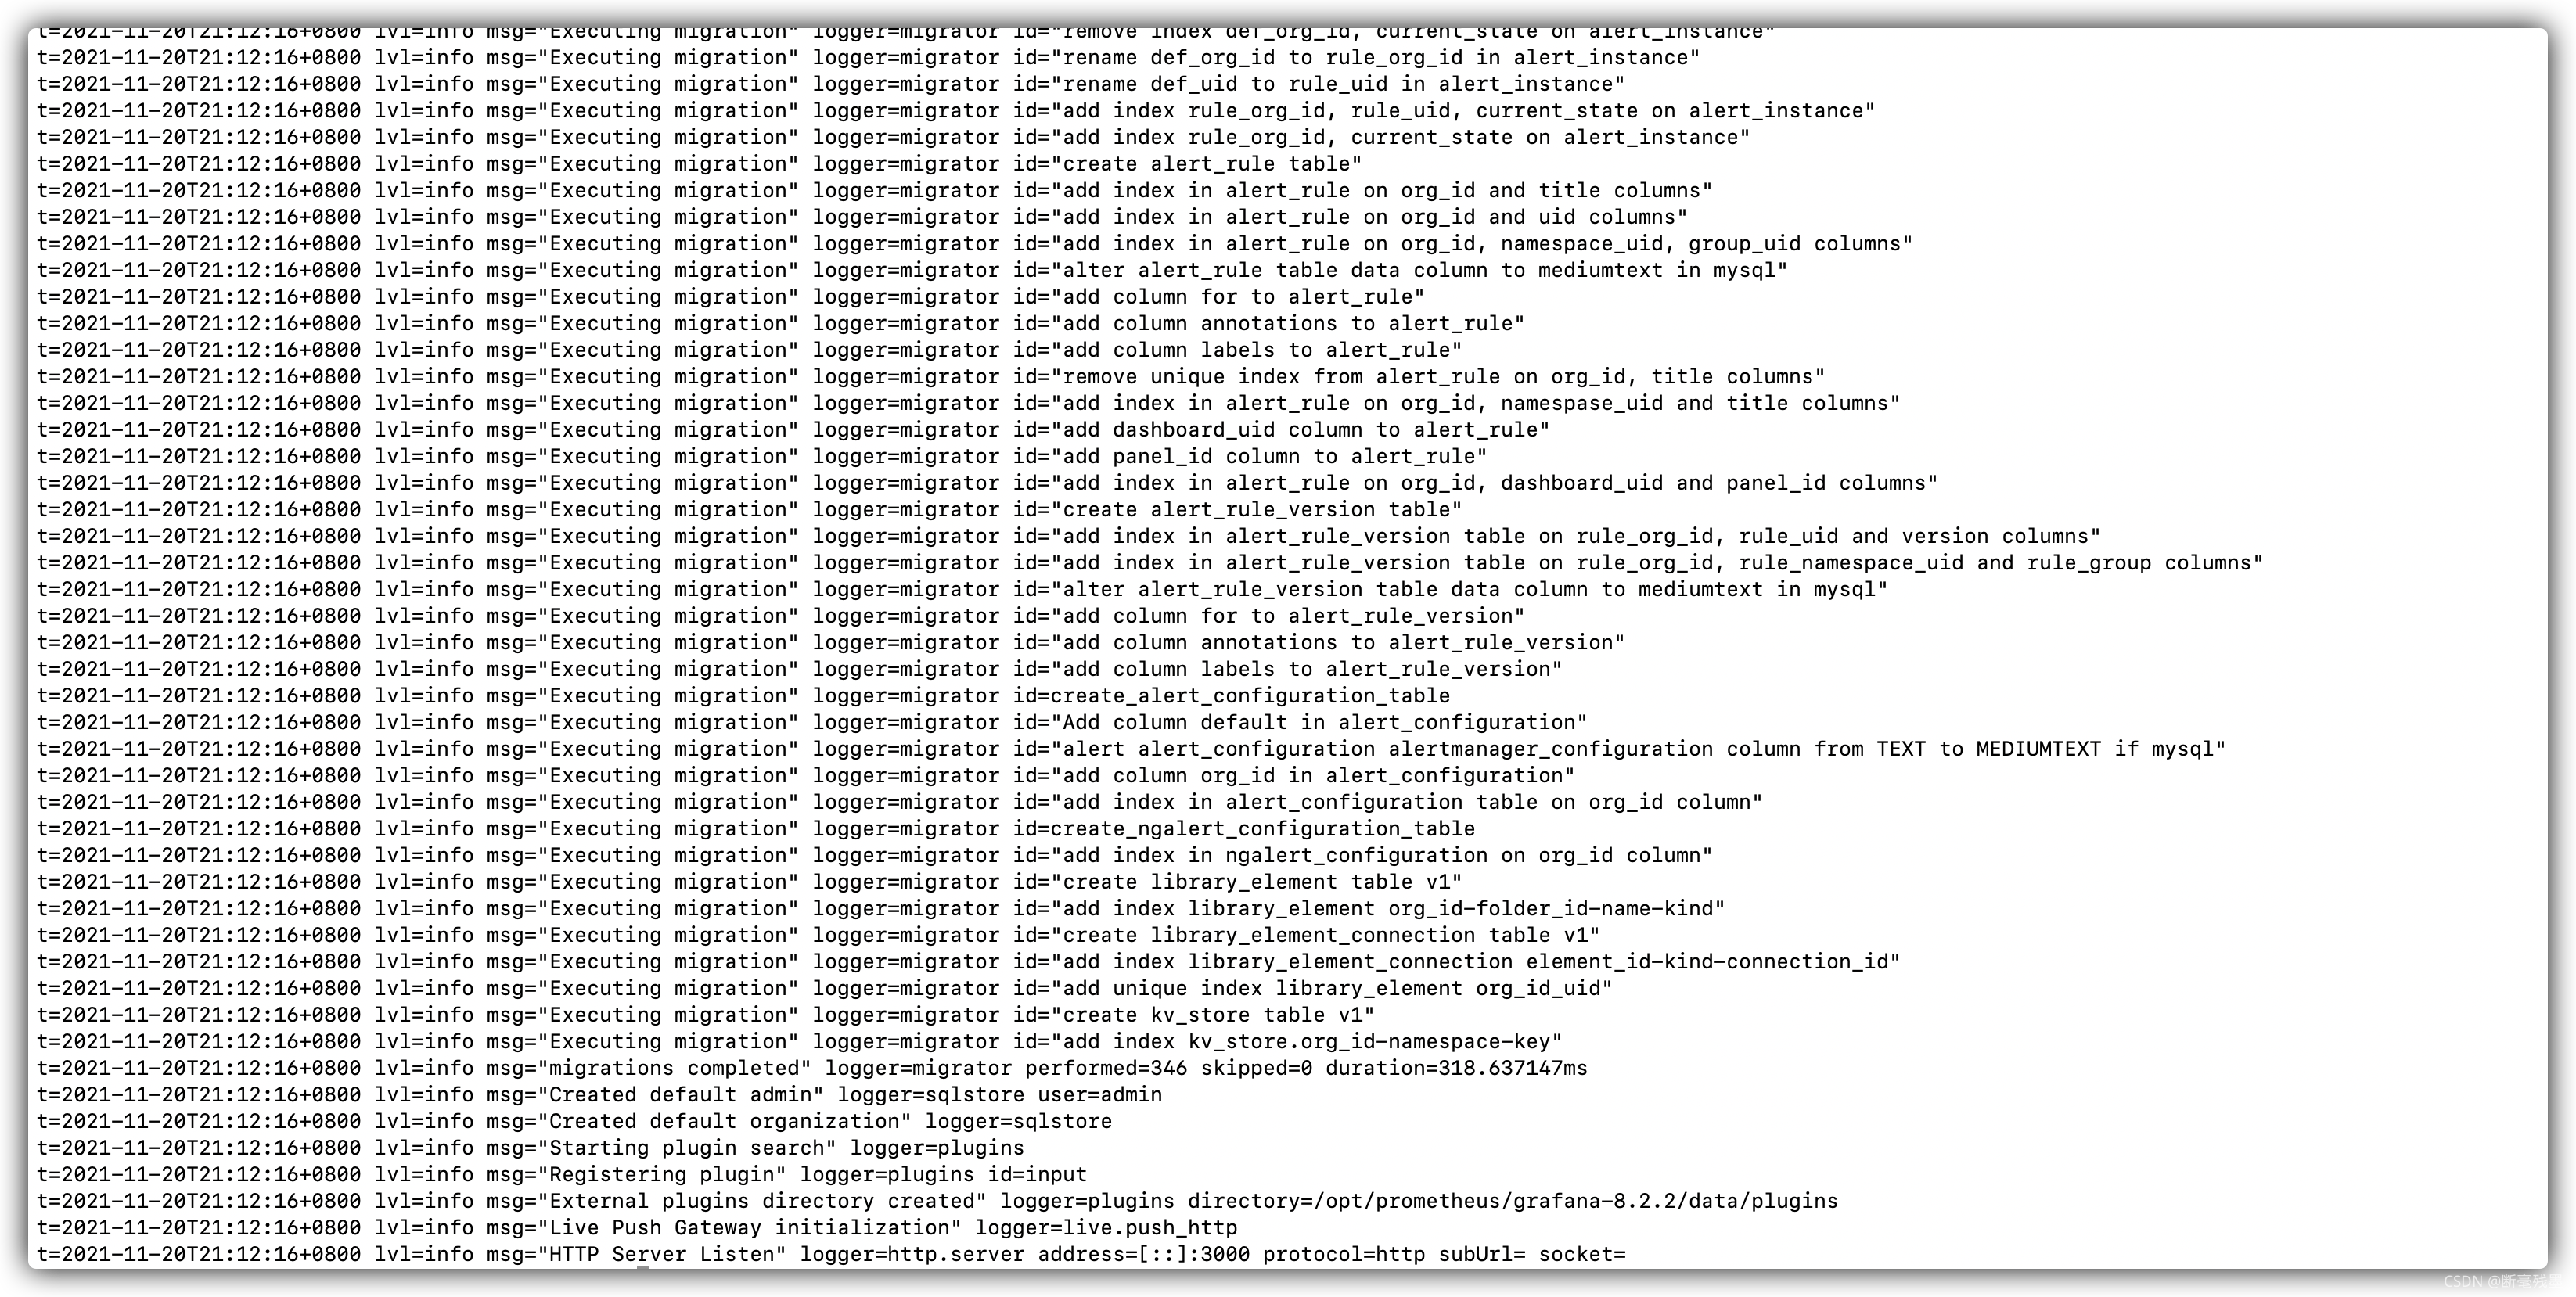
出现以上说明启动成功,端口号3000 ,可以通过浏览器来访问 http://IP:3000,将看到如下页面
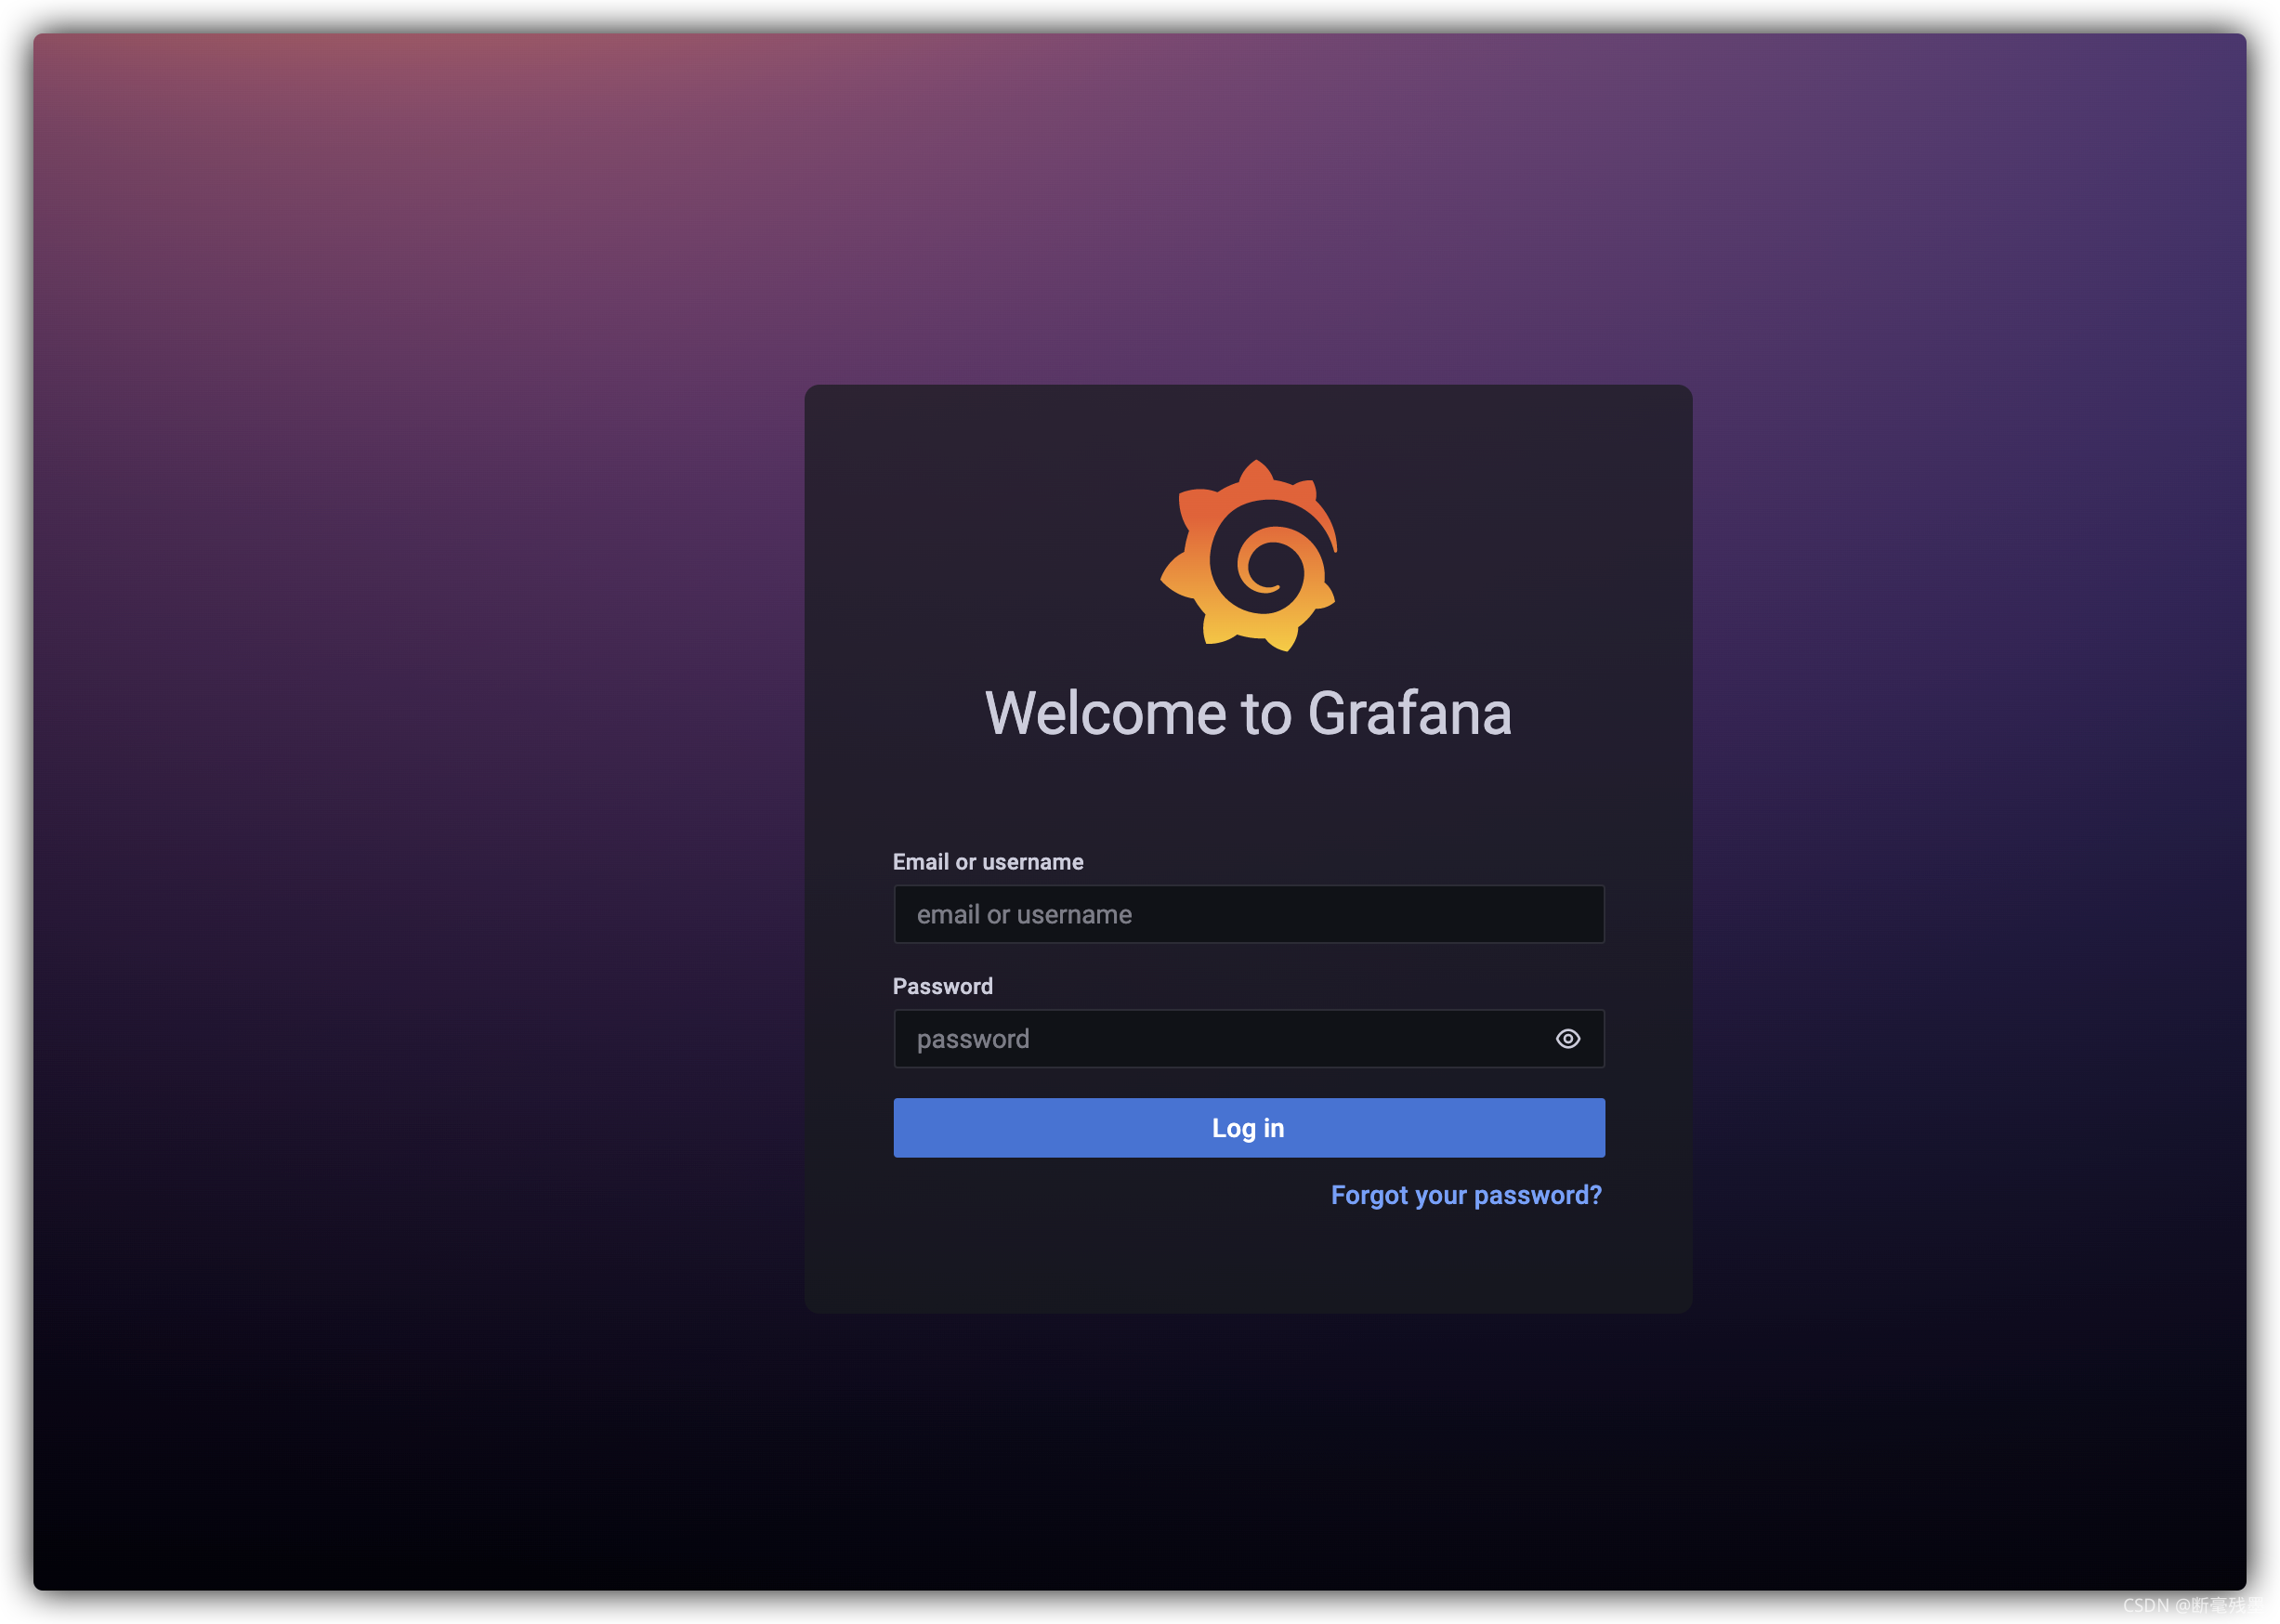
默认用户名密码为都是admin,第一次登陆提示要更改密码,也可以跳过
7. 配置grafana
(1) 点击Configuration Data Sources 配置数据源
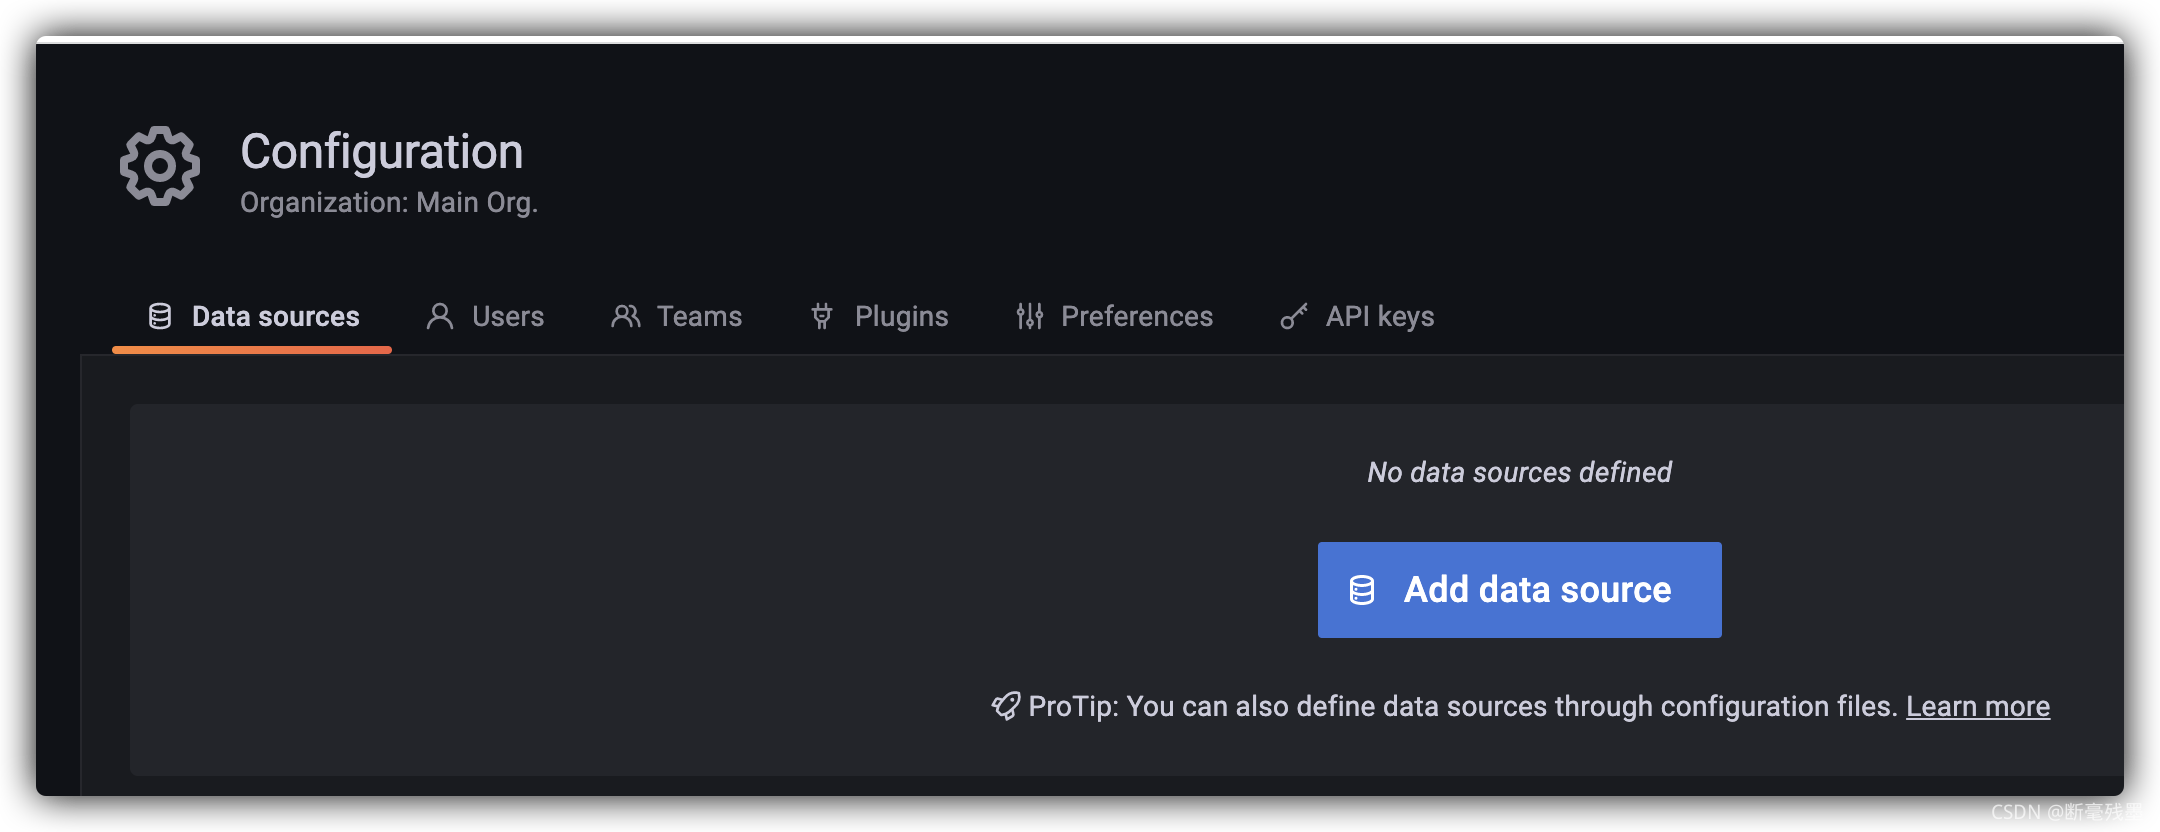
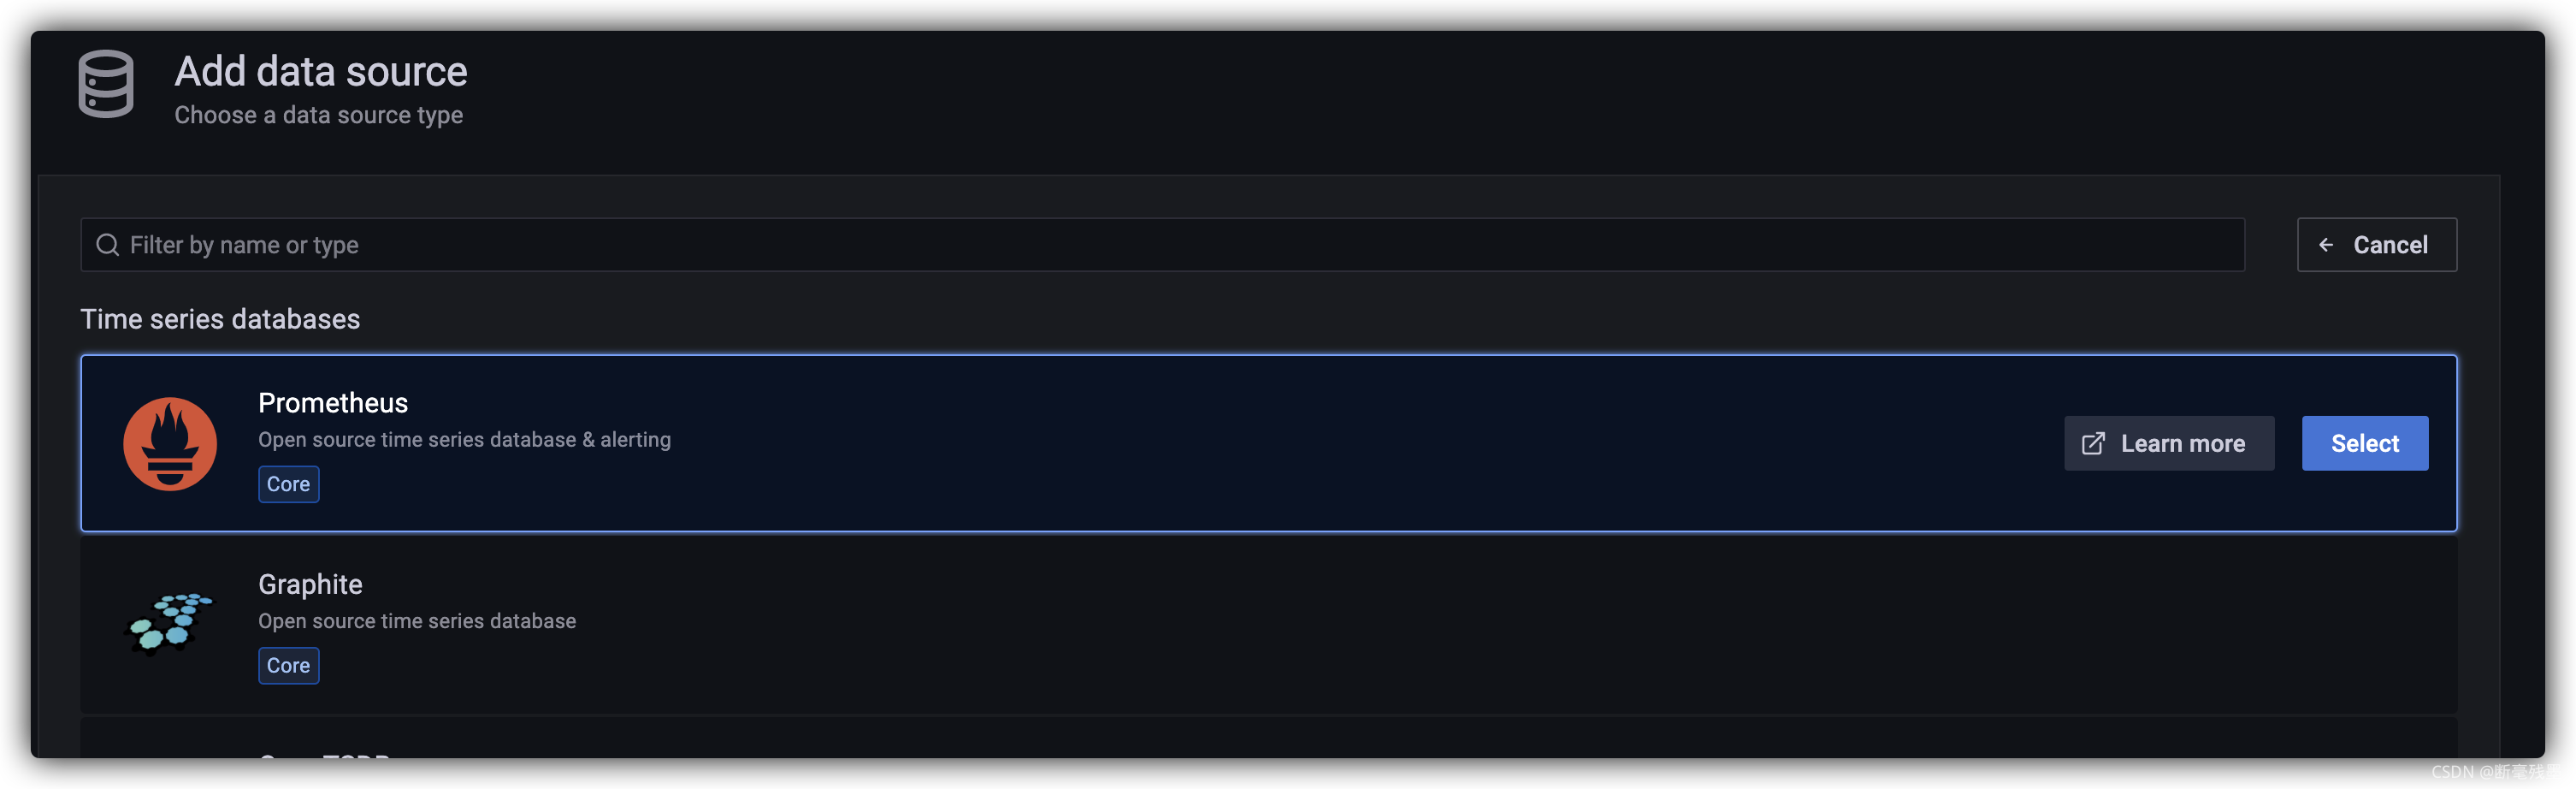
(2) 点击 Add data source 添加一个数据源,选择 Prometheus,点击Select
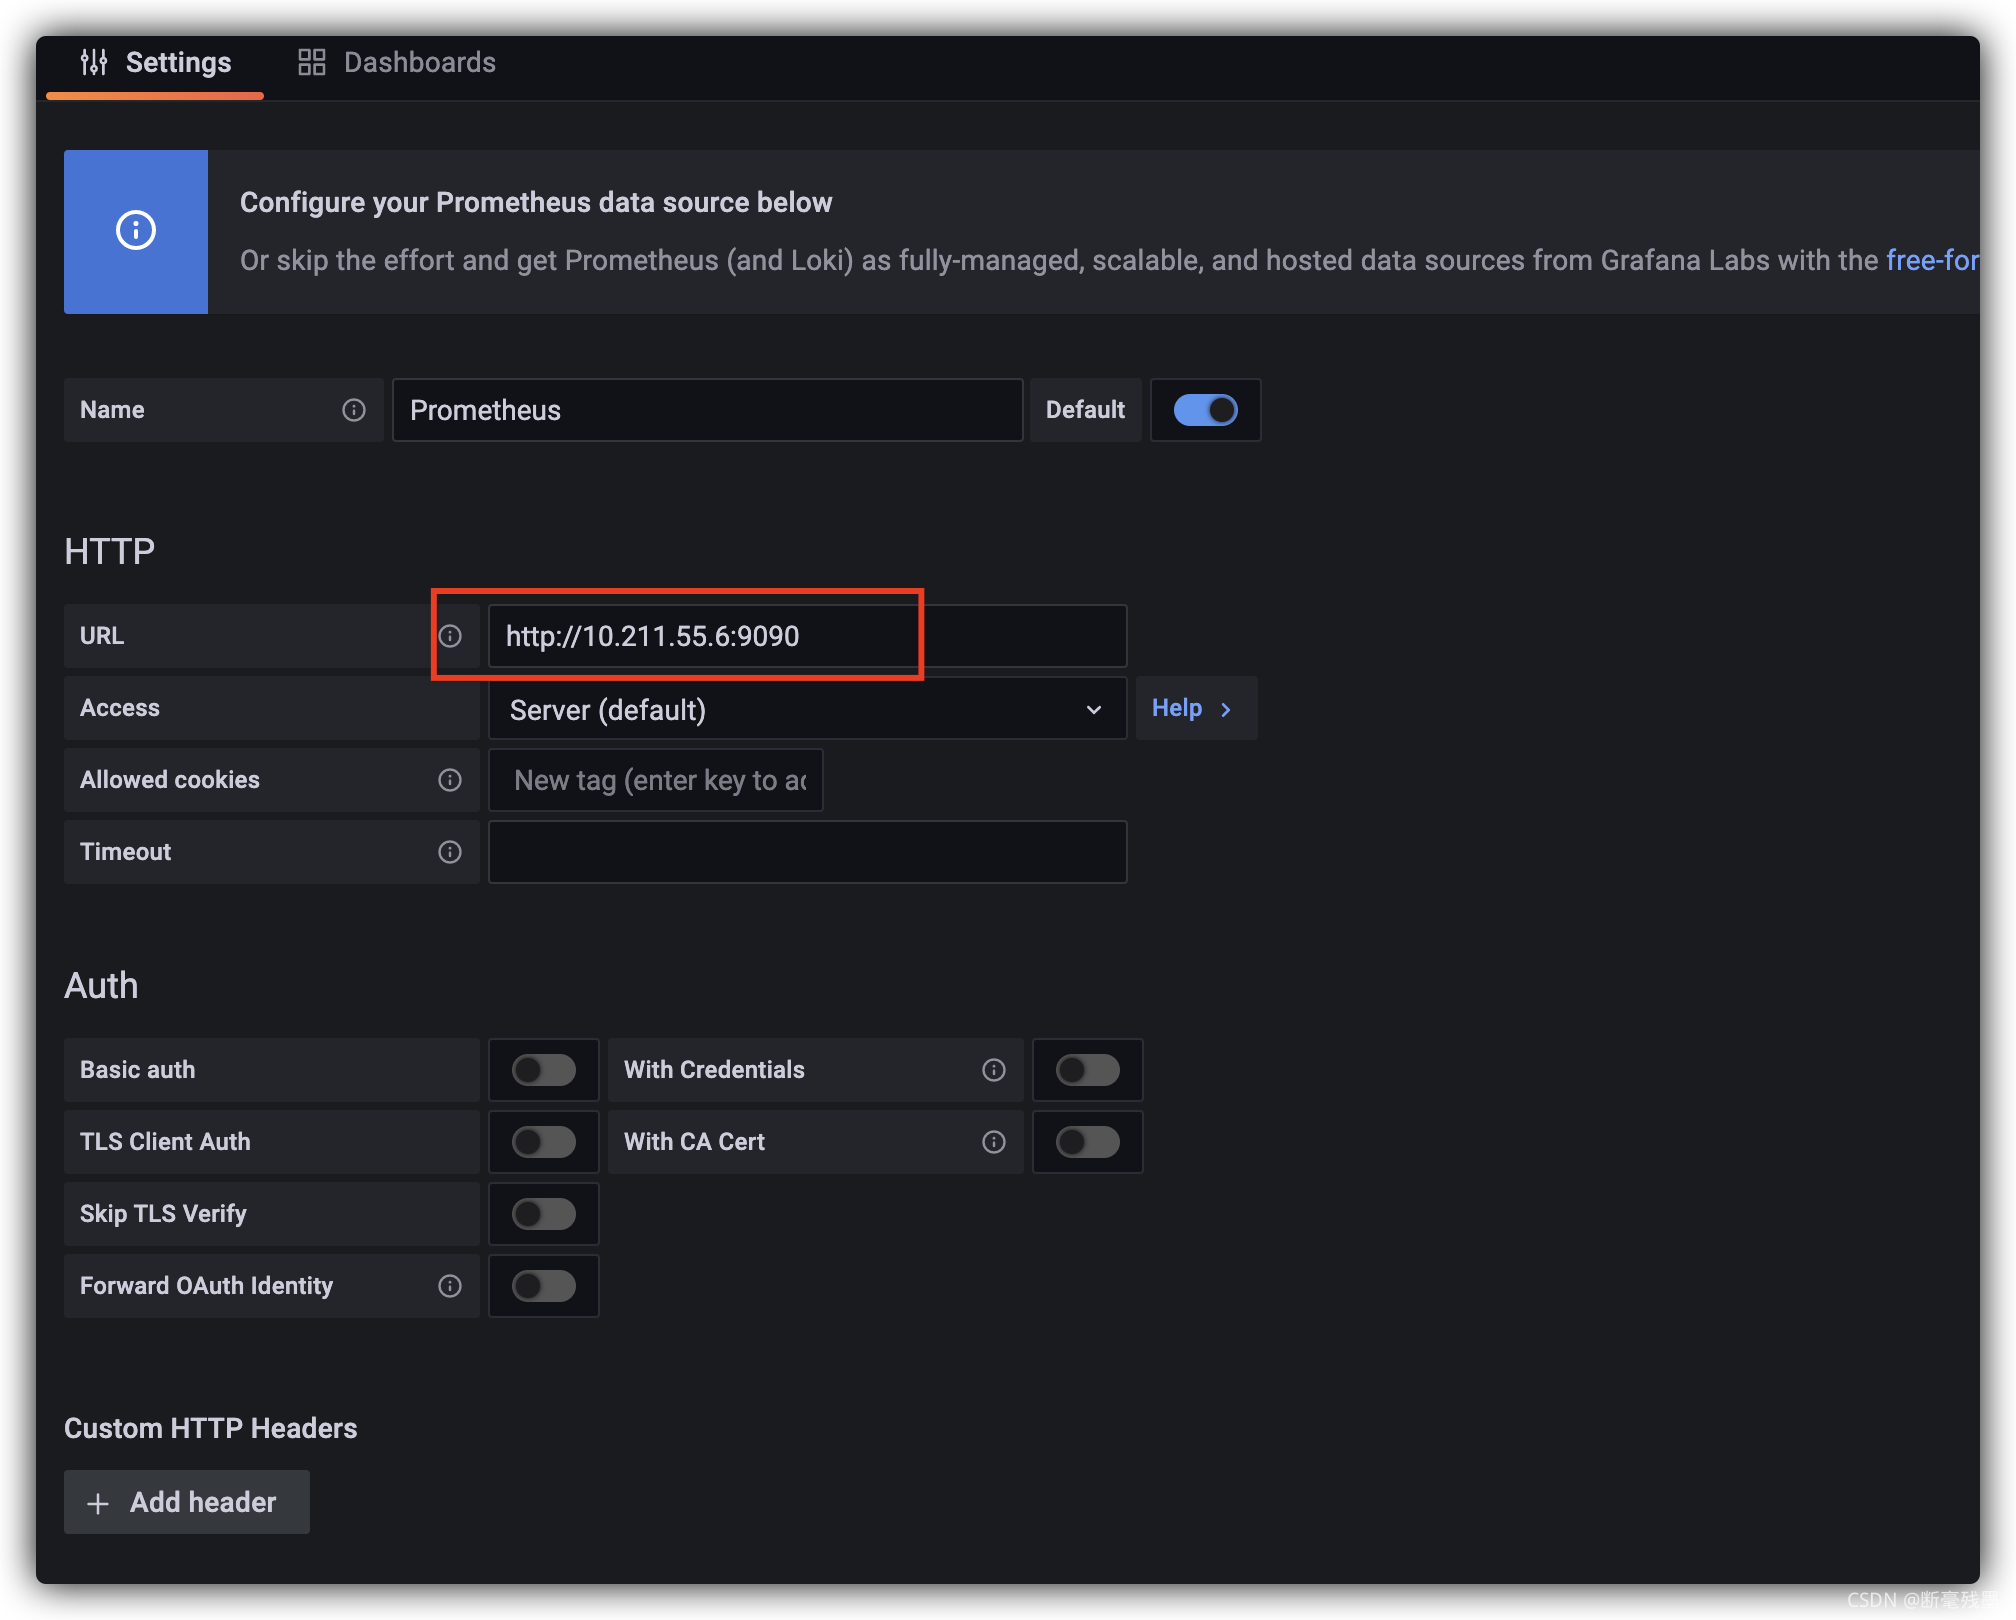
(3) 主要是配置promethues的url,http://IP:9090
(4) 点击 Save& test
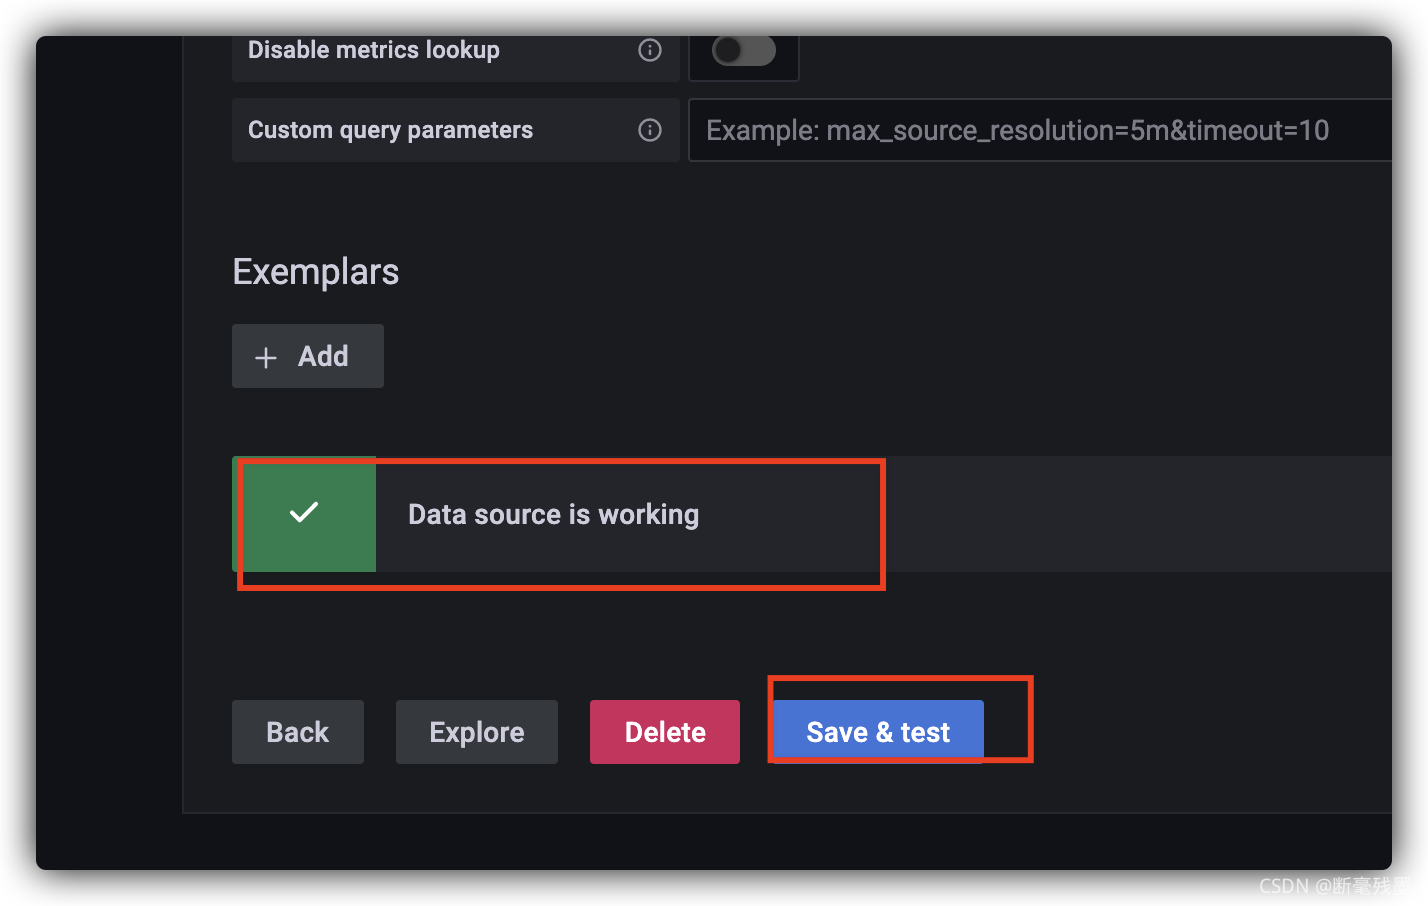
提示Data source is working,说明填写正确
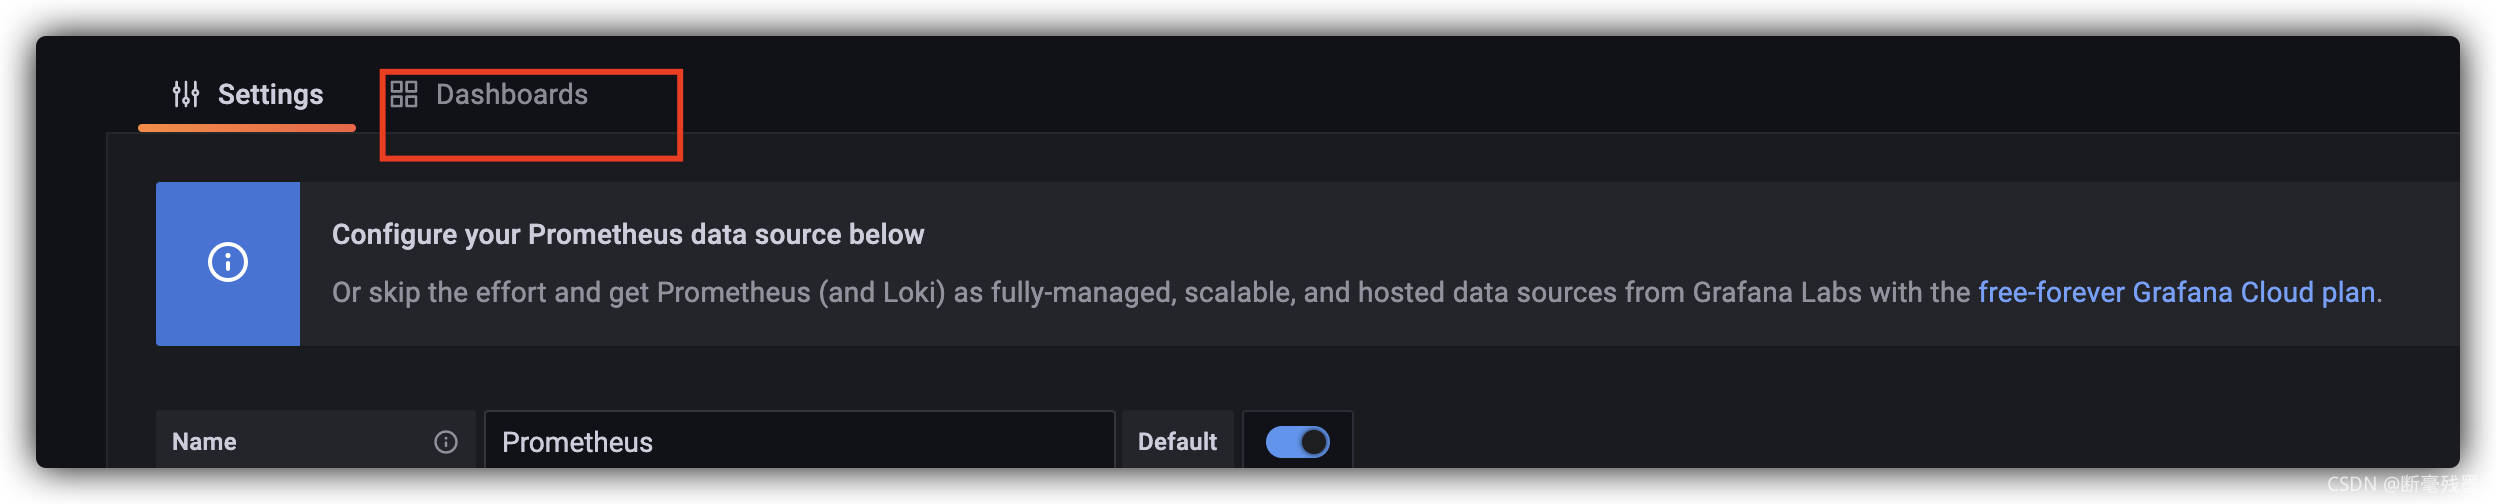
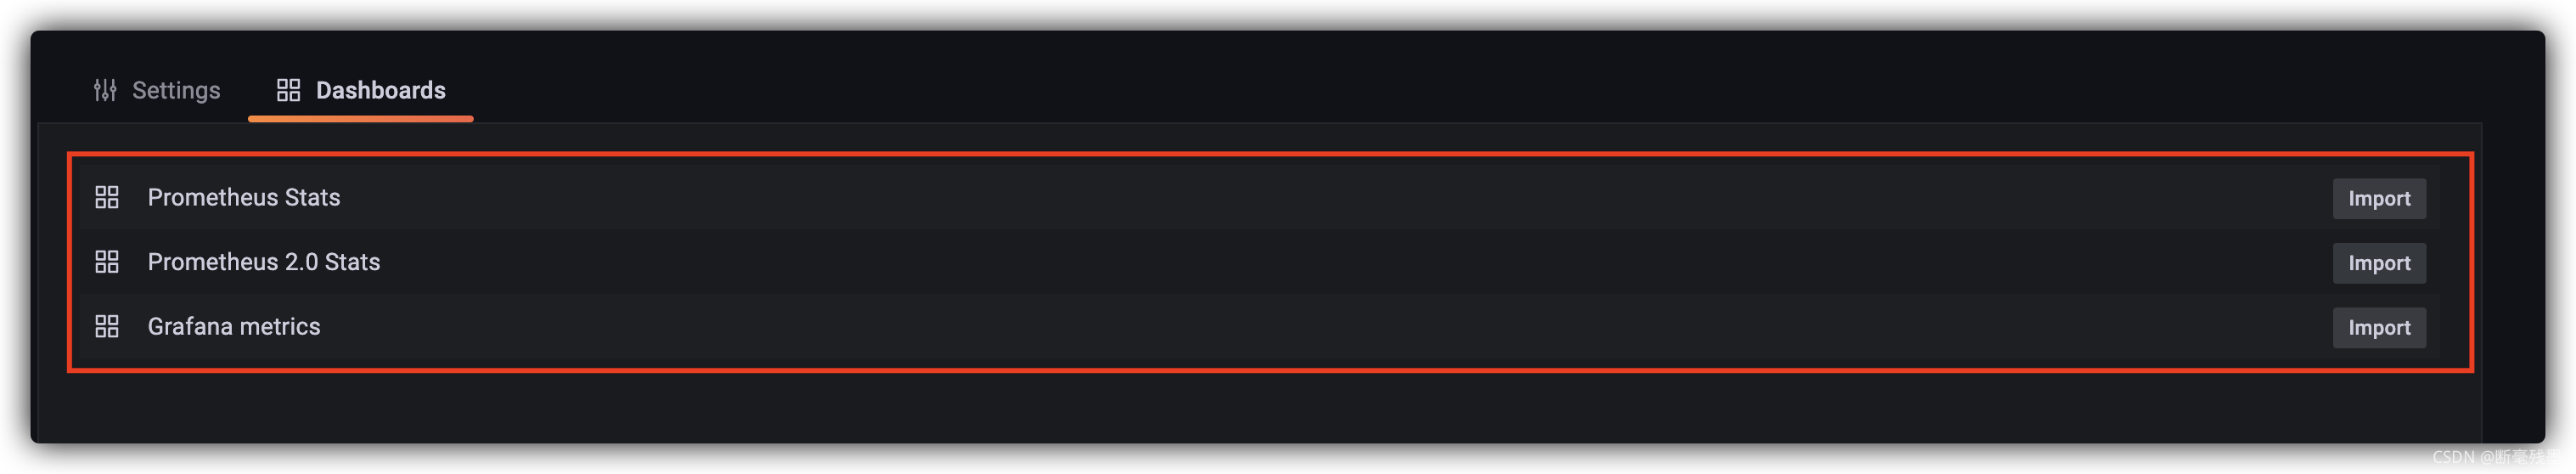
(5) 点击最上面的Dashboards,倒入默认的Dashboard
(6) 点击 Dashboards里的Manager,可以打开一个看一下有没有数据
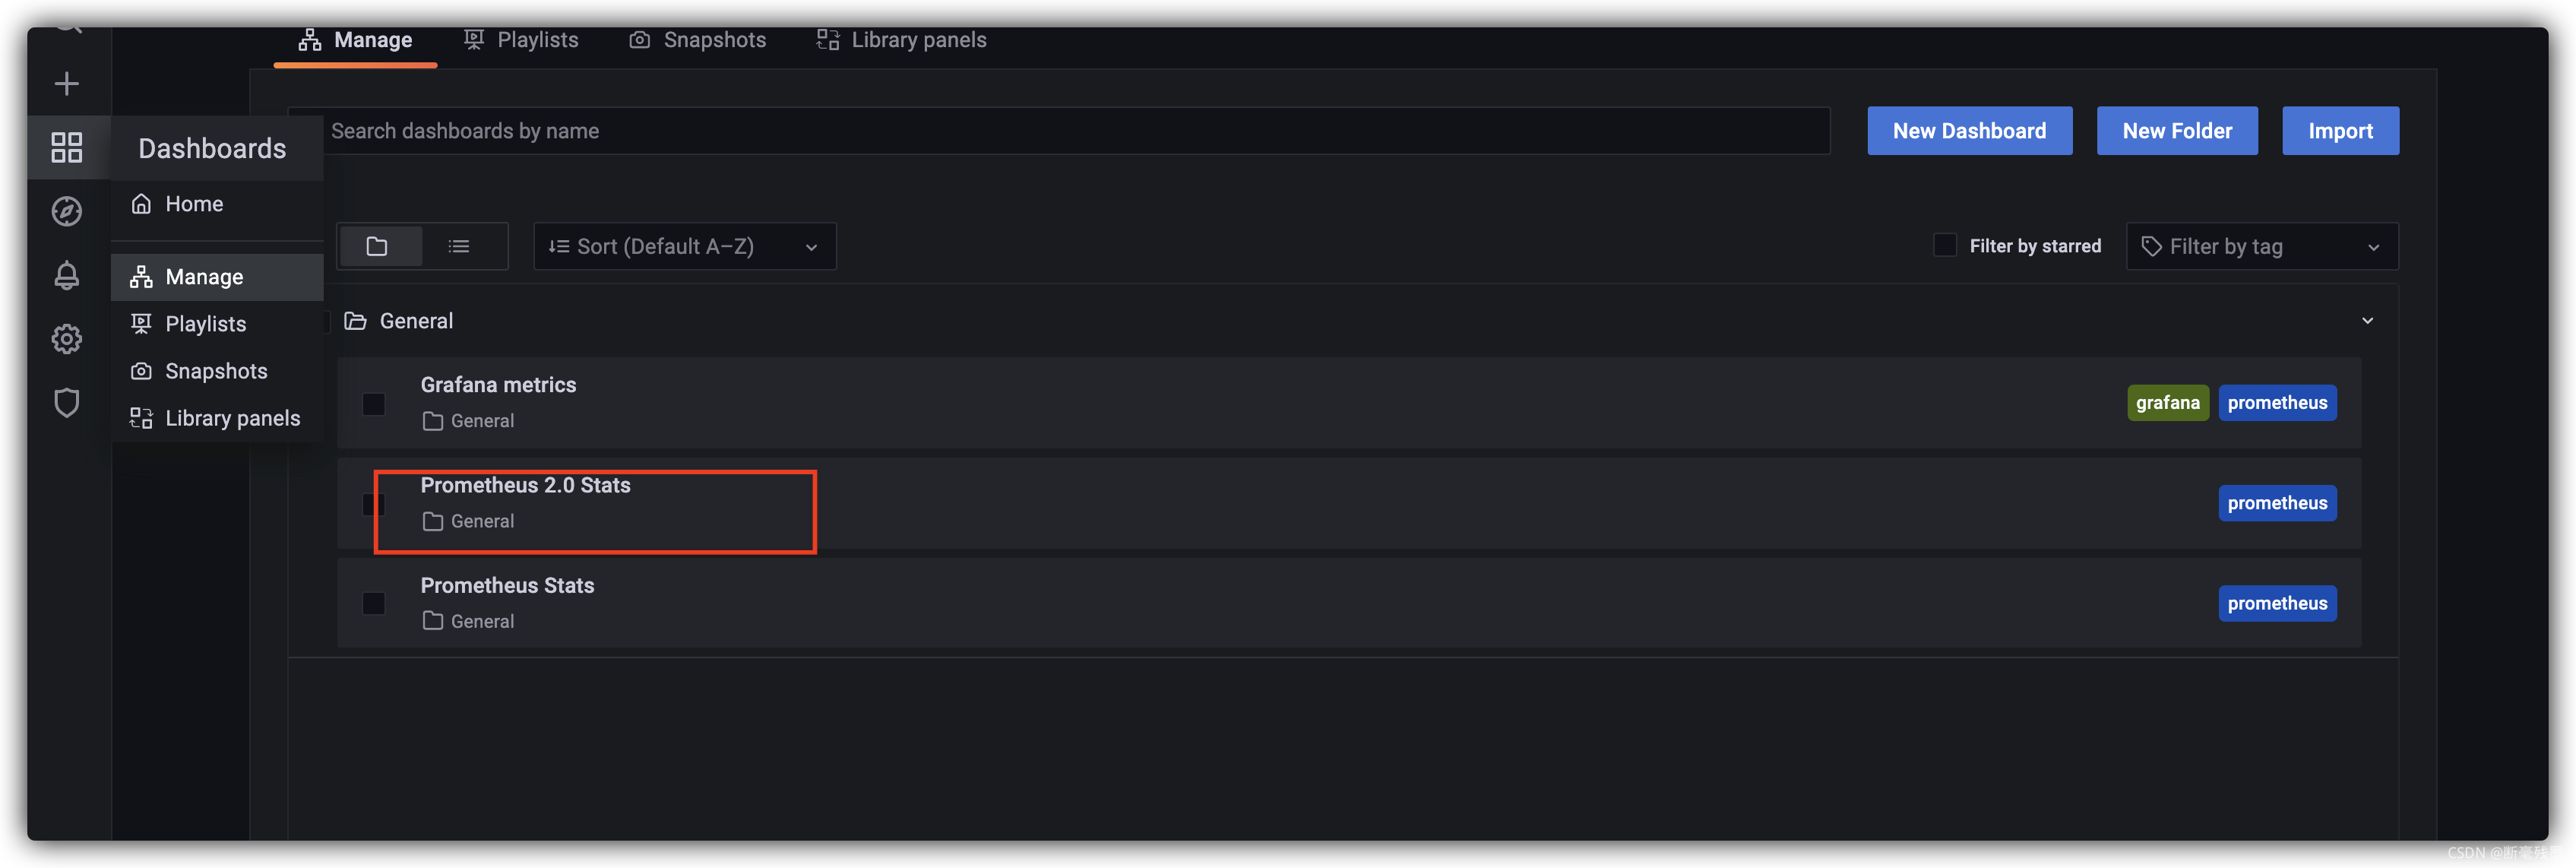
(7) 会发现Grafana metrics没有数据,是因为没有grafana没有配置到prometheus的配置文件里
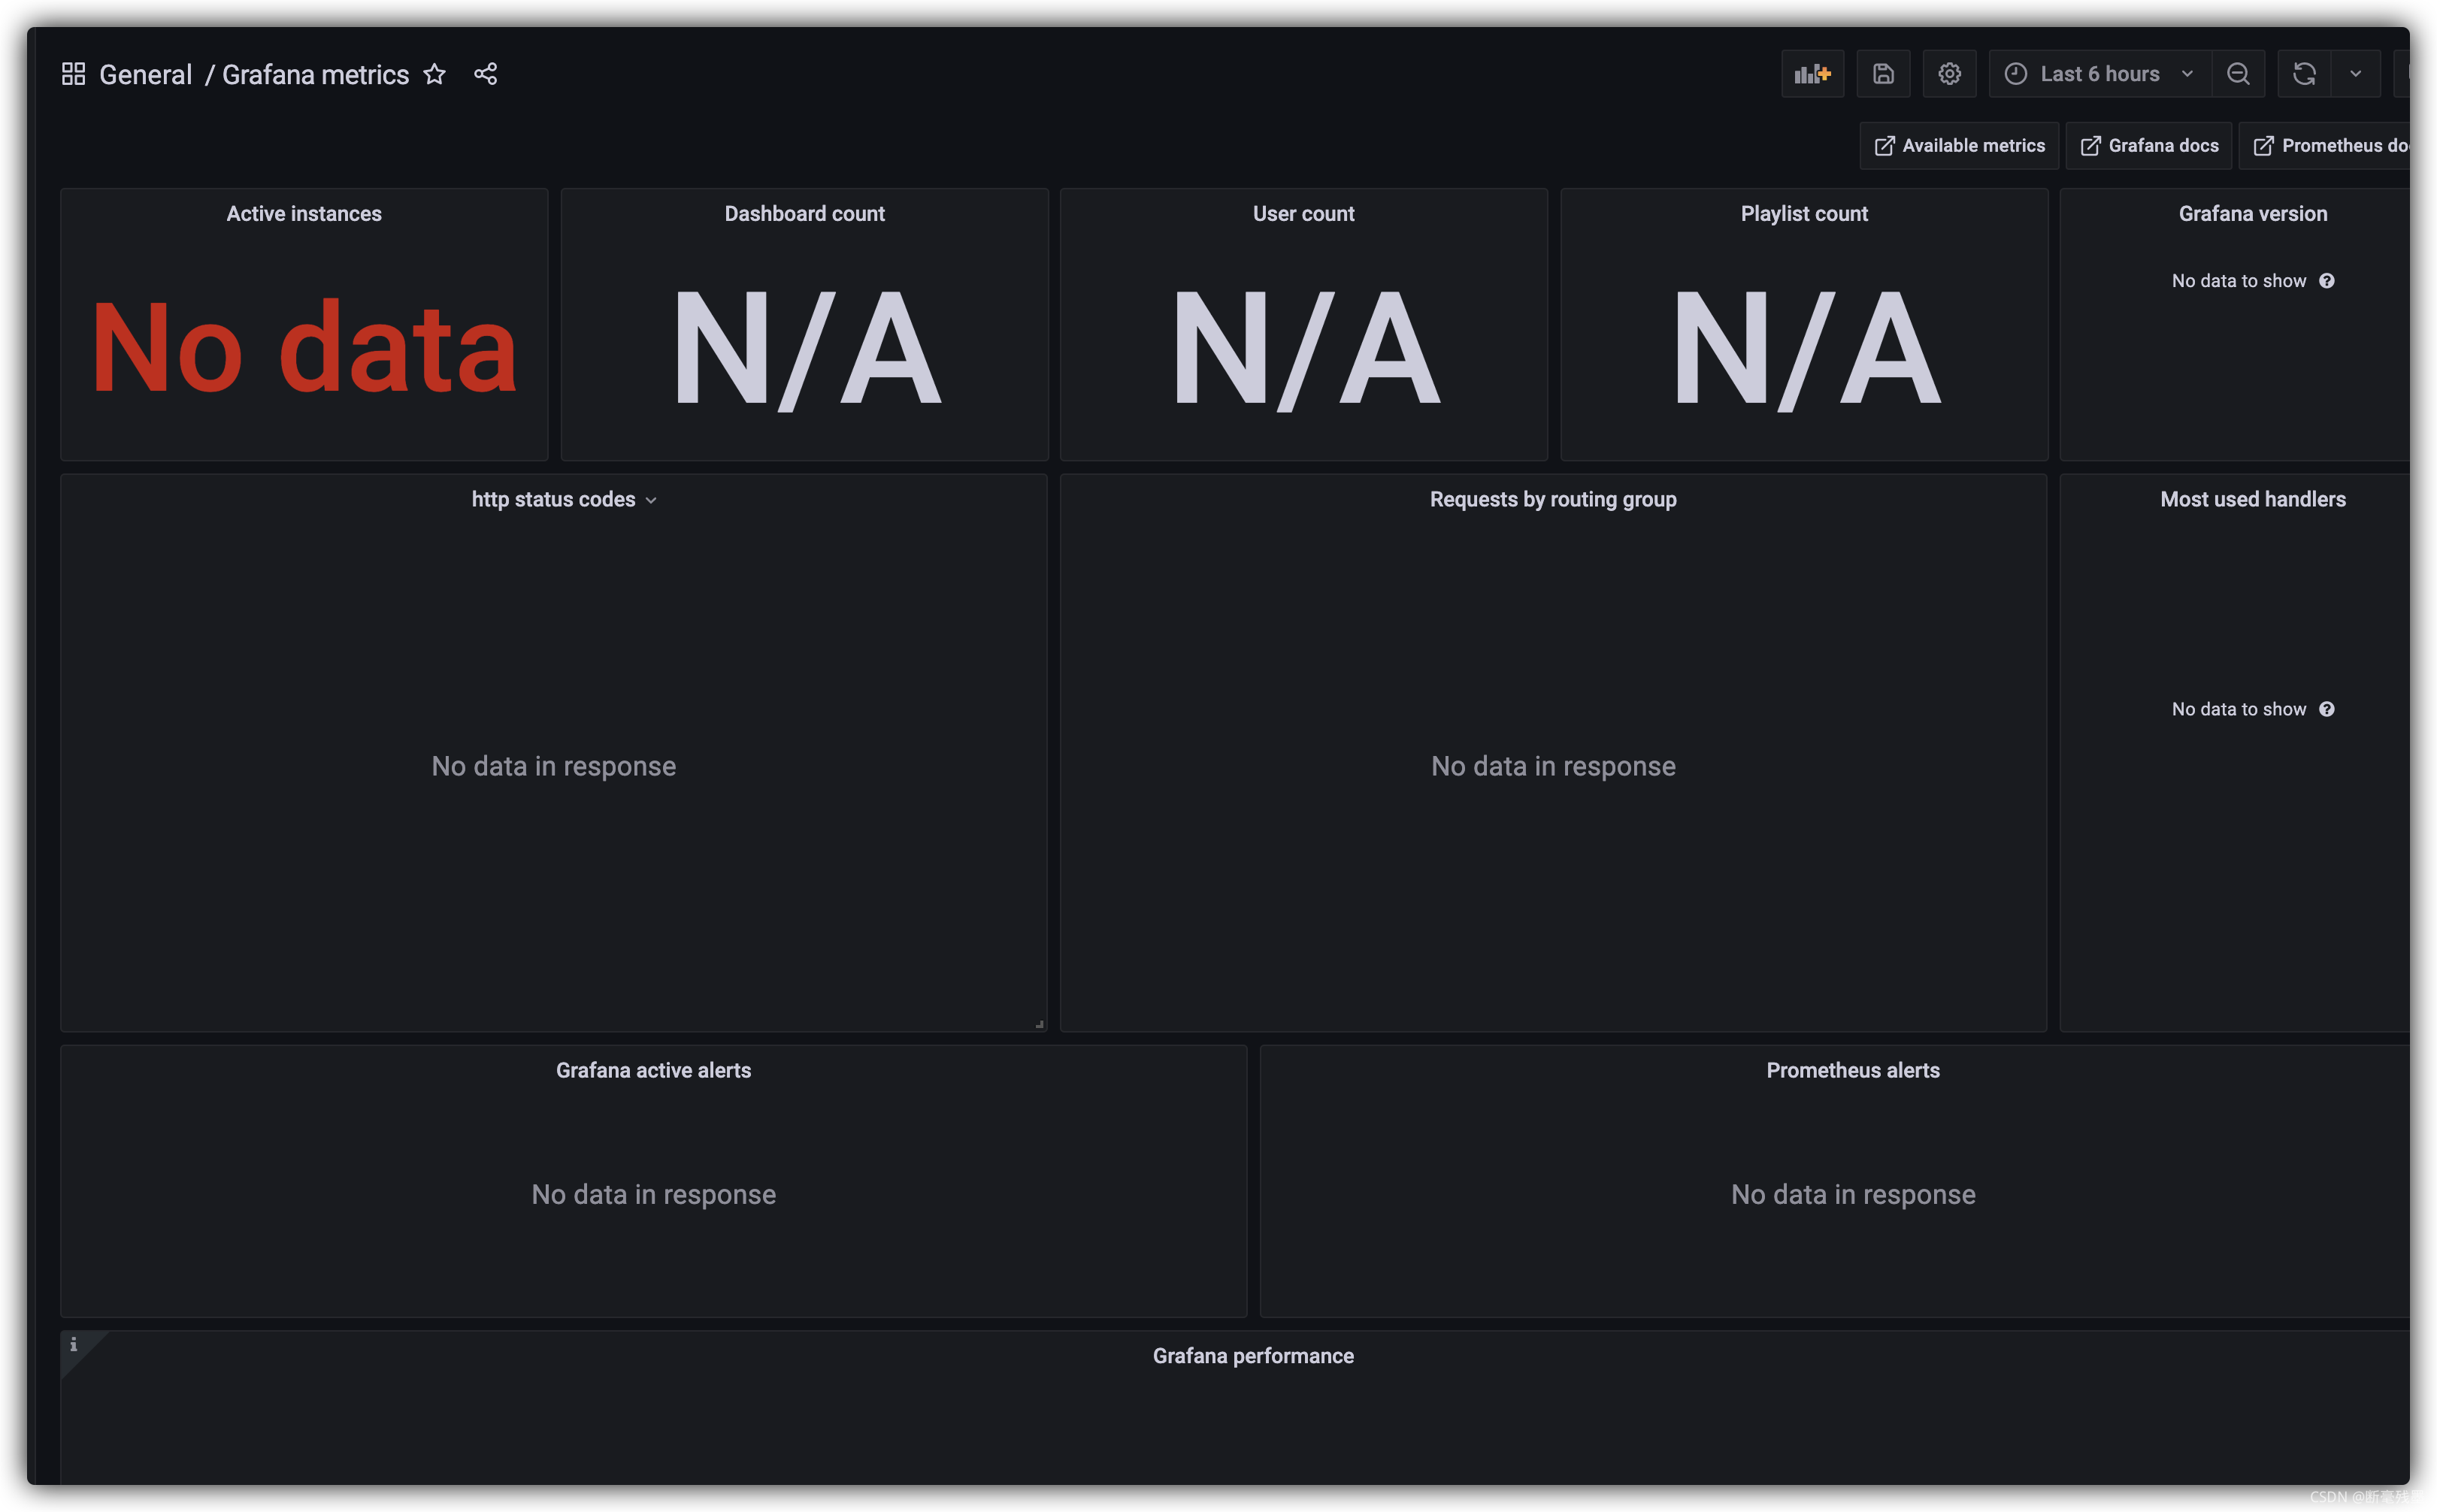
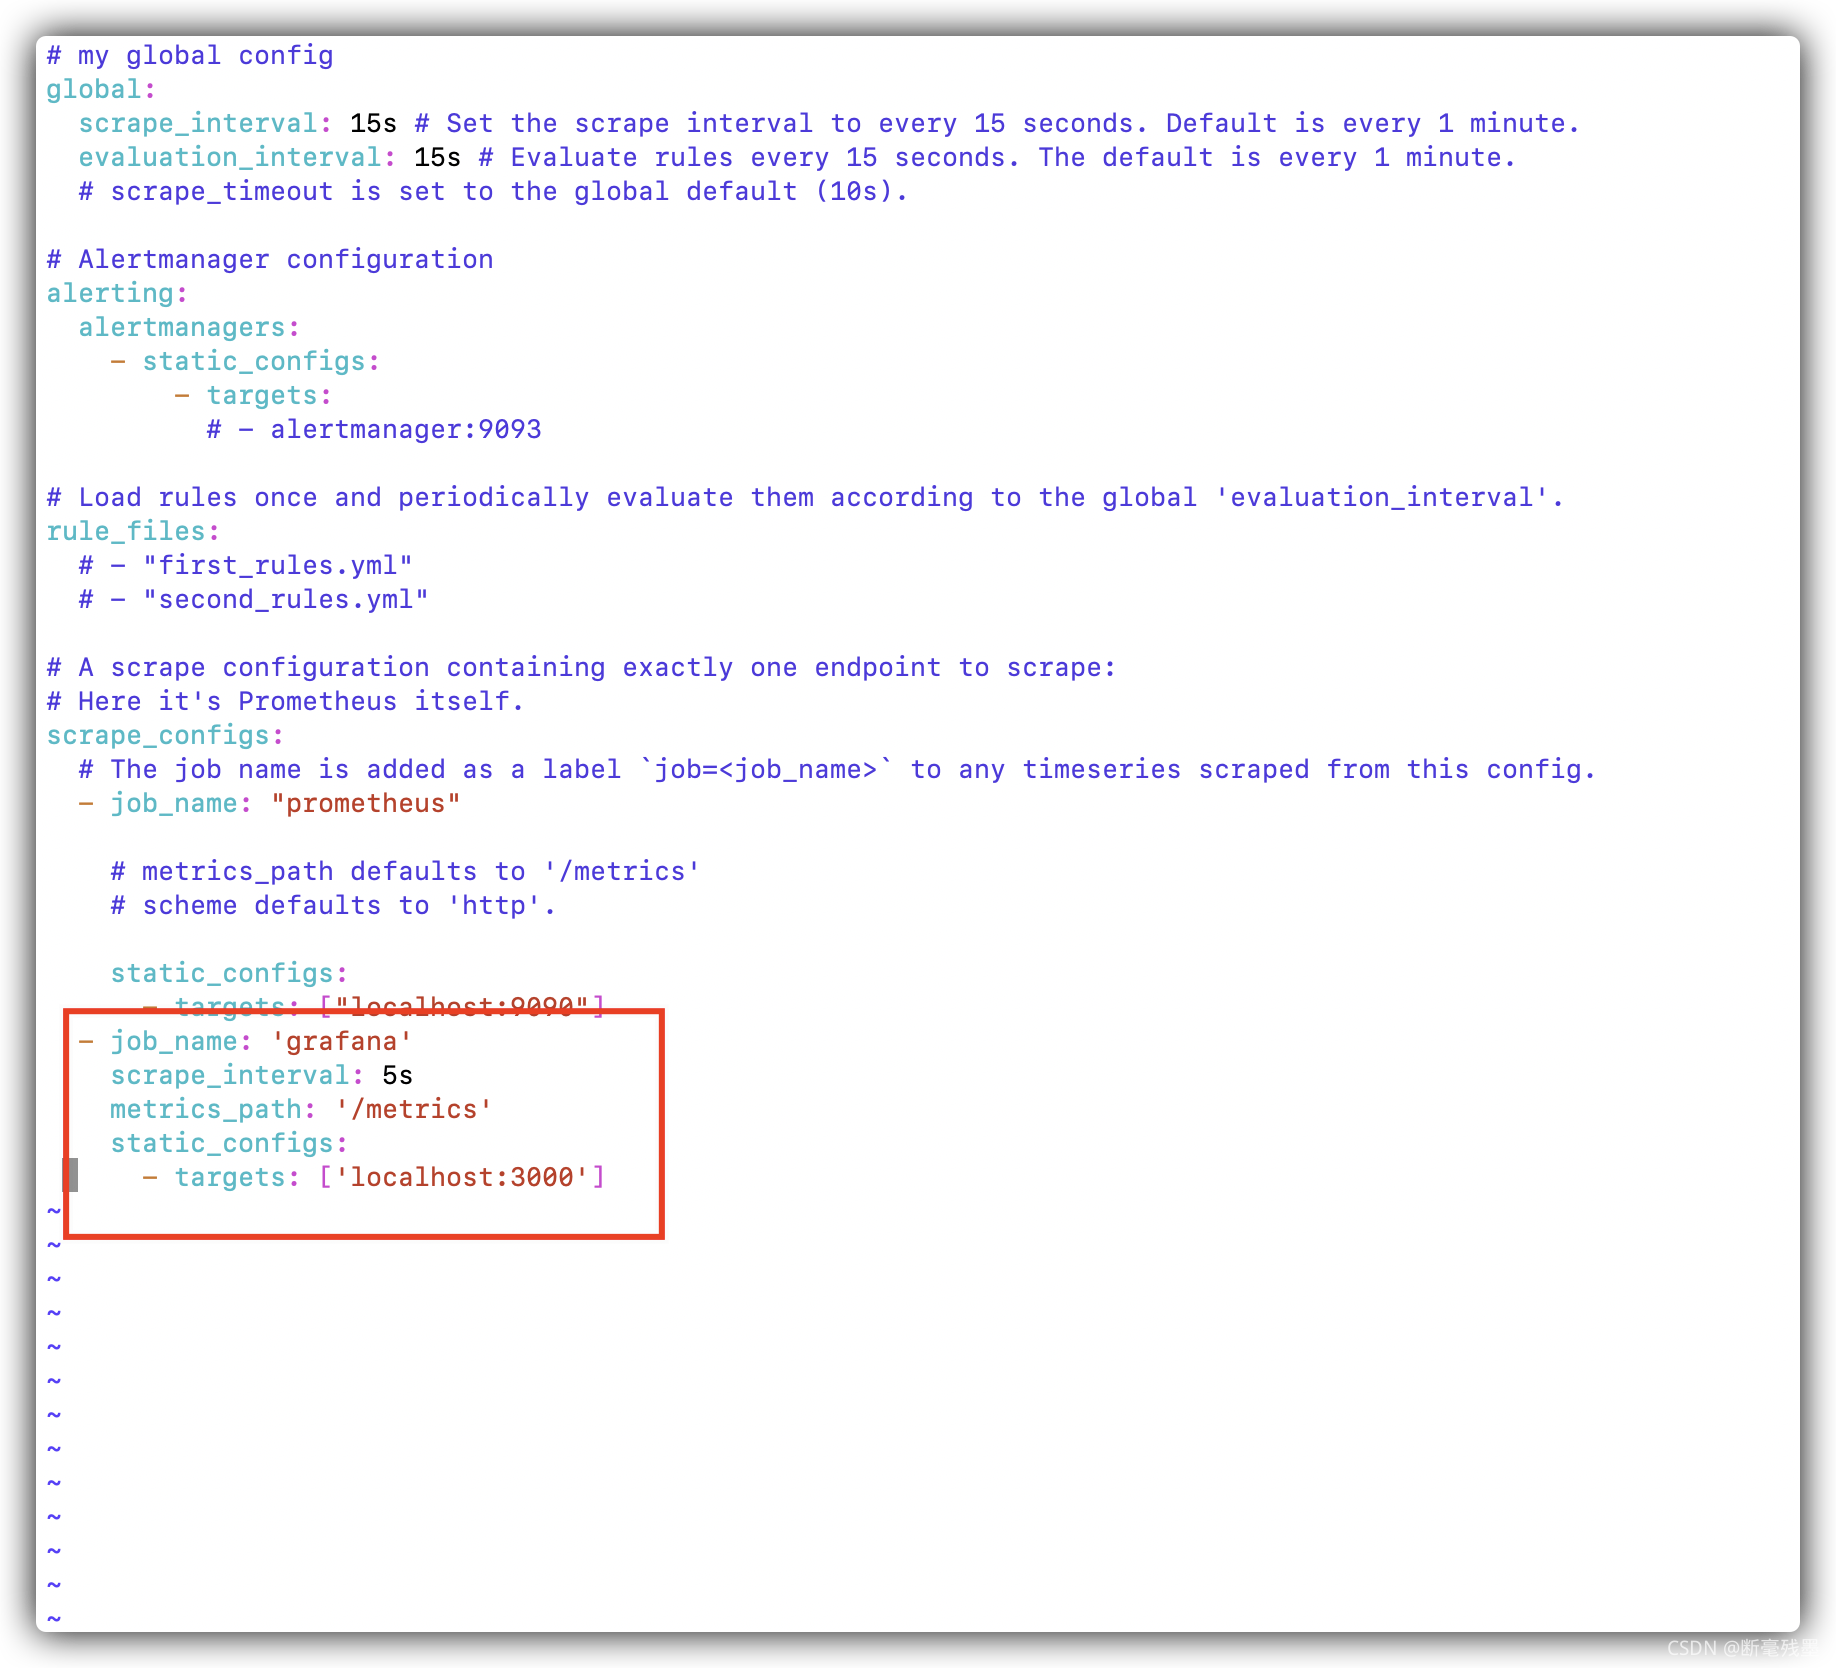
(8) 修改 prometheus.yml
vi prometheus.yml在scrape_configs里面添加以下配置
- job_name: 'grafana'
    scrape_interval: 5s
    metrics_path: '/metrics'
    static_configs:
      - targets: ['localhost:3000']
如下
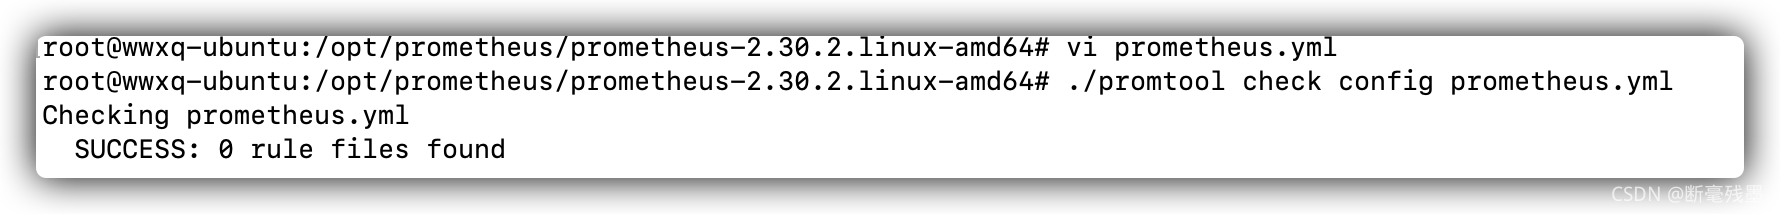
检查prometheus.yml是否正确
./promtool check config prometheus.yml
(9) 重启prometheus
ps -ef | grep prometheus | grep -v grep
kill pid
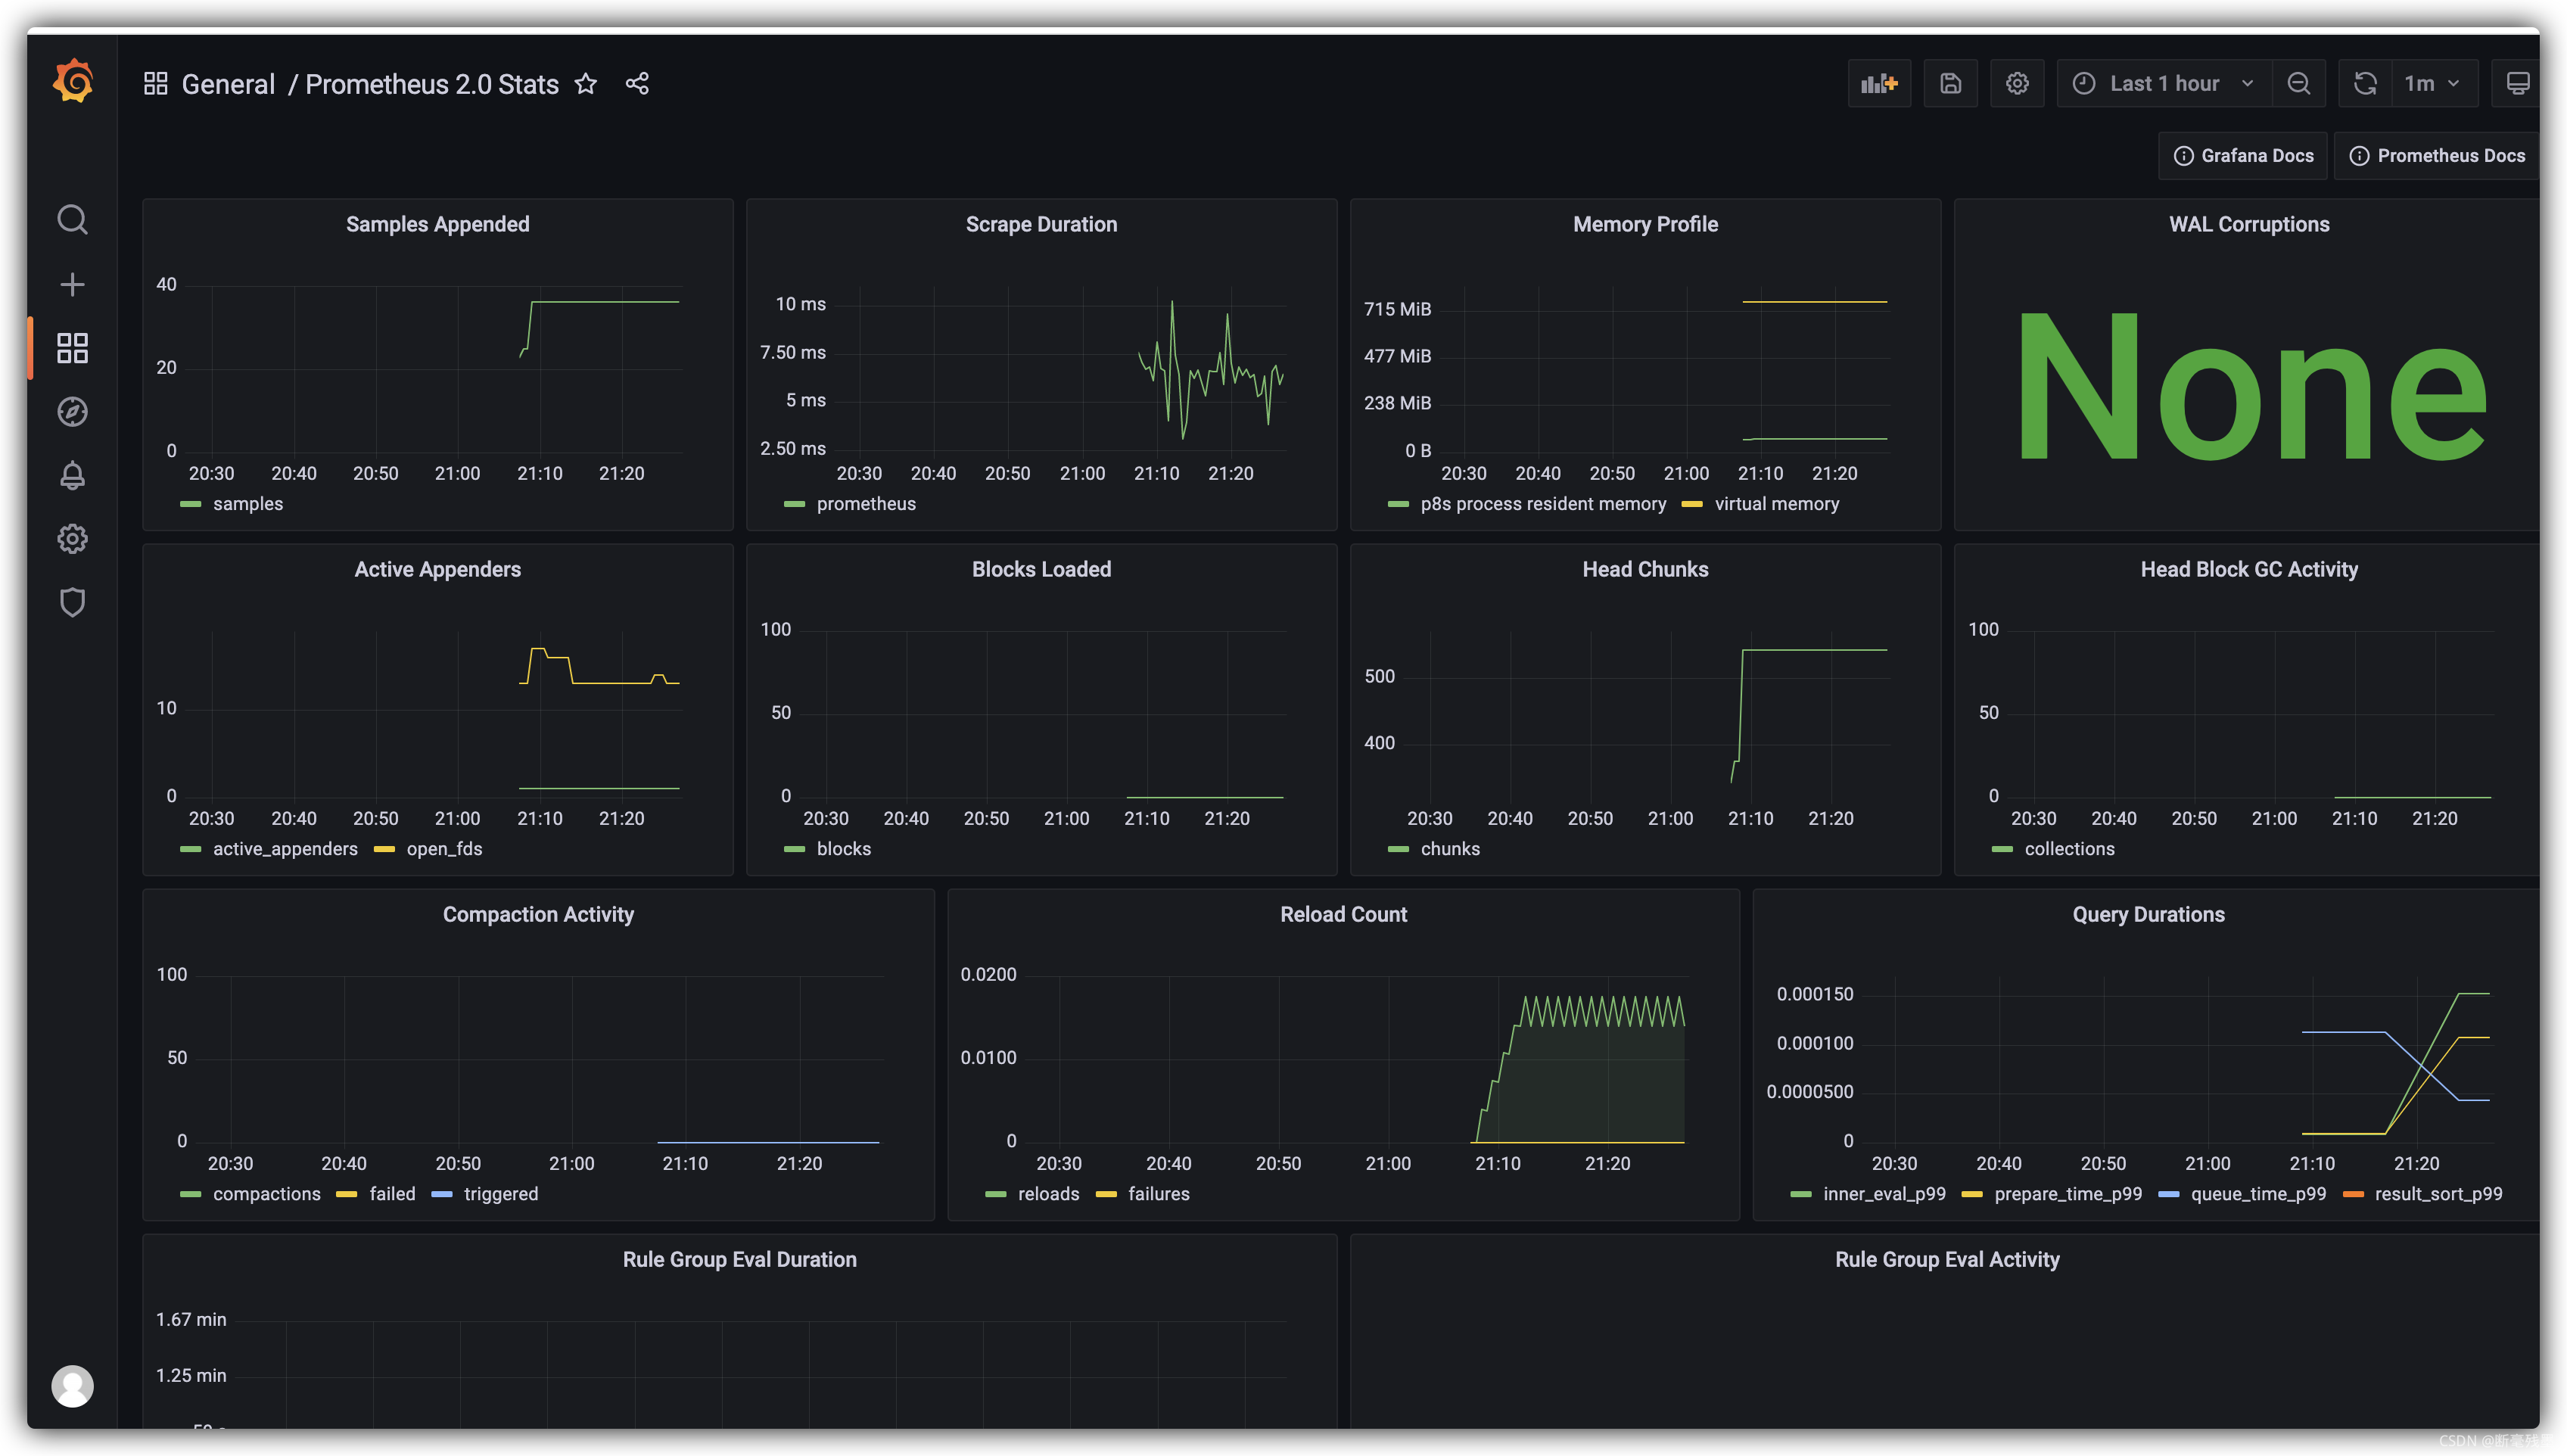
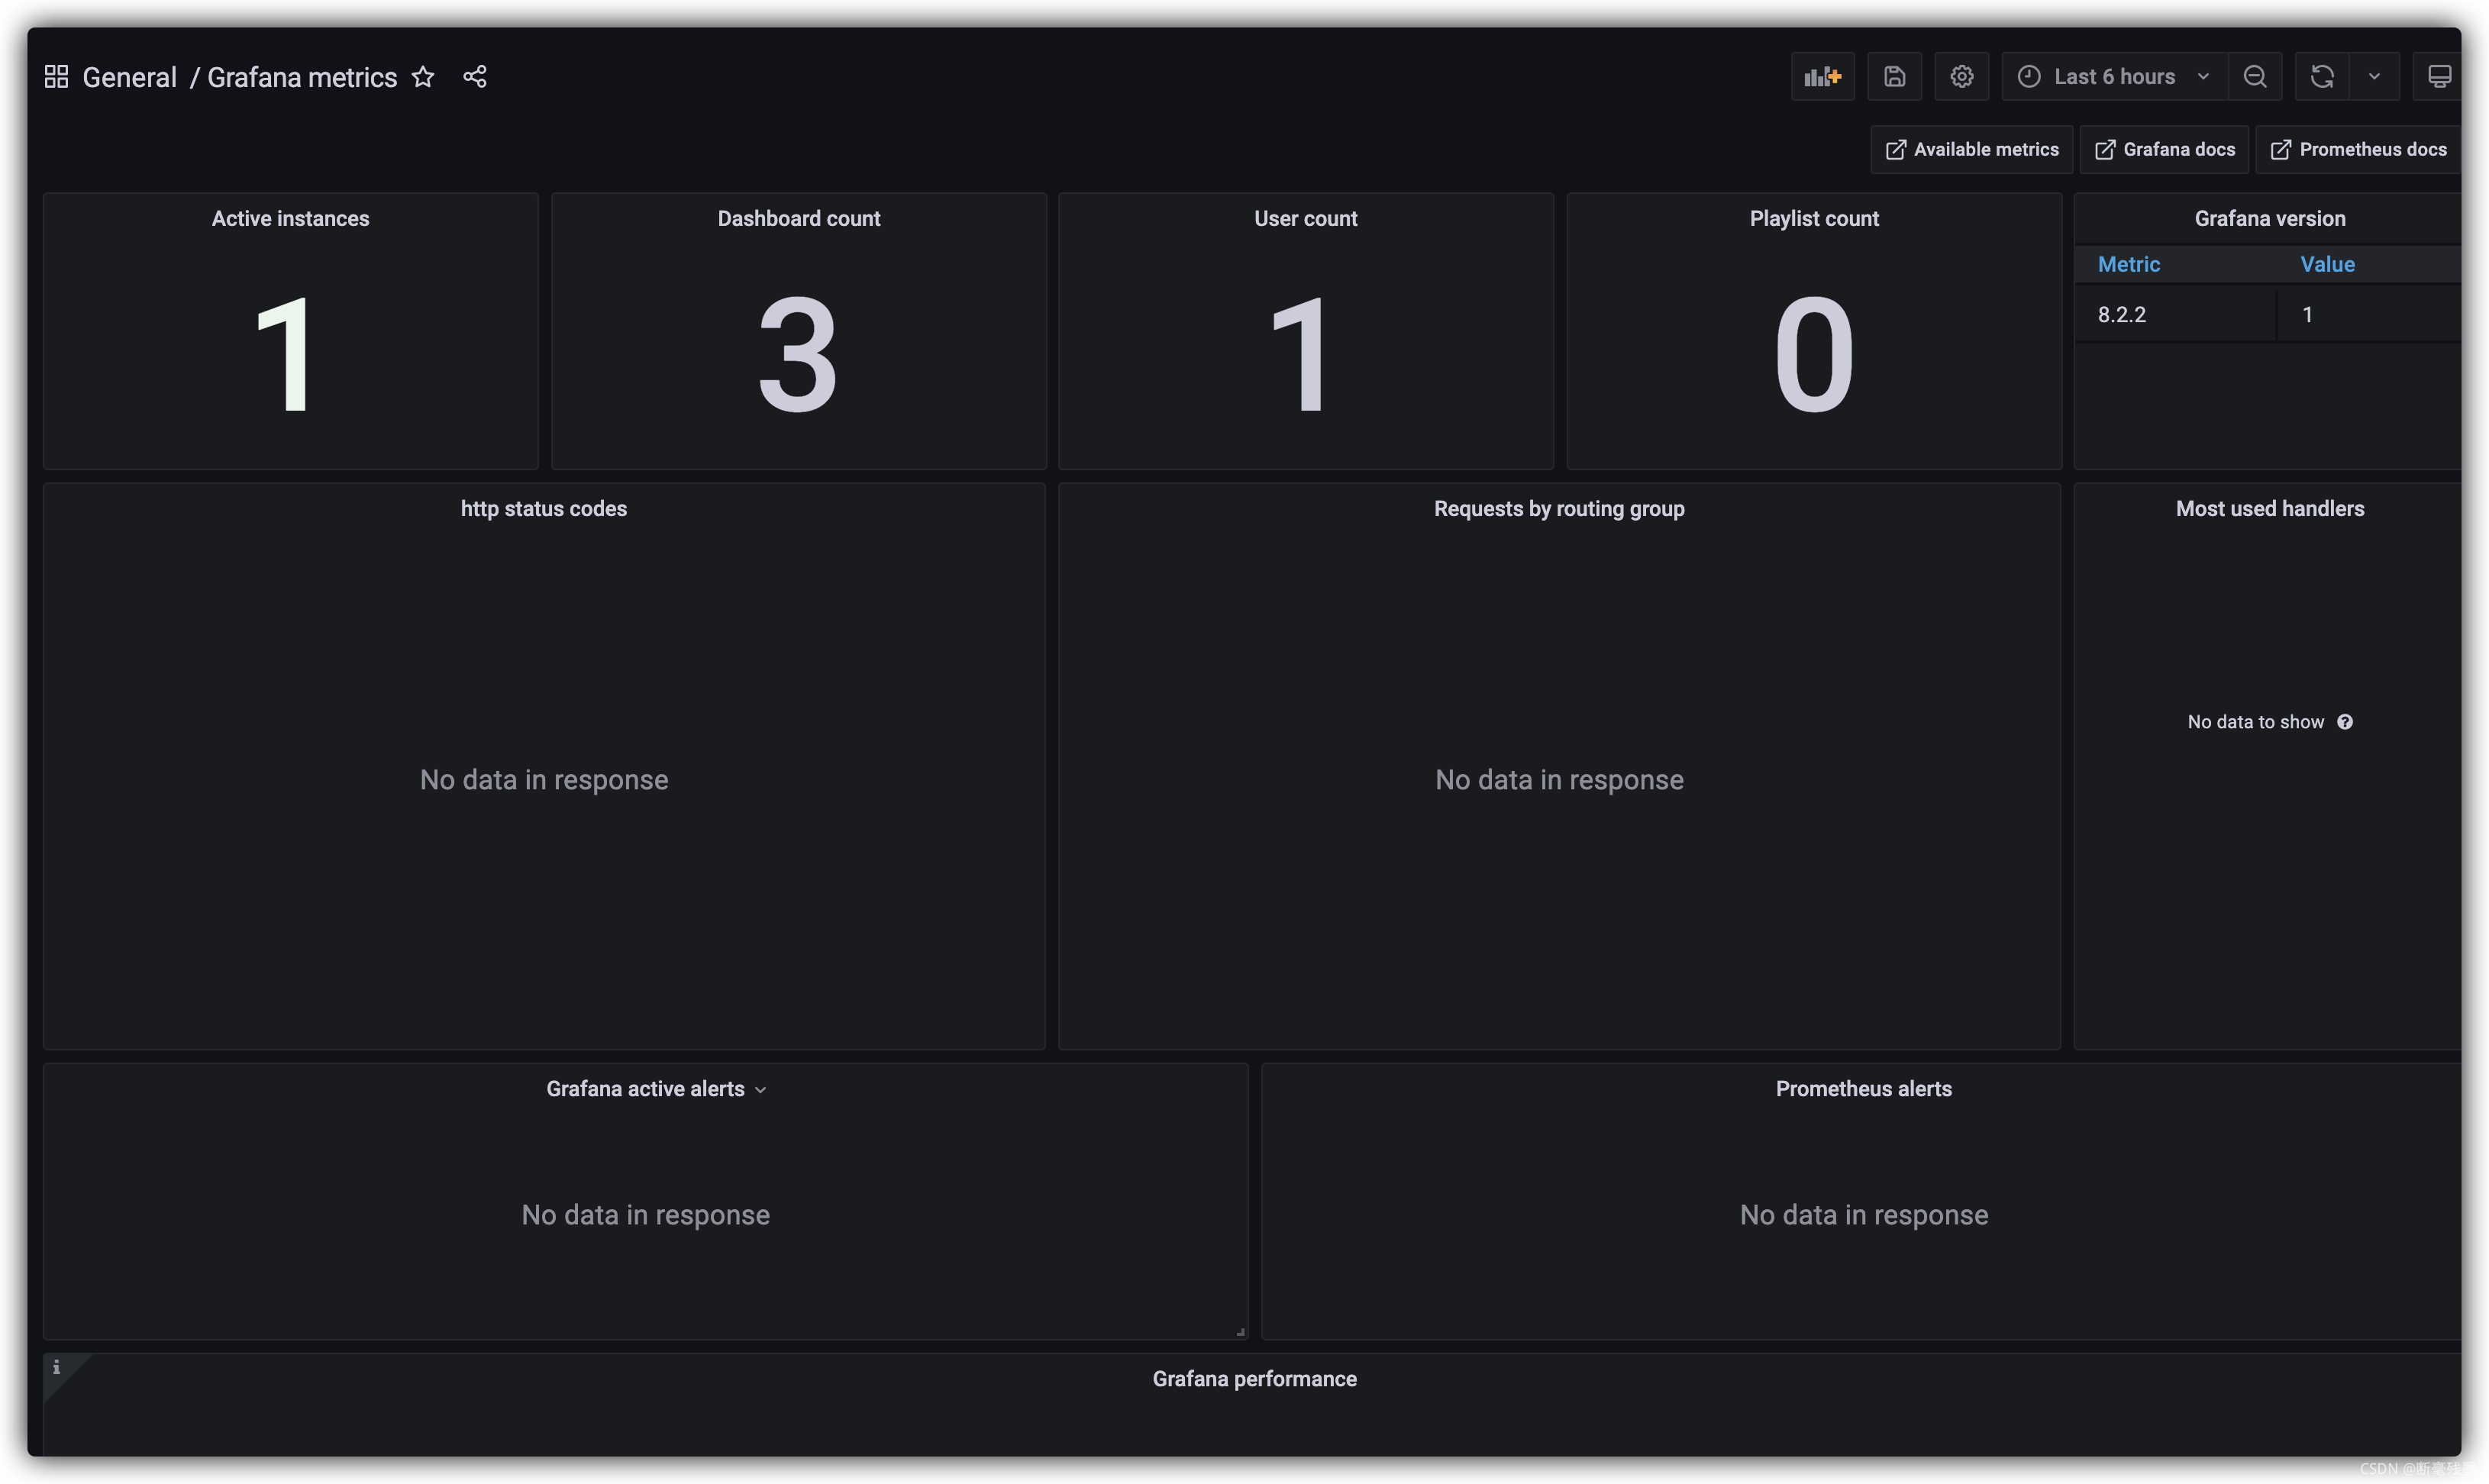
nohup ./prometheus --config.file="prometheus.yml" > prometheus.log 2>&1 &(10) 再次查看 grfana的仪表板就有数据了
8. 安装node_exporter监控主机
(1) 下载解压
wget https://github.com/prometheus/node_exporter/releases/download/v1.2.2/node_exporter-1.2.2.netbsd-amd64.tar.gz
tar -zxvf node_exporter-1.2.2.netbsd-amd64.tar.gz
(2) 启动
nohup ./node_exporter > node_exporter.log 2>&1 &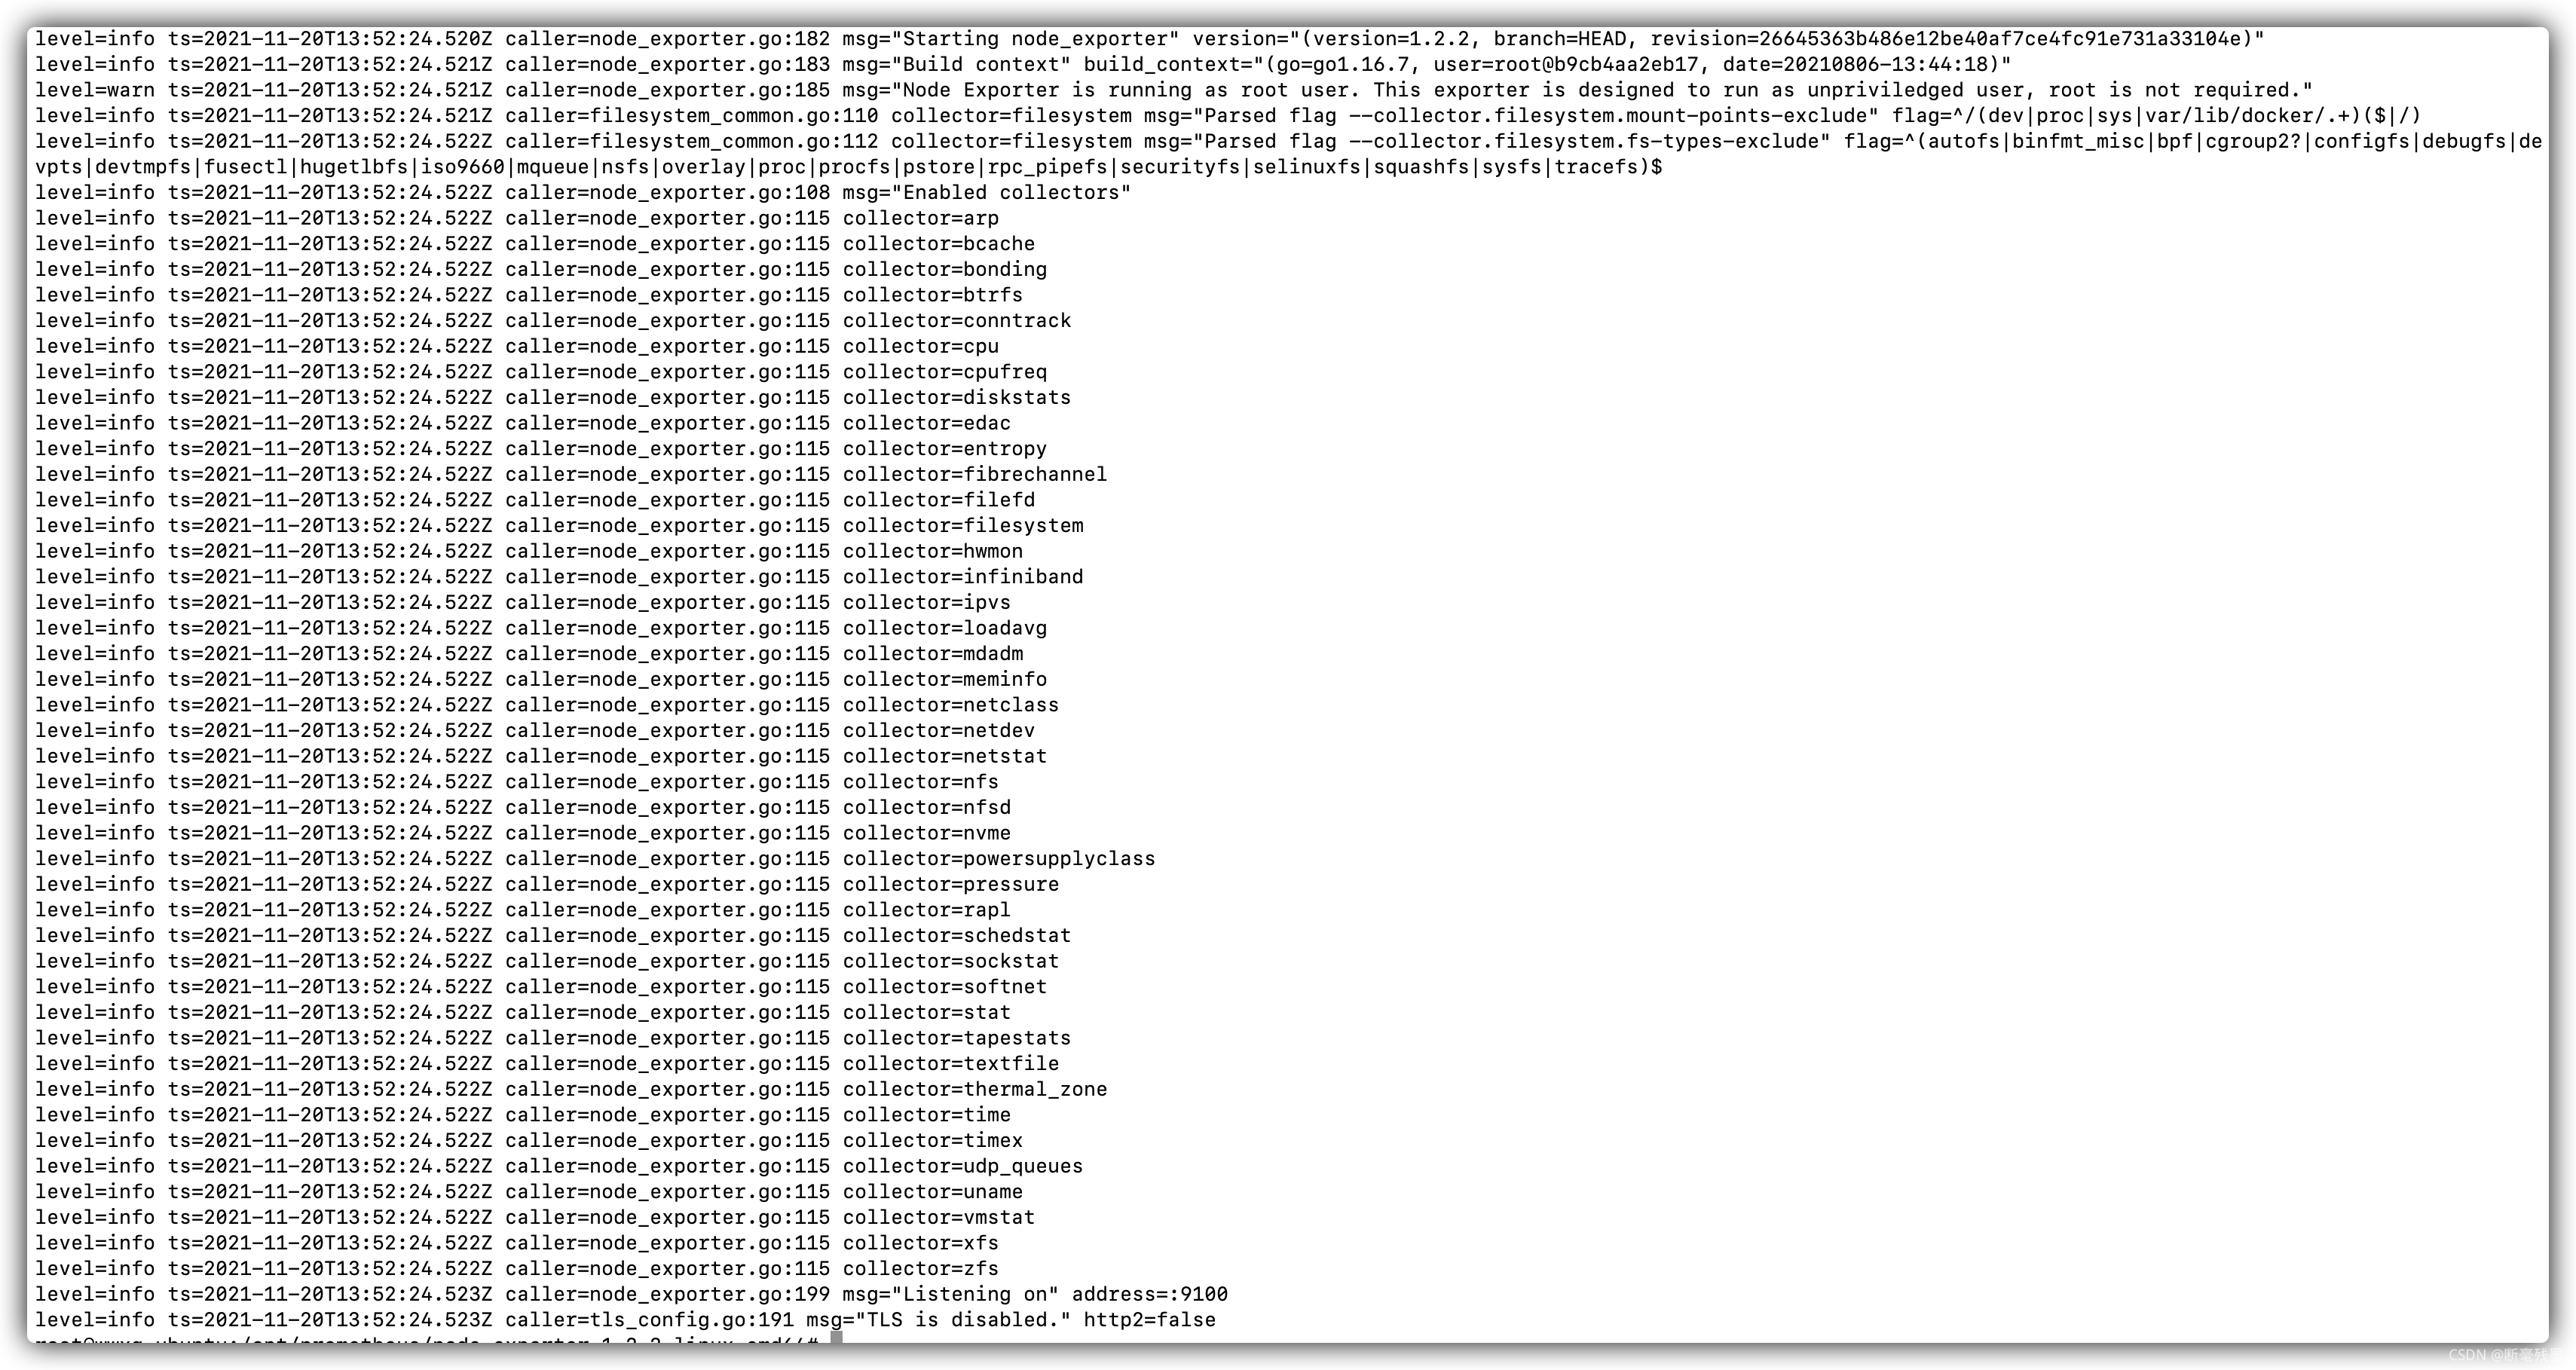 端口号9100 , 访问http://IP:9100
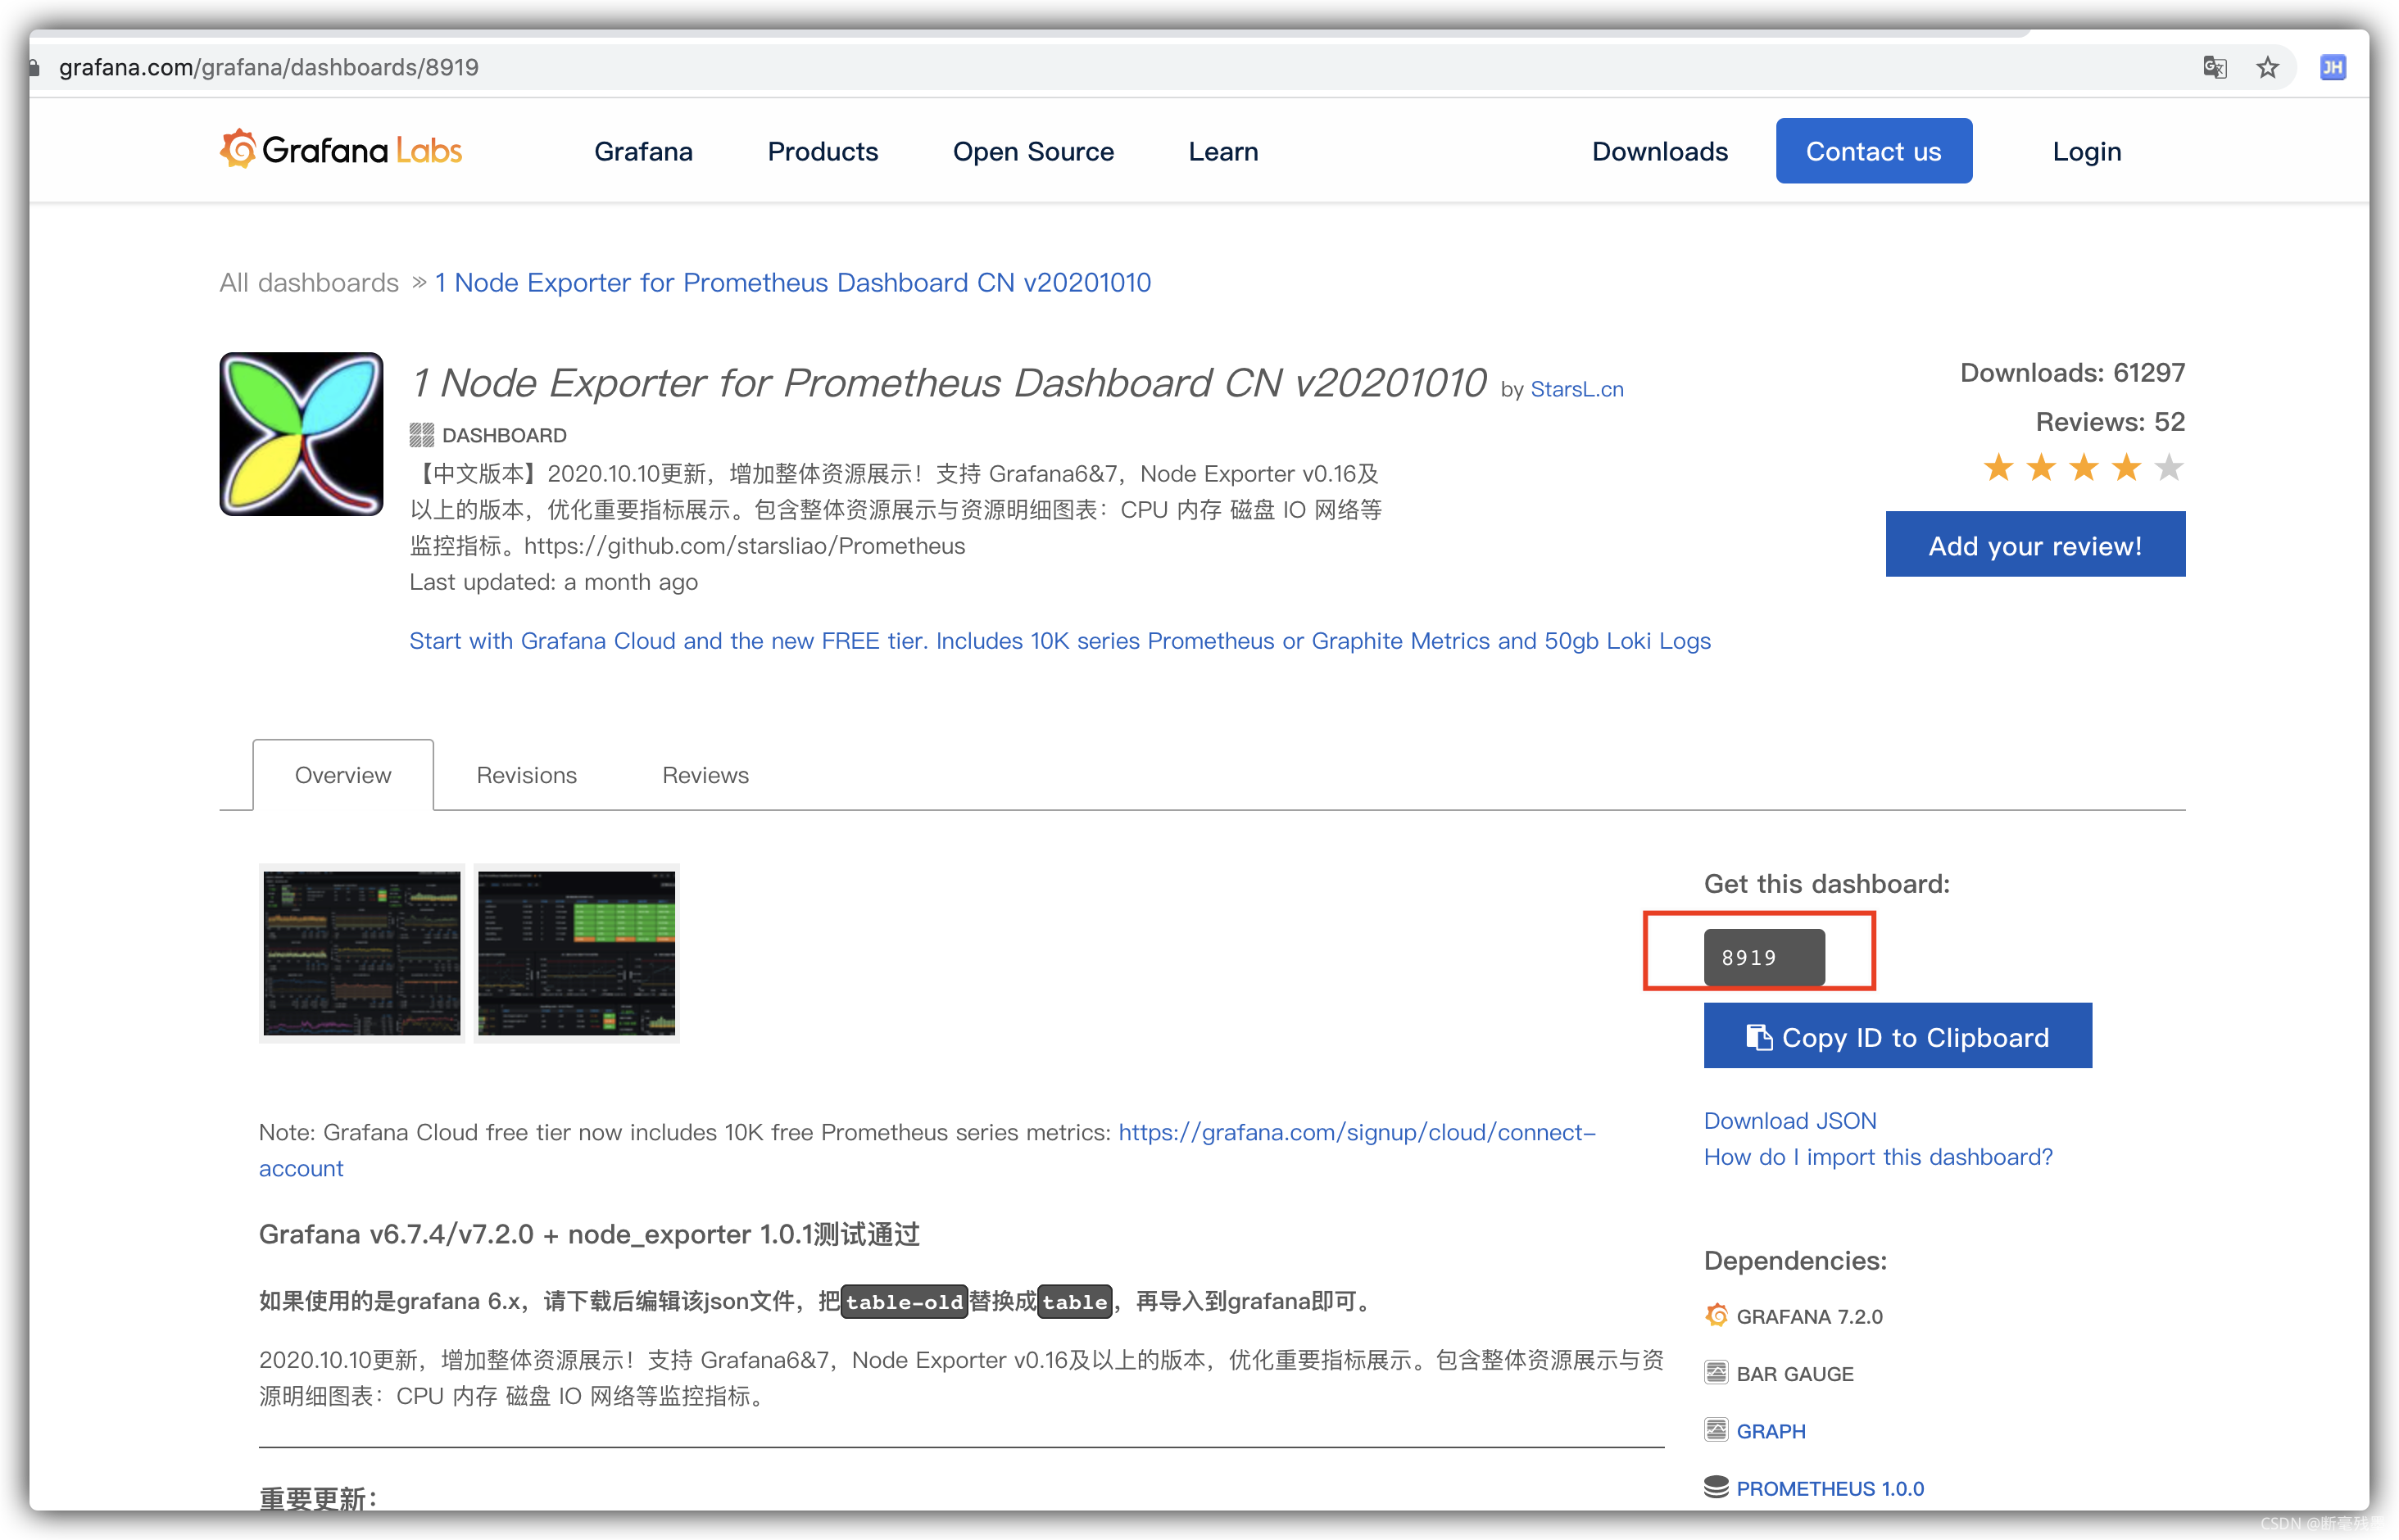
(3) 配置模板 打开Dashboards | Grafana Labs
搜索 node exporter,找到合适的模版复制他的id, 这里推荐一个 id为 8919
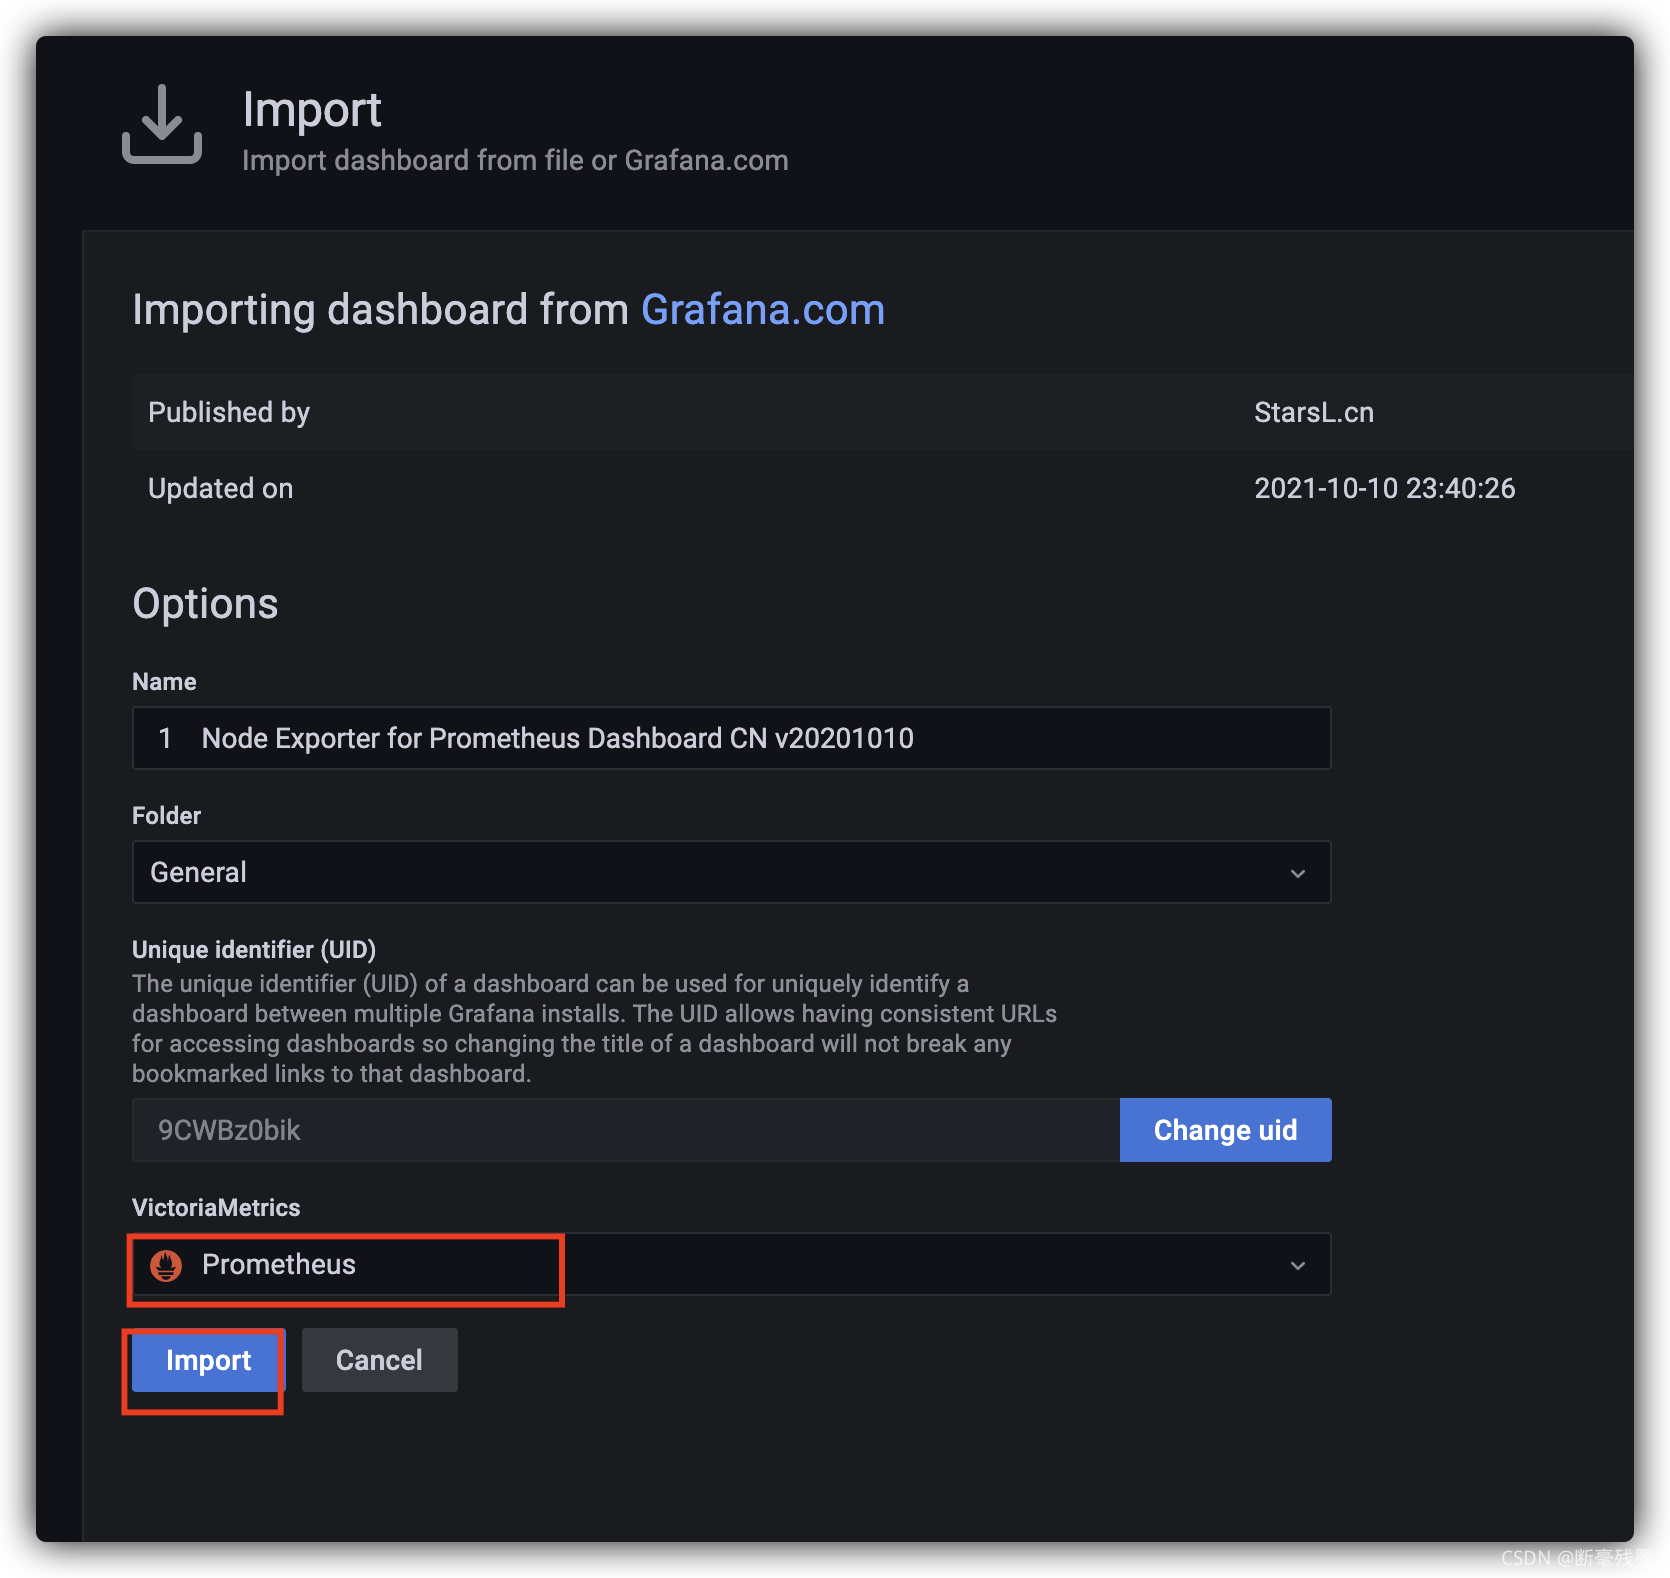
(4) 导入模版
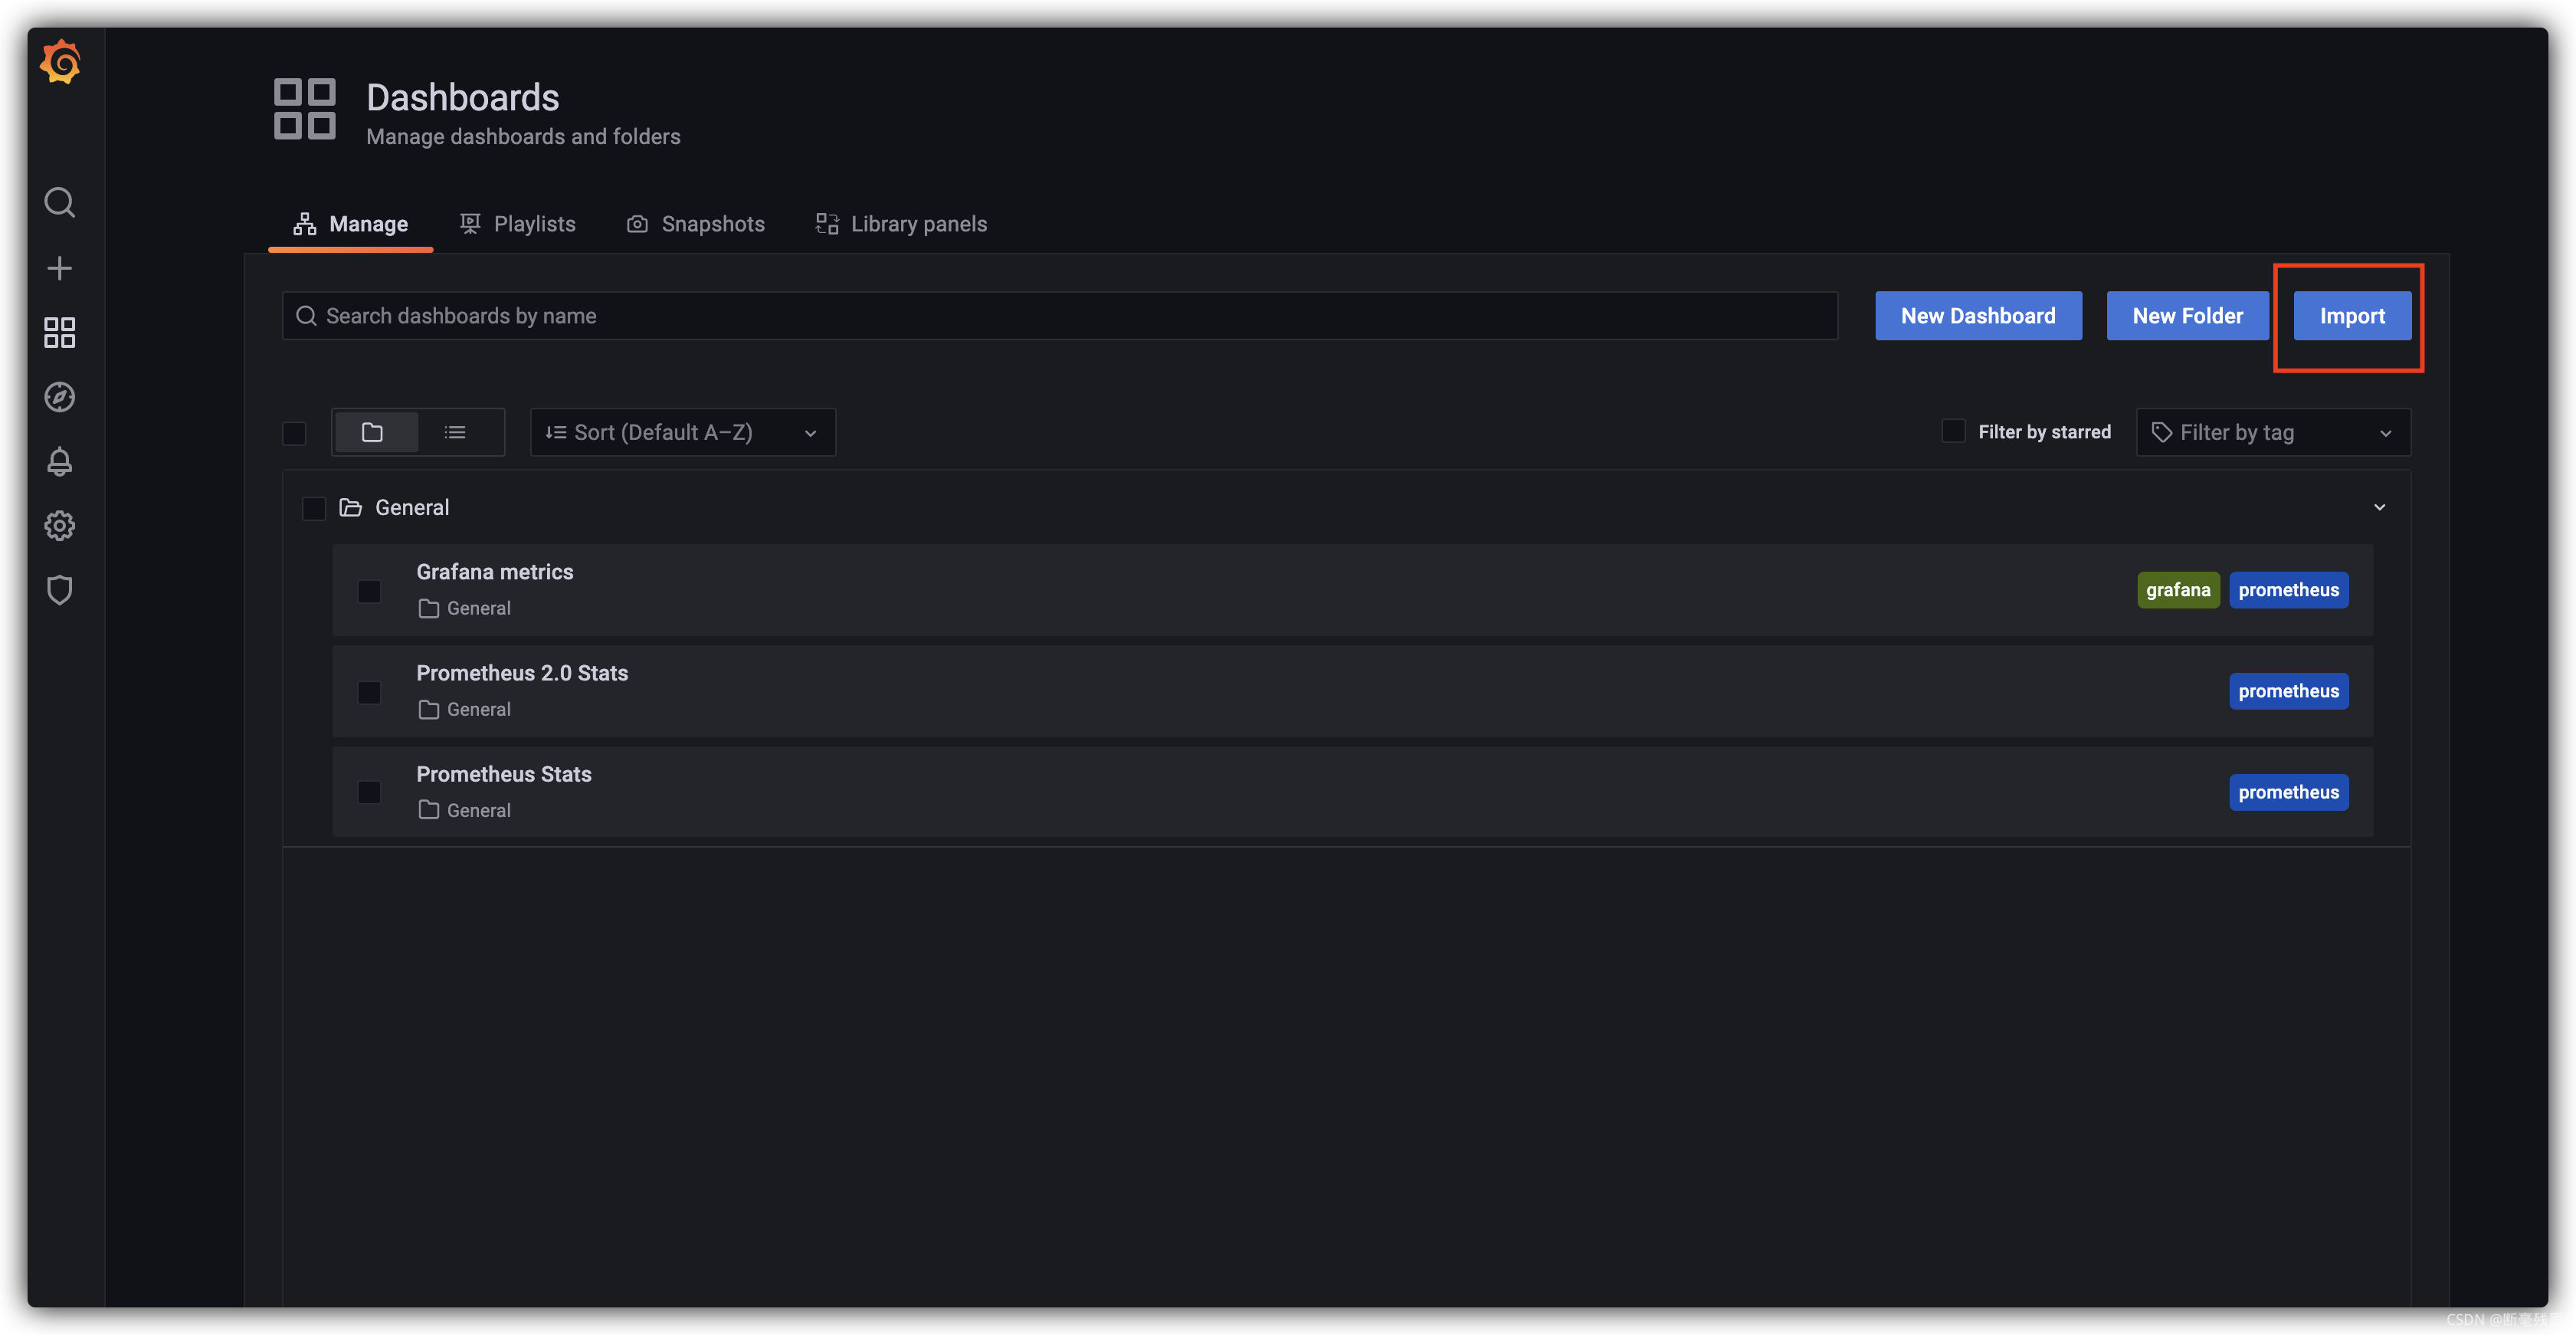
输入id 点击 Load 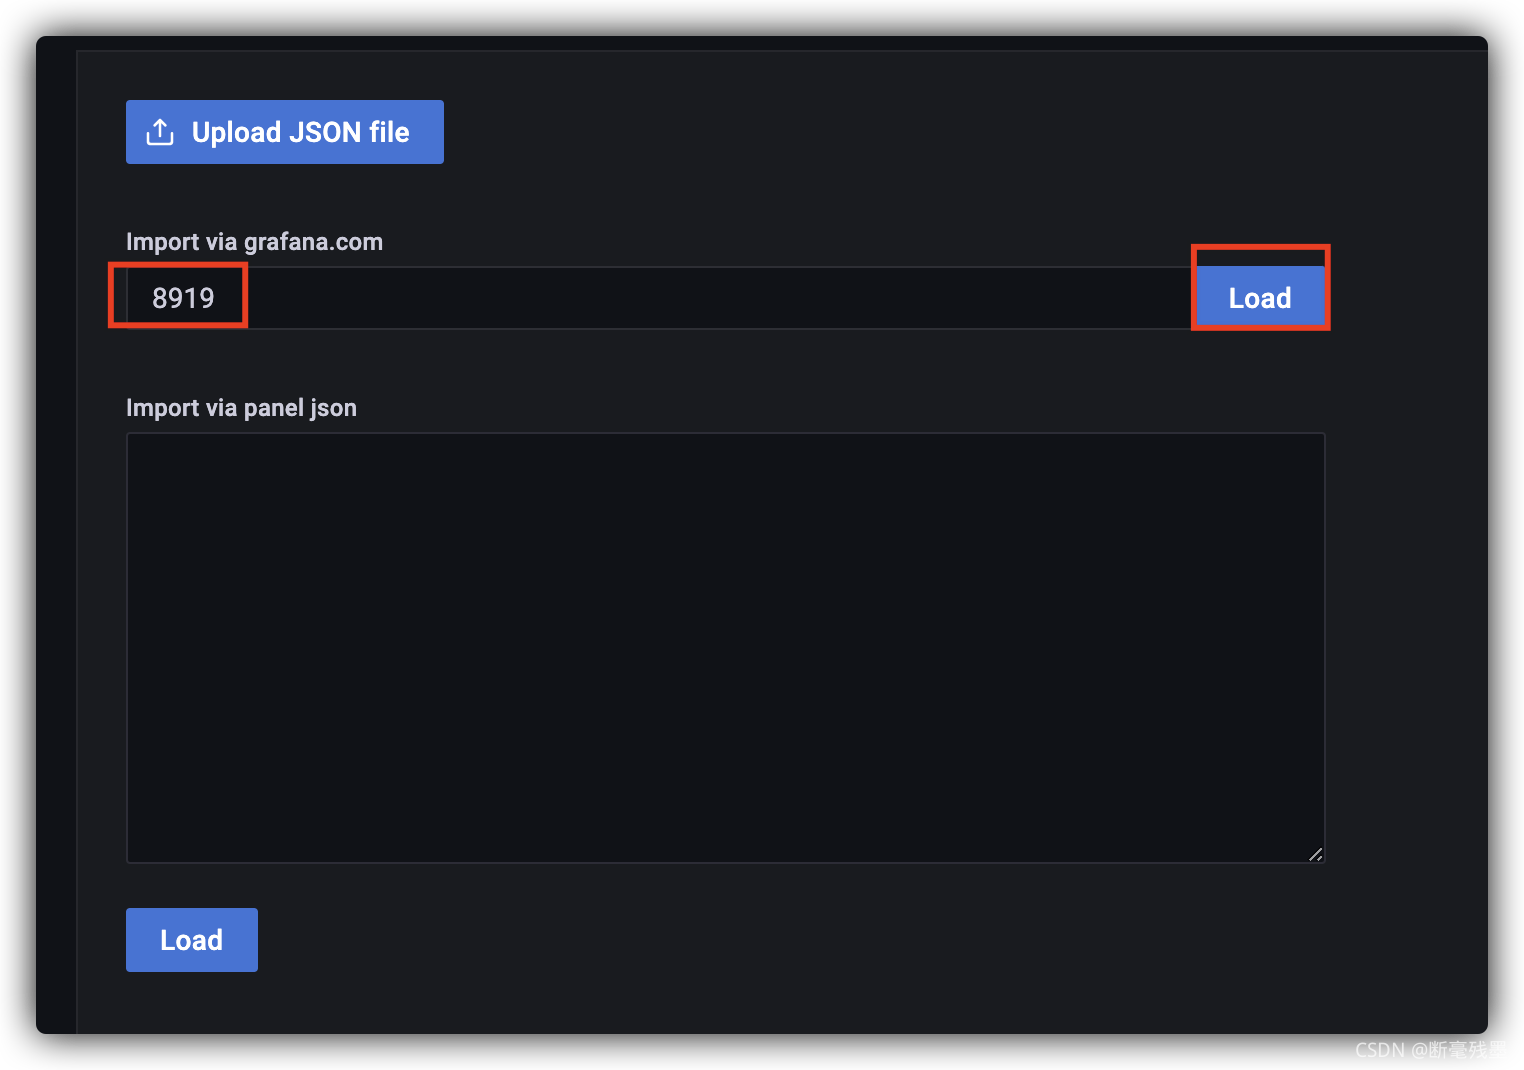
选择一个数据源点击 Import
(5) 出现一下,说明配置成功,如果不显示数据,可以是版本不匹配,需要查找其他模板或者需要手动修改模版的配置 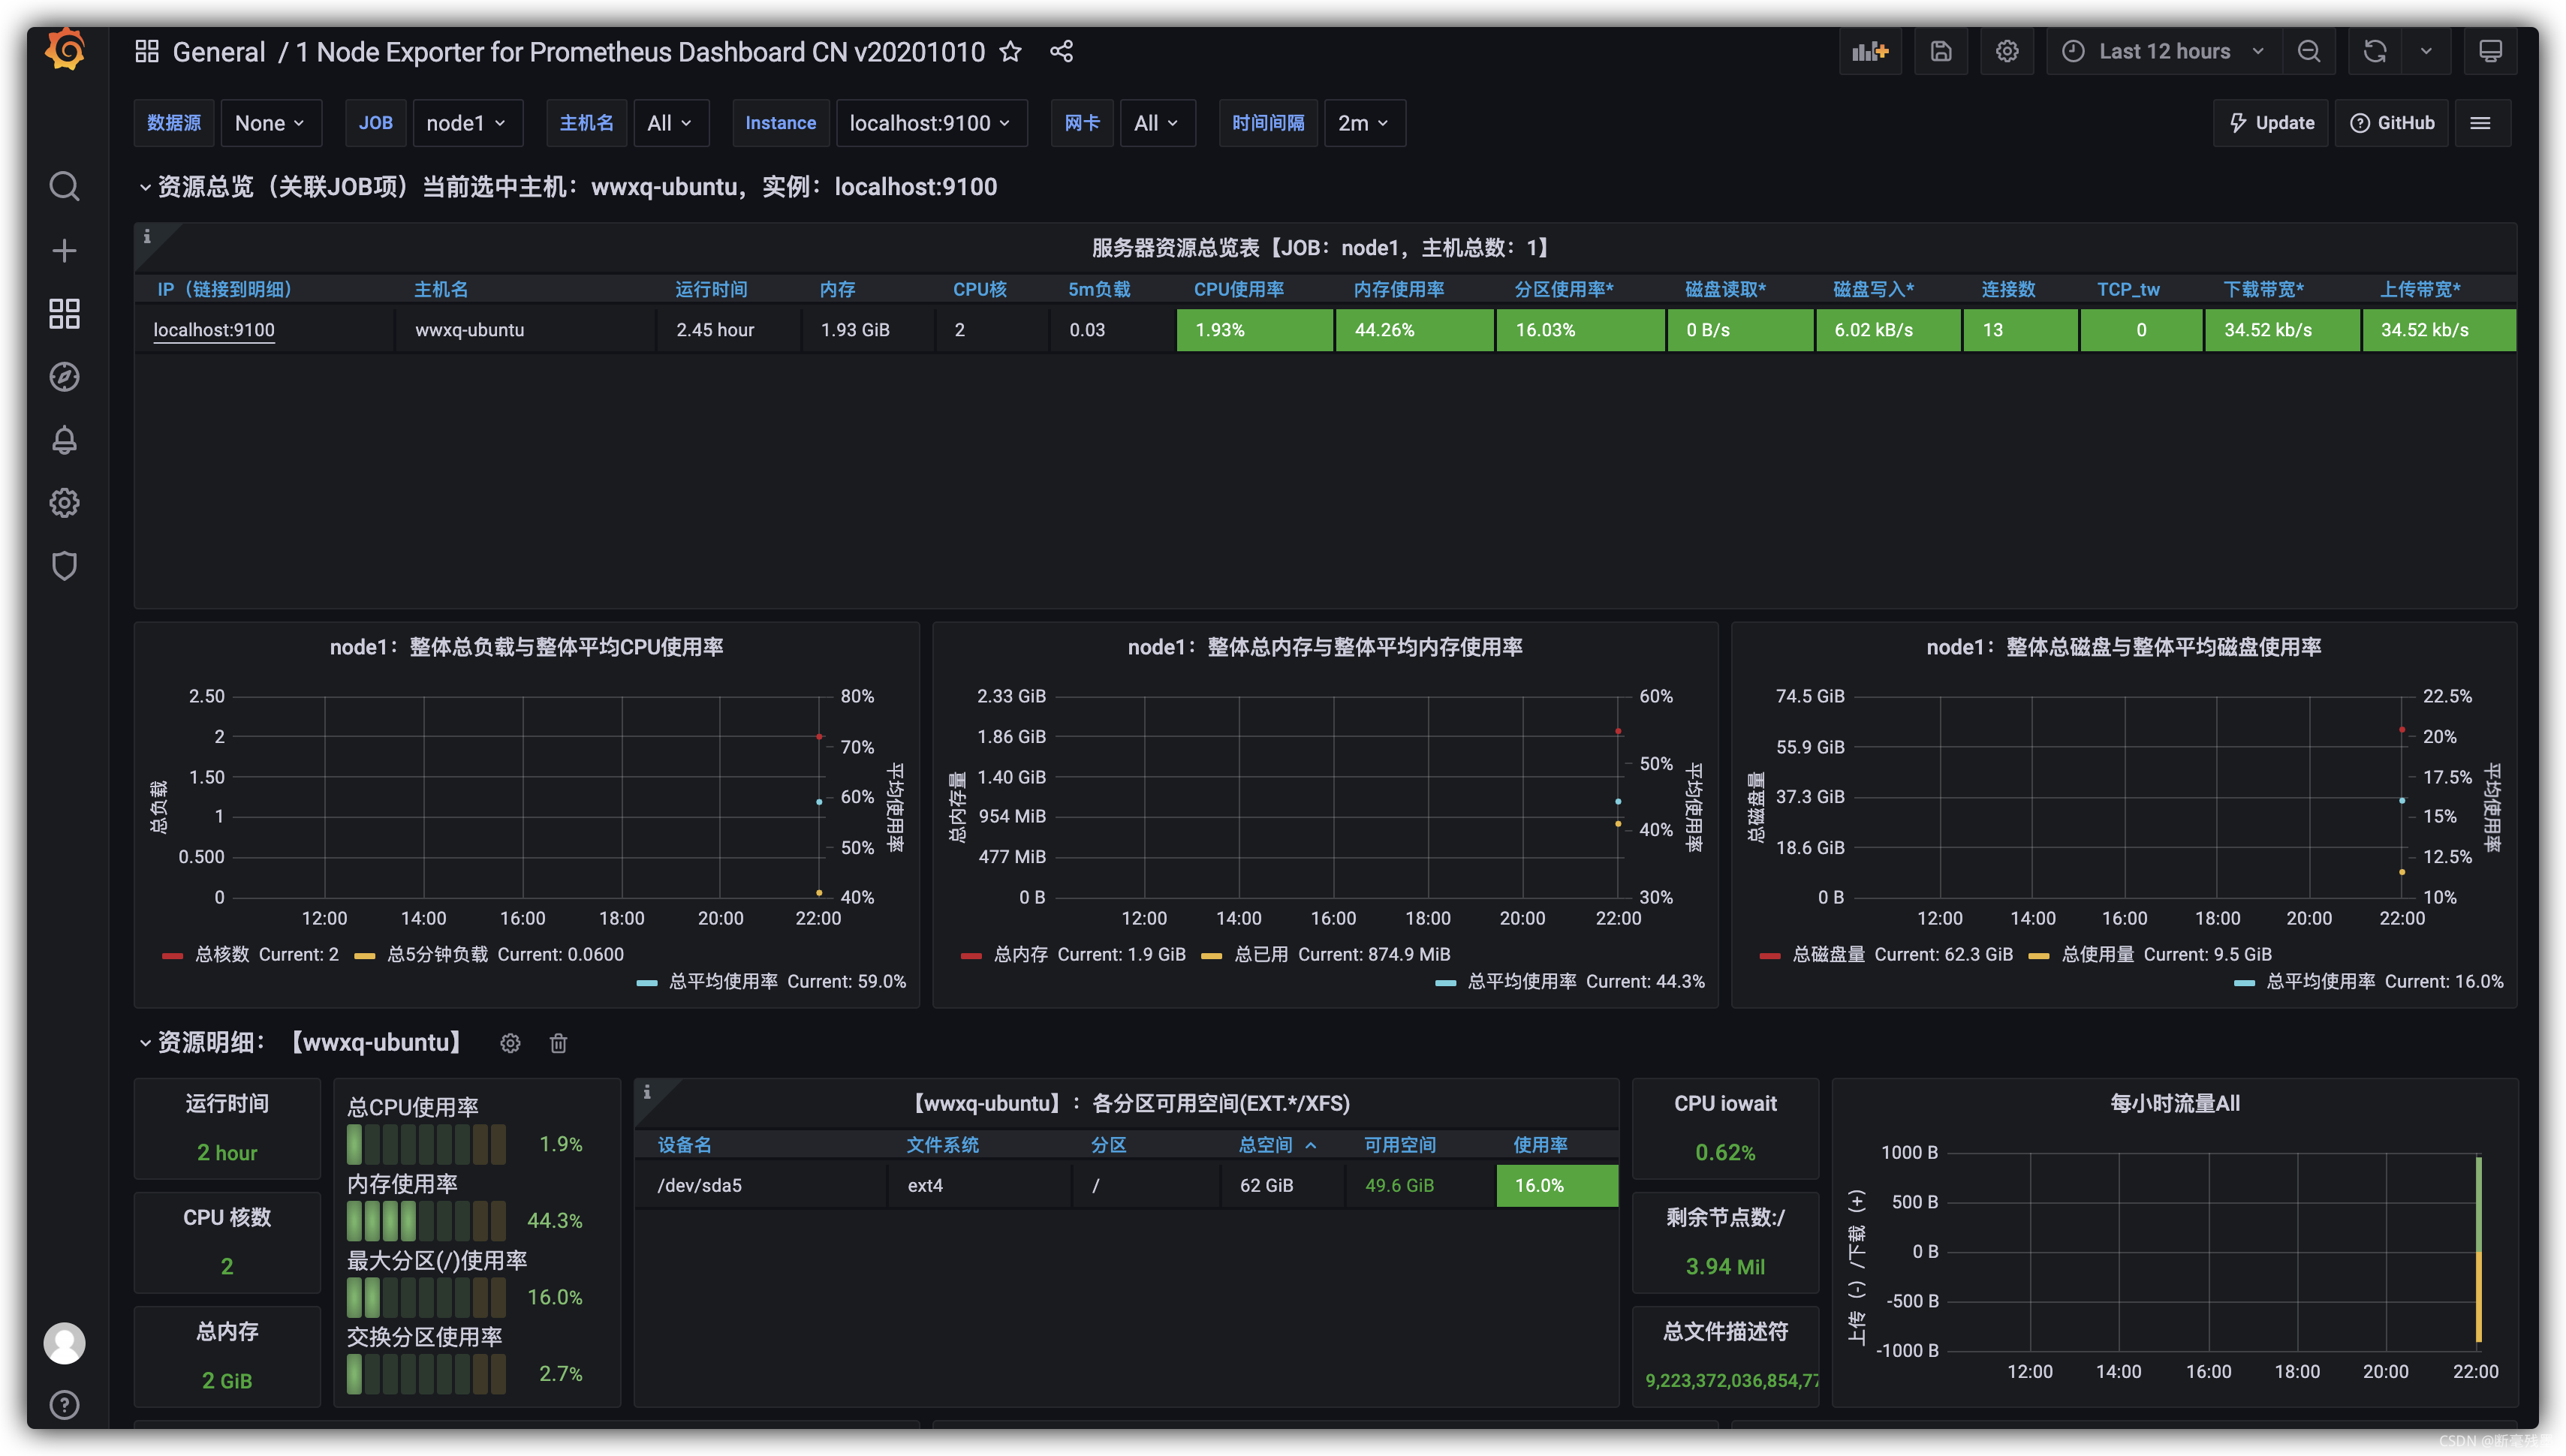


 1467
1467

 被折叠的 条评论
为什么被折叠?
被折叠的 条评论
为什么被折叠?
 到【灌水乐园】发言


