


ELK日志分析系统
一、ELK日志分析系统简介
(一)日志服务器
- 提高安全性
- 集中存放日志
- 缺点:对日志的分析困难
(二)ELK日志分析系统组成
- Elasticsearch
- Logstach
- Kibana
- 日志处理步骤
- 将日志进行集中化管理
- 将日志格式化(Logstash)并输出到Elasticsearch
- 对格式化后的数据进行索引和存储(Elasticsearch)
- 前端数据的展示(Kibana)
-
Elasticsearch的概述
提供了一个分布式多用户能力的全文搜索引擎
-
Elasticsearch核心概念
-
接近实时
-
集群
-
节点
-
索引
索引(库)→类型(表)→文档(记录)
-
分片和副本
- Logstash介绍
- 一款强大的数据处理工具
- 可实现数据传输、格式处理、格式化输出
- 数据输入、数据加工(如过滤、改写等)
- LogStash主要组件
- Shipper
- Indexer
- Broker
- Search and Storage
- Web Interface
- Kibana介绍
- 一个针对Elasticsearch的开源分析及可视化平台
- 搜索、查看存储在Elasticsearch索引中的数据
- 通过各种图表进行高级数据分析及展示
- Kibana主要功能
- Elasticsearch无缝之集成
- 整合数据,复杂数据分析
- 让更多团队成员受益
- 接口灵活,分享更容易
- 配置简单,可视化多数据源
- 简单数据导出
二、ELK日志分析系统搭建实战
- 实验环境:VMware Workstation 15.5、Xshell 6、Centos7.6
- 软件包版本:elasticsearch-5.5.0、logstash-5.5.1、kibana-5.5.1、elasticsearch-head.tar、node-v8.2.1、phantomjs-2.1.1
- 实验虚拟机IP分配:
| 设备名/作用 | IP |
|---|---|
| node1:elasticsearch、elasticsearch-head | 192.168.50.133 |
| node2:elasticsearch、logstash、kibana | 192.168.50.134 |
- 实验步骤:
1、为各台设备设置主机名并在host文件中添加主机名解析
hostnamectl set-hostname node1    ## 节点1
hostnamectl set-hostname node2    ## 节点2

编辑host文件:vim /etc/hosts
添加:
192.168.50.133 node1
192.168.50.134 node2
2、关闭两台服务器的防火墙
systemctl stop firewalld && setenforce 0
3、在node1上安装es
rpm -ivh elasticsearch-5.5.0.rpm    ## 安装
systemctl daemon-reload    重载服务配置
systemctl enable elasticsearch.service    ## 设置开机自启动
4、编辑es配置文件并修改
vim /etc/elasticsearch/elasticsearch.yml

修改以下内容:

17 cluster.name: my-elk_cluster              ## 集群名
23 node.name: node1                             ## 节点名
33 path.data: /data/elk_data                   ## 数据存放路径
37 path.logs: /var/log/elasticsearch      ## 日志存放路径
43 bootstrap.memory_lock: false           ## 不在启动的时候锁定内存
55 network.host: 0.0.0.0                      ## 提供服务绑定的IP地址,监听所有地址
59 http.port: 9200                              ## 监听端口为9200
68 discovery.zen.ping.unicast.hosts: ["node1", "node2"]     ## 集群发现通过单播发现
5、创建数据存放路径
mkdir -p /data/elk_data
chown elasticsearch.elasticsearch /data/elk_data/     ## 设置目录权限
6、开启es服务
systemctl start elasticsearch.service
7、查看服务端口是否开启
netstat -natp | grep 9200 ## 刚启动的话看不到9200端口,等10秒左右后就有了
8、打开浏览器分别访问两个节点
http://192.168.50.133:9200/
http://192.168.50.134:9200/

## 节点1:
{
  "name" : "node1",
  "cluster_name" : "my-elk-cluster",
  "cluster_uuid" : "Tl4HiPhqSLmvuCmK8slYtA",
  "version" : {
    "number" : "5.5.0",
    "build_hash" : "260387d",
    "build_date" : "2017-06-30T23:16:05.735Z",
    "build_snapshot" : false,
    "lucene_version" : "6.6.0"
  },
  "tagline" : "You Know, for Search"
}

## 节点2:
{
  "name" : "node2",
  "cluster_name" : "my-elk_cluster",
  "cluster_uuid" : "VTnP4Wo2R3i4_3PQ-dtyDg",
  "version" : {
    "number" : "5.5.0",
    "build_hash" : "260387d",
    "build_date" : "2017-06-30T23:16:05.735Z",
    "build_snapshot" : false,
    "lucene_version" : "6.6.0"
  },
  "tagline" : "You Know, for Search"
}
9、检查集群健康状态
http://192.168.50.133:9200/_cluster/health?pretty
http://192.168.50.134:9200/_cluster/health?pretty

{
  "cluster_name" : "my-elk-cluster",
  "status" : "green",
  "timed_out" : false,
  "number_of_nodes" : 1,
  "number_of_data_nodes" : 1,
  "active_primary_shards" : 0,
  "active_shards" : 0,
  "relocating_shards" : 0,
  "initializing_shards" : 0,
  "unassigned_shards" : 0,
  "delayed_unassigned_shards" : 0,
  "number_of_pending_tasks" : 0,
  "number_of_in_flight_fetch" : 0,
  "task_max_waiting_in_queue_millis" : 0,
  "active_shards_percent_as_number" : 100.0
}

{
  "cluster_name" : "my-elk_cluster",
  "status" : "green",
  "timed_out" : false,
  "number_of_nodes" : 1,
  "number_of_data_nodes" : 1,
  "active_primary_shards" : 0,
  "active_shards" : 0,
  "relocating_shards" : 0,
  "initializing_shards" : 0,
  "unassigned_shards" : 0,
  "delayed_unassigned_shards" : 0,
  "number_of_pending_tasks" : 0,
  "number_of_in_flight_fetch" : 0,
  "task_max_waiting_in_queue_millis" : 0,
  "active_shards_percent_as_number" : 100.0
}
10、上面这种json格式并不友好,不能很好的监控群集状态,或进行一些数据索引的操作,所以我们再来安装一个lasticsearch-head数据可视化工具,安装这个工具前首先要安装node组件依赖包和phantomjs前端框架
## 安装node组件依赖包
1.安装编译环境:yum -y install gcc gcc-c++ make
2.解压缩:tar zxvf /opt/node-v8.2.1.tar.gz /opt
3.进入软件目录进行配置:
cd node-v8.2.1/
./configure
4.编译:make -j3   ## 时间很长,需要耐心等待
5.安装:make install
11、安装phantomjs前端框架
解压缩:tar jxvf /opt/phantomjs-2.1.1-linux-x86_64.tar.bz2 -C /usr/local/src/

命令让系统识别:cp /usr/local/src/phantomjs-2.1.1-linux-x86_64/bin/phantomjs /usr/local/bin/
12、安装elasticsearch-head数据可视化工具
解压缩:tar zxvf /opt/elasticsearch-head.tar.gz -C /usr/local/src/
进入目录:cd /usr/local/src/elasticsearch-head/
安装:npm install

编辑配置文件:vim /etc/elasticsearch/elasticsearch.yml
添加如下两行:
http.cors.enabled: true     ## 开启跨域访问支持,默认为false
http.cors.allow-origin: "*"   ## 跨域访问允许的域名地址
PS:注意这两行内容必须添加,否则无法访问head工具页面

重启es服务:systemctl restart elasticsearch
13、启动elasticsearch-head 启动服务
cd /usr/local/src/elasticsearch-head/
启动:npm run start &

查看是否开启:
[root@node1 elasticsearch-head]# netstat -natp | grep 9100
tcp        0      0 0.0.0.0:9100            0.0.0.0:*               LISTEN      10654/grunt
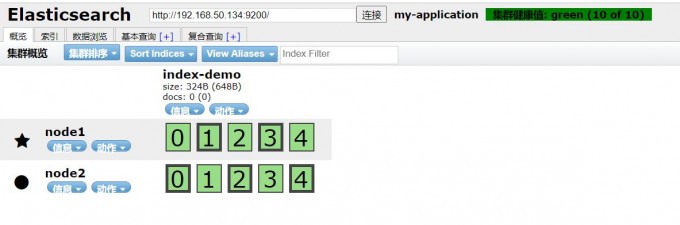
现在es搭建完成,我们可以先创建一个索引
在node1上创建索引为index-demo,类型为test,可以看到成功创建【注意:现在web页面创建索引,再输入命令插入】
curl -XPUT 'localhost:9200/index-demo/test/1?pretty&pretty' -H 'content-Type: application/json' -d '{"user":"zhangsan","mesg":"hello world"}'

返回内容:
{
  "_index" : "index-demo",
  "_type" : "test",
  "_id" : "1",
  "_version" : 1,
  "result" : "created",
  "_shards" : {
    "total" : 2,
    "successful" : 2,
    "failed" : 0
  },
  "created" : true
}
打开Web页面输入安装elasticsearch-head工具的服务器ip:http://192.168.50.133:9200/
14、在node2上安装logstash并进行相关设置
1.安装rpm包:rpm -ivh logstash-5.5.1.rpm
2.开启logstash:systemctl start logstash.service
3.设置开机自启动:systemctl enable logstash.service
4.将logstash命令建立软连接:ln -s /usr/share/logstash/bin/logstash /usr/local/bin/

★logstash命令解释:
-f:通过这个选项可以指定logstash的配置文件,根据配置文件配置logstash
-e:后面跟着字符串,该字符串可以被当做logstash的配置(如果是“ ”,则默认使用stdin作为输入,stdout作为输出)
-t:测试配置文件是否正确,然后退出
15、将logstash日志生成到elasticsearch中(系统日志)
修改系统日志文件的权限:chmod o+r /var/log/messages

编辑logstash配置文件:vim /etc/logstash/conf.d/system.conf
写入以下内容:

input {
    file{
      path => "/var/log/messages"
      type => "system"
      start_position => "beginning"
       }
      }
output {
      elasticsearch {
        hosts => ["192.168.50.133:9200"]
        index => "system-%{+YYYY.MM.dd}"
         }
       }

重启服务:systemctl restart logstash
16、在node2上安装Kibana
1.安装:rpm -ivh kibana-5.5.1-x86_64.rpm
2.修改配置文件:vim /etc/kibana/kibana.yml

2 server.port: 5601                ## 开启端口
7 server.host: "0.0.0.0"           ## 侦听地址(全网段)
21 elasticsearch.url: "http://192.168.50.133:9200"        ## 和elasticsearch建立关系
30 kibana.index: ".kibana"          ## 在elasticsearch中添加.kibana索引

3.启动服务:systemctl start kibana
  开机自启:systemctl enable kibana
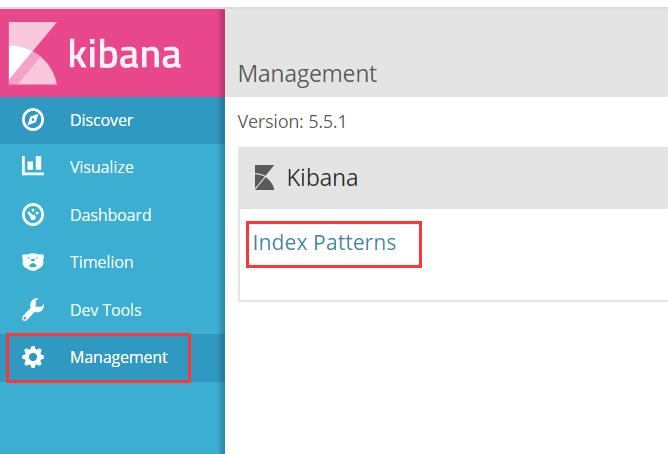
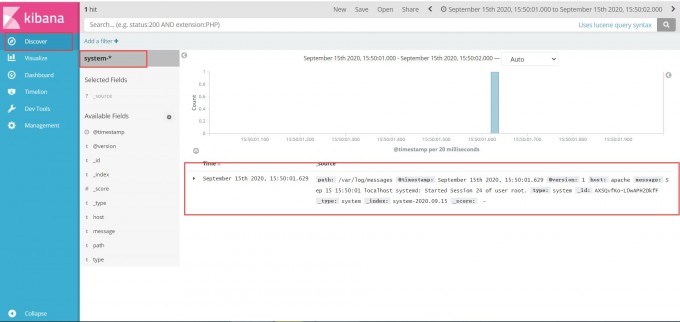
17、在Kibana中创建索引来查看从es中收集到的日志
①单击Management
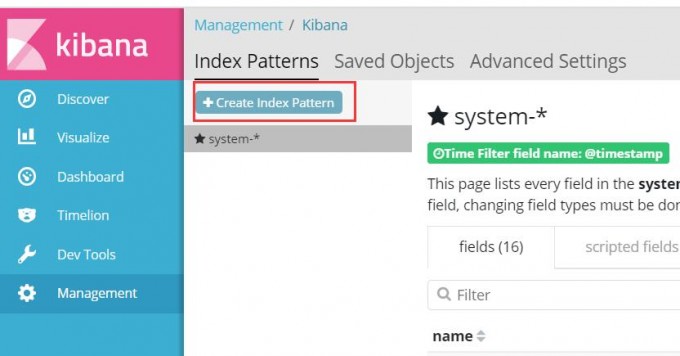
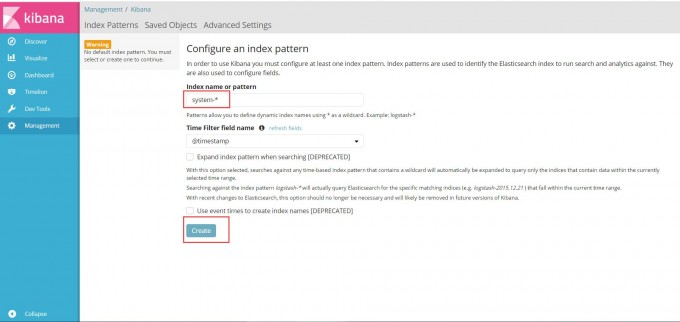
②创建索引,输入索引名,点击create按钮创建
③单击Discover按钮在左上角选择"system"即可在右侧查看到日志信息了


 167
167

 被折叠的 条评论
为什么被折叠?
被折叠的 条评论
为什么被折叠?
 到【灌水乐园】发言


