


注:本文为 “BCC” 相关合辑。
略作重排,未整理去重。
如有内容异常,请看原文。
BPF:BCC(BPF Compiler Collection)工具集认知
山河已无恙 于 2025-01-08 14:42:15 修改
写在前面
不必太纠结于当下,也不必太忧虑未来,当你经历过一些事情的时候,眼前的风景已经和从前不一样了。
——村上春树
- 博文内容为
《BPF Performance Tools》读书笔记整理 - 内容涉及 BCC 工具整体介绍
简单介绍
BCC(BPF Compiler Collection)是一个开源项目,全称为BPF 编译器集合,主要用于构建 BPF(Berkeley Packet Filter,特别是 eBPF,即扩展 BPF)软件。允许开发者使用C、Python、Lua等语言编写高效且安全的内核追踪和操作程序,支持kprobes、uprobes等动态跟踪技术,并提供了静态跟踪、性能分析、网络流量控制等多种功能,是 Linux 内核编程和性能调优的强大工具集。
使用场景:
网络性能调优:通过 eBPF 触发和监控网络事件,如分析网络包的流经路径、计算网络延迟等。内存性能分析:使用 BCC 工具集中的内存相关工具,如 memleak、memcache 等,监控进程的内存分配和释放情况。文件系统性能优化:通过 BCC 工具集中的 ftrace、ext4slower 等工具,监控文件系统的读写操作。调试和故障排查:利用 BCC 和 BPF 技术进行调试和故障排查。
BCC 的组件
开源项目地址:https://github.com/iovisor/bcc
git clone https://github.com/iovisor/bcc.git
目录结构
liruilonger@cloudshell:~/bcc$ tree -L 1
.
├── cmake
├── CMakeLists.txt
├── CODEOWNERS
├── CONTRIBUTING-SCRIPTS.md
├── debian
├── docker
├── docs
├── examples
├── FAQ.txt
├── images
├── INSTALL.md
├── introspection
├── libbpf-tools
├── LICENSE.txt
├── LINKS.md
├── man
├── QUICKSTART.md
├── README.md
├── scripts
├── snap
├── SPECS
├── src
├── tests
└── tools

15 directories, 9 files
liruilonger@cloudshell:~/bcc$
tools 主要为工具和 example
liruilonger@cloudshell:~/bcc/tools$ ls
argdist_example.txt       filegone_example.txt        oomkill.py               swapin_example.txt
argdist.py                filegone.py                 opensnoop_example.txt    swapin.py
bashreadline_example.txt  filelife_example.txt        opensnoop.py             syncsnoop_example.txt
bashreadline.py           filelife.py                 perlcalls_example.txt    syncsnoop.py
bindsnoop_example.txt     fileslower_example.txt      perlcalls.sh             syscount_example.txt
bindsnoop.py              fileslower.py               perlflow_example.txt     syscount.py
biolatency_example.txt    filetop_example.txt         perlflow.sh              tclcalls_example.txt
biolatency.py             filetop.py                  perlstat_example.txt     tclcalls.sh
biolatpcts_example.txt    funccount_example.txt       perlstat.sh              tclflow_example.txt
biolatpcts.py             funccount.py                phpcalls_example.txt     tclflow.sh
biopattern_example.txt    funcinterval_example.txt    phpcalls.sh              tclobjnew_example.txt
biopattern.py             funcinterval.py             phpflow_example.txt      tclobjnew.sh
biosnoop_example.txt      funclatency_example.txt     phpflow.sh               tclstat_example.txt
biosnoop.lua              funclatency.py              phpstat_example.txt      tclstat.sh
biosnoop.py               funcslower_example.txt      phpstat.sh               tcpaccept_example.txt
biotop_example.txt        funcslower.py               pidpersec_example.txt    tcpaccept.py
biotop.py                 gethostlatency_example.txt  pidpersec.py             tcpcong_example.txt
man 主要为帮助文档
liruilonger@cloudshell:~/bcc/man$ tree -L 1
.
├── CMakeLists.txt
└── man8

1 directory, 1 file
liruilonger@cloudshell:~/bcc/man$ cd man8/
liruilonger@cloudshell:~/bcc/man/man8$ tree .
.
├── argdist.8
├── bashreadline.8
├── bindsnoop.8
├── biolatency.8
├── biolatpcts.8
├── biopattern.8
├── biosnoop.8
├── biotop.8
├── bitesize.8
doc 为参考指南以及教程
liruilonger@cloudshell:~/bcc/docs$ tree .
.
├── kernel_config.md
├── kernel-versions.md
├── reference_guide.md
├── special_filtering.md
├── tutorial_bcc_python_developer.md
└── tutorial.md

0 directories, 6 files
liruilonger@cloudshell:~/bcc/docs$
src 为源代码
liruilonger@cloudshell:~/bcc$ cd src/
liruilonger@cloudshell:~/bcc/src$ tree -L 1
.
├── cc
├── CMakeLists.txt
├── lua
└── python

3 directories, 1 file
liruilonger@cloudshell:~/bcc/src$
查看安装目录
liruilonger@cloudshell:~$ dpkg -L bpfcc-tools
BCC 的特性
CC 的内核态特性
BCC 会使用不少内核态的特性,比如BPF、kprobes、uprobes等。下面这个清单的括号中的内容包含了一些实现细节
- 动态插桩,内核态 (kprobes 的 BPF 支持)
- 动态插桩,用户态 (uprobes 的 BPF 支持)
- 静态跟踪,内核态 (跟踪点的 BPF 支持)
- 时间采样事件 (BPF,使用
perf_event_open()) - PMC 事件 (BPF,使用
perf_event_open()) - 过滤 (使用 BPF 程序)
- 调试打印输出 (使用
bpf_trace_printk()) - 基于每个事件的输出 (使用
bpfperf_event_open()) - 基础变量 (全局和每线程专属变量,通过
BPF 映射表实现) - 关联数组 (associative array,通过
BPF 映射表实现) - 频率统计 (通过
BPF 映射表实现) - 直方图 (支持以 2 的幂为区间,或线性以及自定义区间,通过
BPF 映射表实现) - 时间戳和时间差 (通过
bpf_ktime_get_ns()和 BPF 程序实现) - 调用栈信息,内核态 (通过
BPF stackmap实现) - 调用栈信息,用户态 (通过
BPF stackmap实现) - 可覆盖的环形缓冲区 (通过
perfe_vent_attr.write_backward实现) - 低成本开销的插桩支持 (BPFJIT,以及在
BPF 映射表中进行统计) - 生产环境安全性 (BPF 验证器)
用户态特性
BCC 用户态前端和 BCC 代码仓库中提供了以下用户态的特性。
- 静态跟踪,用户态 (通过
uprobes实现的SystemTap风格的 USDT 探针) - 调试打印输出 (通过 Python 使用
BPF.trace_pipe()和BPF.trace_felds()) - 基于每个事件的输出 (
BPFPERFOUTPUT 宏和BPF.open_perfbufer()) - 周期性输出 (
BPF.get_table()和table.clear()) - 直方图打印 (
table.print_log2_hist()) - C 结构体成员访问,内核态 (将 BCC 重写器映射到
bpfproberead()结果上) - 内核态的符号解析 (
ksym()和ksymaddr()) - 用户态的符号解析 (
usymaddr()) - 调试信息符号的解析支持
- BPF 跟踪点支持 (
TRACEPOINTPROBE) - BPF 调用栈回溯支持 (
BPFSTACK_TRACE) - 各种其他辅助宏和函数
- 示例 (在
/examples目录下) - 许多工具 (在
/tools目录下) - 新手指引 (在
/docs/tutorial*.md中) - 参考手册 (在
/docs/reference_guide.md中)
安装 BCC
内核要求
主要的内核 BPF 组件是在内核 4.1 到 4.9 版本之间发布的,推荐使用Linux4.9(发布于 2016 年 12 月)或更新的内核版本。
需要开启以下内核配置选项:CONFIG_BPF=y、CONFIG_BPF_SYSCALL=y、CONFIG_BPF_EVENTS=y、CONFIG_ BPF_JIT=y,还有CONFIG_HAVE_EBPF_JIT=y.现在这些选项在很多 Linux 发行版中是默认开启的,所以一般不需要你进行变更。
Ubuntu
包的名字叫作 bpfcc-tools
liruilonger@cloudshell:~$ sudo apt install bpfcc-tools
AI 写代码 bash1
liruilonger@cloudshell:~$ dpkg -L bpfcc-tools
AI 写代码 bash1
liruilonger@cloudshell:/usr/sbin$ ls | grep  bpfcc
argdist-bpfcc
bashreadline-bpfcc
bindsnoop-bpfcc
biolatency-bpfcc
biolatpcts-bpfcc
biosnoop-bpfcc
biotop-bpfcc
bitesize-bpfcc
bpflist-bpfcc
btrfsdist-bpfcc
btrfsslower-bpfcc
cachestat-bpfcc
cachetop-bpfcc
RHEL
sudo yum -u install bcc-tools
其他发行版 可以参考 install.md 文件的中的内容
┌──[root@liruilongs.github.io]-[~/bcc]
└─$cat INSTALL.md
BCC 的工具
重点工具
调试/多用途:trace(跟踪系统调用或函数执行)、argdist(跟踪并统计函数参数的分布情况)、funccount(统计函数被调用的次数)、stackcount(统计函数调用栈的频次)、opensnoop(跟踪进程打开文件)CPU 相关:execsnoop(执行新程序的行为)、runglat(测量进程的运行延迟)、runglen(测量进程的运行长度)、 cpudist、profle、ofcputime、syscount、softirq、hardirq内存相关:memleak(检测内存泄漏)文件系统相关:opensnoop(跟踪文件打开操作)、flelife(跟踪文件生命周期)、vfsstatt(收集虚拟文件系统统计信息)、fleslower(检测文件系统慢操作)、cachestat/writeback/dcstat(与文件系统缓存和写入操作相关的统计工具)、xfsslower/xfsdist/ext4dist(针对特定文件系统(如 XFS、Ext4)的性能分析工具)磁盘 IO 相关: biolatency(跟踪块 I/O 操作的延迟)、biosnoop/biotop(跟踪和显示块 I/O 操作的详细信息)、 bitesize(分析块 I/O 的大小分布)网络相关:tcpconnect/tcpaccept(跟踪 TCP 连接和接受事件)、tcplife(跟踪 TCP 套接字的生命周期)、tcpretrans(分析 TCP 重传事件)安全相关:capable(检查进程是否具有特定的 Linux 功能(capabilities))编程语言相关:javastat,javacalls、javathreads、javafow、javagc针对 Java 应用程序的性能和调用分析应用程序相关:mysqld_qslower(针对 MySQL 数据库的慢查询分析)、signals/killsnoop(跟踪进程信号接收和杀死事件)内核相关:wakeuptime/offwaketime(分析内核唤醒事件和延迟)
工具的特点
BCC 工具拥有以下共同特点:
- 它们中的每一个都解决了
实际的观测性问题,有其创建的必要性。 - 它们设计为在生产环境中由
root 用户来使用。 - 每个工具都有一个对应的
man帮助文档 (在 man/man8 下)。 - 每个工具都配备了
示例文件,其中有示例输出以及对输出的解释 (在 tools/*example.txt 文件中)。 - 许多工具都接受启动选项和参数,大部分工具在使用
-h选项时会打印帮助信息 - 工具源代码以一段注释作为开始。
- 工具源代码遵循统一的风格 (使用 pep8 工具进行统一检查)。
尽管 BCC 支持不同的语言前端,但 BCC 工具中
用户态组件主要使用Python语言完成内核态 BPF 程序则主要使用C语言完成
这些使用 Python/C 语言的工具会得到来自 BCC 项目开发者更多的关注和维护,因此本书也主要介绍它们。
单一用途工具
UNIX的哲学是专注做一件事情,并把它做好 (do one thing and do it well)。
换一种说法是:创建小的高质量的工具,使用管道 (pipe) 将其连接起来以完成更复杂的任务这一传统带来了一批小巧而功能单一的工具并流传至今,比如grep(1)、cut(1) 和 sed(1)等。
BCC 包含许多类似的单一功能工具,包括 opensnoop(8)、execsnoop(8) 和 biolatency(8)。opensnoop(8)是一个很好的例子。参看下面的例子,思考一下对于跟踪 open(2) 系列系统调用的这个单一任务来讲,这些选项和输出可以如何自由组合:
liruilonger@cloudshell:~$ sudo opensnoop-bpfcc -h
usage: opensnoop-bpfcc [-h] [-T] [-U] [-x] [-p PID] [-t TID] [--cgroupmap CGROUPMAP] [--mntnsmap MNTNSMAP] [-u UID]
                       [-d DURATION] [-n NAME] [-e] [-f FLAG_FILTER]

Trace open() syscalls

optional arguments:
  -h, --help            show this help message and exit
  -T, --timestamp       include timestamp on output
  -U, --print-uid       print UID column
  -x, --failed          only show failed opens
  -p PID, --pid PID     trace this PID only
  -t TID, --tid TID     trace this TID only
  --cgroupmap CGROUPMAP
                        trace cgroups in this BPF map only
  --mntnsmap MNTNSMAP   trace mount namespaces in this BPF map only
  -u UID, --uid UID     trace this UID only
  -d DURATION, --duration DURATION
                        total duration of trace in seconds
  -n NAME, --name NAME  only print process names containing this name
  -e, --extended_fields
                        show extended fields
  -f FLAG_FILTER, --flag_filter FLAG_FILTER
                        filter on flags argument (e.g., O_WRONLY)

examples:
    ./opensnoop           # trace all open() syscalls
    ./opensnoop -T        # include timestamps
    ./opensnoop -U        # include UID
    ./opensnoop -x        # only show failed opens
    ./opensnoop -p 181    # only trace PID 181
    ./opensnoop -t 123    # only trace TID 123
    ./opensnoop -u 1000   # only trace UID 1000
    ./opensnoop -d 10     # trace for 10 seconds only
    ./opensnoop -n main   # only print process names containing "main"
    ./opensnoop -e        # show extended fields
    ./opensnoop -f O_WRONLY -f O_RDWR  # only print calls for writing
    ./opensnoop --cgroupmap mappath  # only trace cgroups in this BPF map
    ./opensnoop --mntnsmap mappath   # only trace mount namespaces in the map
liruilonger@cloudshell:~$ sudo opensnoop-bpfcc
AI 写代码 bash12345678910111213141516171819202122232425262728293031323334353637383940
PID    COMM               FD ERR PATH
10923  entrypoint.sh       3   0 /dev/null
10923  ps                  3   0 /etc/ld.so.cache
10923  ps                  3   0 /lib/x86_64-linux-gnu/libprocps.so.8
10923  ps                  3   0 /lib/x86_64-linux-gnu/libdl.so.2
10923  ps                  3   0 /lib/x86_64-linux-gnu/libc.so.6
10923  ps                  3   0 /usr/lib/x86_64-linux-gnu/libsystemd.so.0
10923  ps                  3   0 /lib/x86_64-linux-gnu/librt.so.1
10923  ps                  3   0 /lib/x86_64-linux-gnu/liblzma.so.5
10923  ps                  3   0 /usr/lib/x86_64-linux-gnu/libzstd.so.1
10923  ps                  3   0 /usr/lib/x86_64-linux-gnu/liblz4.so.1
10923  ps                  3   0 /usr/lib/x86_64-linux-gnu/libgcrypt.so.20
10923  ps                  3   0 /lib/x86_64-linux-gnu/libpthread.so.0
10923  ps                  3   0 /lib/x86_64-linux-gnu/libgpg-error.so.0
10923  ps                  3   0 /proc/self/auxv
10923  ps                  3   0 /proc/sys/kernel/osrelease
10923  ps                  3   0 /sys/devices/system/cpu/online
10923  ps                  3   0 /proc/self/auxv
10923  ps                  3   0 /proc/self/stat
10923  ps                 -1   6 /dev/tty
10923  ps                  3   0 /proc/uptime
10923  ps                  4   0 /proc/sys/kernel/pid_max
10923  ps                  4   0 /proc/sys/kernel/osrelease
10923  ps                  4   0 /proc/meminfo
10923  ps                  5   0 /proc
10923  ps                  6   0 /proc/1/stat
多用途工具
在BCC中,最强大的多用途工具是funccount(8)、stackcount(8)、trace(8)以及argdist(8),接下来的部分会对它们进行介绍。这些多用途工具通常需要用户来决定跟踪哪些事件。
不过为了能够享受这种灵活性,用户需要知道使用哪些kprobes、uprobes 以及其他事件等细节–包括如何使用它们。在后续关于特定主题的章节中,还是会回到使用单一用途工具上。
funccount: 对事件进行计数,包括函数调用stackcount:对引发某事件的函数调用栈进行计数trace: 定制化打印每个事件的细节信息argdist: 对事件的参数分布进行统计
Linux 探测工具 BCC(可观测性)
posted @ 2020-07-08 10:08 charlieroro
简介
BCC 是一个用于跟踪内核和操作程序的工具集,其软件包中包含了一些有用的工具和例子,它扩展了 BPF(Berkeley Packet Filters),通常被称为 eBPF , 在 Linux3.15 中首次引入,但大多数 BCC 的功能需要 Libux4.1 及以上版本。
BCC 使用 C 语言进行内核检测,并使用 Python 和 lua 作为前端简化了 BPF 程序的编写,它适用于多种任务,如性能分析和网络流量控制。
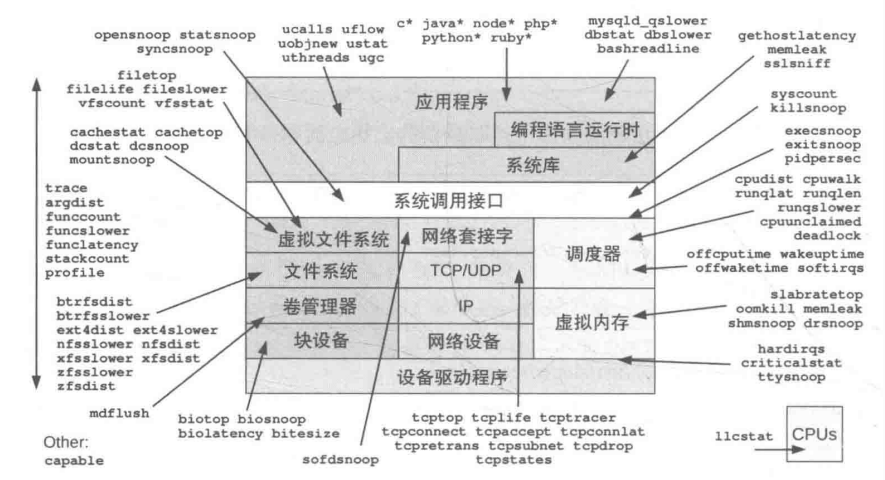
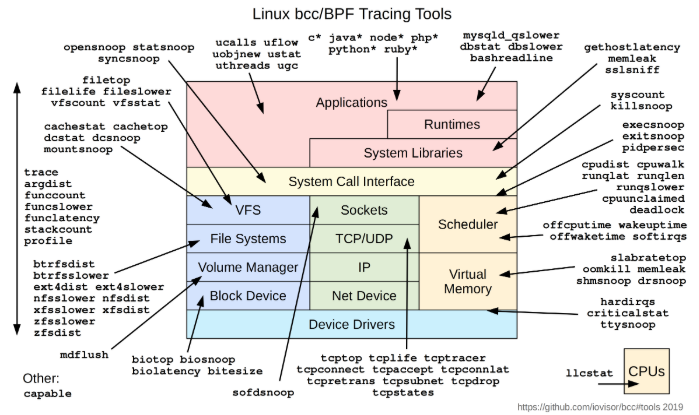
BCC 支持的分析工具示意图如下,更多参见官方 文档。
动机
BPF 保证加载到内核中的程序不会导致内核崩溃,且不会永远运行,但 BPF 本身的通用性又可以支持执行很多类型的计算。可以使用 C 语言编写一个有效的 BPF 程序,当然也可以使用 C 语言编写一个无效的 BPF 程序。在运行程序前,用户无法知道他的程序是有效的还是无效的。
使用特定的 BPF 前端后,用户可以通过编写脚本并从编译器获得反馈。该工具集的目的是提供一个前端,用于创建有效的 BPF 程序,同时不影响它的灵活性。
目前与 BPF 集成的工作流比较混乱,有时候会涉及编译内核源码树。该工具集可以减少开发者花费到 BPF 编译的时间,将精力聚集到编写的应用本身,并解决 BPF 的问题。
该工具集的特性包括:
- (共享库中) 端到端的 BPF 工作流
- 为 BPF 后端提供改进的 C 语言
- 与 llvm-bpf 后端集成,用于 JIT
- 动态加载 (卸载)JITed 程序
- 支持 BPF 内核钩子:socket 过滤,tc 分类器,tc 动作和 kprobes
- 与 python 绑定使用
- socket 过滤,tc 分类器和 kprobes 的例子
- 自包含的工具,用于跟踪一个运行的系统
未来 BCC 会支持绑定更多的语言。
版本要求
BCC 对内核版本有严格的要求,BCC 提供的功能需要对应的内核支持才能使用,因此尽量使用最新发布版本的 Linux 内核。详细对应关系,参见BPF Features by Linux Kernel Version
安装
本次按照官方 文档,使用 centos7.6 操作系统安装 bcc
安装依赖
sudo yum install -y epel-release
sudo yum update -y
sudo yum groupinstall -y "Development tools"
sudo yum install -y elfutils-libelf-devel cmake3 git bison flex ncurses-devel
sudo yum install -y luajit luajit-devel  # for Lua support
安装和编译 LLVM
curl  -LO  http://releases.llvm.org/7.0.1/llvm-7.0.1.src.tar.xz
curl  -LO  http://releases.llvm.org/7.0.1/cfe-7.0.1.src.tar.xz
tar -xf cfe-7.0.1.src.tar.xz
tar -xf llvm-7.0.1.src.tar.xz

mkdir clang-build
mkdir llvm-build

cd llvm-build
cmake3 -G "Unix Makefiles" -DLLVM_TARGETS_TO_BUILD="BPF;X86" \
  -DCMAKE_BUILD_TYPE=Release ../llvm-7.0.1.src
make
sudo make install

cd ../clang-build
cmake3 -G "Unix Makefiles" -DLLVM_TARGETS_TO_BUILD="BPF;X86" \
  -DCMAKE_BUILD_TYPE=Release ../cfe-7.0.1.src
make
sudo make install
cd ..
或通过 centos-release-scl 安装 (推荐,安装比较快)
yum install -y centos-release-scl
yum-config-manager --enable rhel-server-rhscl-7-rpms
yum install -y devtoolset-7 llvm-toolset-7 llvm-toolset-7-llvm-devel llvm-toolset-7-llvm-static llvm-toolset-7-clang-devel
source scl_source enable devtoolset-7 llvm-toolset-7
注:重启之后需要重新执行
source scl_source enable devtoolset-7 llvm-toolset-7
安装和编译 BCC
git clone https://github.com/iovisor/bcc.git
mkdir bcc/build; cd bcc/build
cmake3 ..
make
sudo make install
上述命令执行成功后,bcc 会被安装在/usr/share/bcc路径下。
windows 源码查看
windows 下可以直接使用如下命令安装 BCC 即可查看源码:
> pip install bcc
BCC 的基本使用
本节看下 BCC 自带的部分工具 (/usr/share/bcc/tool) 的基本用法:
- execsnoop
- opensnoop
- ext4slower (or btrfs*, xfs*, zfs*)
- biolatency
- biosnoop
- cachestat
- tcpconnect
- tcpaccept
- tcpretrans
- runqlat
- profile
工具讲解
execsnoop
execsnoop 会以行输出每个新的进程,用于检查生命周期比较短的进程,这些进程会消耗 CPU 资源,但不会出现在大多数以周期性采集正在运行的进程快照的监控工具中。
该工具会跟踪 exec() 系统调用,而不是 fork(),因此它能够跟踪大部分新创建的进程,但不是所有的进程 (它无法跟踪一个应用启动的工作进程,因为此时没有用到 exec())。
# ./execsnoop
PCOMM            PID    RET ARGS
bash             15887    0 /usr/bin/man ls
preconv          15894    0 /usr/bin/preconv -e UTF-8
输出显示了父进程的命令名 (PCOMM),PID,exec() 调用后的返回值 (RET),命令行参数 (ARGS)
examples:
    ./execsnoop           # trace all exec() syscalls
    ./execsnoop -x        # include failed exec()s
    ./execsnoop -T        # include time (HH:MM:SS)
    ./execsnoop -U        # include UID
    ./execsnoop -u 1000   # only trace UID 1000
    ./execsnoop -u root   # get root UID and trace only this
    ./execsnoop -t        # include timestamps
    ./execsnoop -q        # add "quotemarks" around arguments
    ./execsnoop -n main   # only print command lines containing "main"
    ./execsnoop -l tpkg   # only print command where arguments contains "tpkg"
    ./execsnoop --cgroupmap mappath  # only trace cgroups in this BPF map
    ./execsnoop --mntnsmap mappath   # only trace mount namespaces in the map
更多用法参见example。
注解:该工具可以看作是对ps命令的扩展,可以记录进程的变更信息。
opensnoop
opensnoop 以行输出每个 open() 系统调用及其详细信息。
通过打开的文件可以了解到一个应用是如何工作的,确定其数据文件,配置文件和 log 文件等。有时候应用会因为要读取一个不存在的文件而导致异常,可以通过 opensnoop 命令快速定位问题。
$ ./opensnoop -T
TIME(s)       PID    COMM               FD ERR PATH
0.000000000   977    AliYunDun          23   0 /var/log/secure
0.000373000   16884  opensnoop          -1   2 /usr/lib64/python2.7/encodings/ascii.so
0.000380000   16884  opensnoop          -1   2 /usr/lib64/python2.7/encodings/asciimodule.so
0.000385000   16884  opensnoop          12   0 /usr/lib64/python2.7/encodings/ascii.py
0.000391000   16884  opensnoop          13   0 /usr/lib64/python2.7/encodings/ascii.pyc
0.255241000   977    AliYunDun          23   0 /proc/977/stat
0.255329000   977    AliYunDun          23   0 /sys/devices/system/cpu
0.255380000   977    AliYunDun          23   0 /proc/977/stat
0.600429000   977    AliYunDun          23   0 /var/log/secure
1.200850000   977    AliYunDun          23   0 /var/log/secure
opensnoop 会按照顺序输出进程打开的文件
examples:
    ./opensnoop           # trace all open() syscalls
    ./opensnoop -T        # include timestamps
    ./opensnoop -U        # include UID
    ./opensnoop -x        # only show failed opens
    ./opensnoop -p 181    # only trace PID 181
    ./opensnoop -t 123    # only trace TID 123
    ./opensnoop -u 1000   # only trace UID 1000
    ./opensnoop -d 10     # trace for 10 seconds only
    ./opensnoop -n main   # only print process names containing "main"
    ./opensnoop -e        # show extended fields
    ./opensnoop -f O_WRONLY -f O_RDWR  # only print calls for writing
    ./opensnoop --cgroupmap mappath  # only trace cgroups in this BPF map
    ./opensnoop --mntnsmap mappath   # only trace mount namespaces in the map
更多用法参见example。
ext4slower (or btrfs*, xfs*, zfs*)
ext4slower 会跟踪 ext4 的读,写,打开和 fsyncs 操作,并在超过阈值后打印信息。
对于识别或排除性能问题非常有用:通过文件系统显示独立的慢速磁盘 I/O。由于磁盘处理 I/O 是异步的,因此很难将该层的延迟与应用程序的延迟联系起来。使用本工具,可以在 VFS -> 文件系统接口层面进行跟踪,将更接近应用的问题所在。
$ ./ext4slower 1
Tracing ext4 operations slower than 1 ms
TIME     COMM           PID    T BYTES   OFF_KB   LAT(ms) FILENAME
06:35:01 cron           16464  R 1249    0          16.05 common-auth
06:35:01 cron           16463  R 1249    0          16.04 common-auth
06:35:01 cron           16465  R 1249    0          16.03 common-auth
06:35:01 cron           16465  R 4096    0          10.62 login.defs
延迟的评估从发起 VFS 接口到文件系统的操作开始,到该操作结束为止。中间包括多个过程:块设备 I/O,系统 CPU 周期,文件系统锁,运行队列延迟等。相比评估块设备接口的延迟更加合理。
注:本工具仅会跟踪前面列出的通用的文件系统操作,不包含其他文件系统操作 (如 inode 操作)。
类似的用于其他系统的工具还有 btrfsslower, xfsslower, 和 zfsslower。此外还有 fileslower 命令,用于跟踪基于文件的同步读写。
默认显示慢于 10ms 的 I/O 操作。
更多用法参见example。
biolatency
biolatency 会跟踪块设备的 I/O 延迟,并以直方图显示延迟分布,相比 iostat 给出的平均延迟更加直观。
# ./biolatency
Tracing block device I/O... Hit Ctrl-C to end.
     usecs           : count     distribution
       0 -> 1        : 0        |                                      |
       2 -> 3        : 0        |                                      |
       4 -> 7        : 0        |                                      |
       8 -> 15       : 0        |                                      |
      16 -> 31       : 0        |                                      |
      32 -> 63       : 0        |                                      |
      64 -> 127      : 1        |                                      |
     128 -> 255      : 12       |********                              |
     256 -> 511      : 15       |**********                            |
     512 -> 1023     : 43       |*******************************       |
    1024 -> 2047     : 52       |**************************************|
    2048 -> 4095     : 47       |**********************************    |
    4096 -> 8191     : 52       |**************************************|
    8192 -> 16383    : 36       |**************************            |
   16384 -> 32767    : 15       |**********                            |
   32768 -> 65535    : 2        |*                                     |
   65536 -> 131071   : 2        |*                                     |
上面展示了从 128 微秒到 32767 微秒之间的 I/O 延迟分布,最高的延迟为 65 毫秒到 131 毫秒之间的 2 个 IO
examples:
    ./biolatency            # summarize block I/O latency as a histogram
    ./biolatency 1 10       # print 1 second summaries, 10 times
    ./biolatency -mT 1      # 1s summaries, milliseconds, and timestamps
    ./biolatency -Q         # include OS queued time in I/O time
    ./biolatency -D         # show each disk device separately
    ./biolatency -F         # show I/O flags separately
更多用法参见example。
biosnoop
biosnoop 跟踪每个块设备的 I/O,并打印每个 I/O 的延迟。
$ ./biosnoop
TIME(s)     COMM           PID    DISK    T SECTOR     BYTES  LAT(ms)
0.000000    jbd2/vda1-8    301    vda     W 17073104   40960     0.65
0.000479    jbd2/vda1-8    301    vda     W 17073184   4096      0.42
3.071857    kworker/u4:0   17124  vda     W 2048       12288     0.51
3.071927    kworker/u4:0   17124  vda     W 4196360    4096      0.57
使用时可以结合 biolatency,首先使用biolatency -D找出延迟大的磁盘,然后使用 biosnoop 找出导致延迟的进程。
更多用法参见example。
cachestat
cachestat 每秒会打印文件系统 cache 的概要信息。使用该工具可以定位低缓存命中率和高 miss 率。
$ ./cachestat.py
    HITS   MISSES  DIRTIES HITRATIO   BUFFERS_MB  CACHED_MB
       1        0        0  100.00%            5        191
     198    12136        0    1.61%            5        238
       1    11007        3    0.01%            5        281
       0     6384        0    0.00%            5        306
       1    14464        0    0.01%            5        363
       0    11776        0    0.00%            5        409
       1    11712        0    0.01%            5        454
      32    13184        0    0.24%            5        506
       0    11232        0    0.00%            5        550
       1    13056        0    0.01%            5        601
      16    14720        0    0.11%            5        658
      33     9920        0    0.33%            5        697
       0    13248        0    0.00%            5        749
       4    14144        0    0.03%            5        804
       0     9728        0    0.00%            5        842
       1    10816        0    0.01%            5        885
     808    13504        1    5.65%            5        938
       0    11409        0    0.00%            5        982
       0    11520        0    0.00%            5       1027
       0    15616        0    0.00%            5       1088
       1     9792        0    0.01%            5       1126
       0     8256        0    0.00%            5       1158
       1     9600        0    0.01%            5       1196
     599     4804        0   11.09%            5       1215
       1        0        0  100.00%            5       1215
       0        0        0    0.00%            5       1215
       3        1        0   75.00%            5       1215
   79536       34        0   99.96%            5       1215
   87693      274        4   99.69%            6       1214
   89018     3546        0   96.17%            7       1227
   33531      201        4   99.40%            7       1228
      22       44        0   33.33%            8       1228
       0        0        0    0.00%            8       1228
      73       21        2   77.66%            8       1228
上述首次花费了 24s 来读取 1GB 的文件,体现为高 MISSES ,低 HITRATIO;第二次读取时仅花费了 4s,HITRATIO 接近 99%。HITRATIO=HITS/(HITS+MISSES)
tcpconnect+tcpaccept+tcpretrans
推荐使用 ss 命令查看,ss -i可以看到重传信息。
runqlat
以直方图的方式显示 CPU run 队列中的现存等待的时间。用于评估在 CPU 饱和时等待的时长。
$ ./runqlat -p 980 -L
Tracing run queue latency... Hit Ctrl-C to end.
^C

tid = 1054
     usecs               : count     distribution
         0 -> 1          : 0        |                                        |
         2 -> 3          : 0        |                                        |
         4 -> 7          : 5        |****************************************|
         8 -> 15         : 1        |********                                |

tid = 1055
     usecs               : count     distribution
         0 -> 1          : 0        |                                        |
         2 -> 3          : 3        |****************************************|
         4 -> 7          : 2        |**************************              |
         8 -> 15         : 1        |*************                           |
...
上面展示了进程 980 中的线程的等待时长的分布情况。进程等待时间过程可能是被其他 CPU 密集型任务占用了 CPU。
examples:
    ./runqlat            # summarize run queue latency as a histogram
    ./runqlat 1 10       # print 1 second summaries, 10 times
    ./runqlat -mT 1      # 1s summaries, milliseconds, and timestamps
    ./runqlat -P         # show each PID separately
    ./runqlat -p 185     # trace PID 185 only
profile
推荐使用strace和perf trace命令
BCC 的开发
本节介绍使用 Python 接口进行 BCC 的开发,包括两部分:可观测性和网络。
可观测性
Lesson 1. Hello World
执行examples/hello_world.py,并在另一个会话中执行一些命令 (如ls),此时会打印"Hello,World!".
# ./examples/hello_world.py
            bash-13364 [002] d... 24573433.052937: : Hello, World!
            bash-13364 [003] d... 24573436.642808: : Hello, World!
[...]
hello_world.py 中的代码如下:
from bcc import BPF
BPF(text='int kprobe__sys_clone(void *ctx) { bpf_trace_printk("Hello, World!\\n"); return 0; }').trace_print()
包含如下 6 个内容:
text='...': 定义了一个使用 C 编写的内联的 BPF 程序。kprobe__sys_clone(): 这是通过 kprobes 对内核进行动态跟踪的一种捷径。如果 C 函数以kprobe__开头,剩下的部分将作为内核函数名来处理,本例为sys_clone(),void *ctx: ctx 包含参数,但鉴于此处没有使用,因此将其强转为void *bpf_trace_printk(): 将 printf() 输出到通用的 trace_pipe (/sys/kernel/debug/tracing/trace_pipe) 的一个简单内核工具。该函数对于一些场景是合适的,但也有限制:最多 3 个参数,仅有一个%s,且 trace_pipe 是全局共享的,因此并行的程序会导致输出混乱。最好采用 BPF_PERF_OUTPUT() 接口,后续会介绍。return 0; kprobe__sys_clone 函数的出参类型为 int,必须返回一个值。.trace_print(): 一个 bcc 例程,从 trace_pipe 中读取,并打印输出。
Lesson 2. sys_sync()
尝试将跟踪的系统调用改为 sys_sync(),当执行sync命令时会输出"sys_sync() called"
#!/usr/bin/python
from bcc import BPF
BPF(text='int kprobe__sys_sync(void *ctx) { bpf_trace_printk("sys_sync() called!\\n"); return 0; }').trace_print()
Lesson 3. hello_fields.py
文件路径为examples/tracing/hello_fields.py。运行时的输出如下:
$ ./hello_fields.py
TIME(s)            COMM             PID    MESSAGE
546.560775000      bash             1150   Hello, World!
547.127956000      bash             1150   Hello, World!
源码如下:
from bcc import BPF

# define BPF program
prog = """
int hello(void *ctx) {
    bpf_trace_printk("Hello, World!\\n");
    return 0;
}
"""

# load BPF program
b = BPF(text=prog)
b.attach_kprobe(event=b.get_syscall_fnname("clone"), fn_name="hello")

# header
print("%-18s %-16s %-6s %s" % ("TIME(s)", "COMM", "PID", "MESSAGE"))

# format output
while 1:
    try:
        (task, pid, cpu, flags, ts, msg) = b.trace_fields()
    except ValueError:
        continue
    print("%-18.9f %-16s %-6d %s" % (ts, task, pid, msg))
内容与 hello_world.py 类似,通过 sys_clone() 跟踪新的进程,但增加了新的内容:
prog =: 将 C 程序定义为一个变量,后面会引用它,便于使用命令行参数时进行字符串替换。hello(): 此处定义了一个 C 函数,而没有直接使用kprobe__开头的系统调用,后续会引用它。定义在 BPF 程序中的 C 函数将会运行在一个 probe 上,这些函数都使用pt_reg* ctx作为第一个参数。如果需要定义一些不在 probe 上执行的辅助函数,则需要将这些函数定义为static inline,以便编译器进行内联,有时还需要向其添加_always_inline function属性。b.attach_kprobe(event=b.get_syscall_fnname("clone"), fn_name="hello"):为内核 clone 系统调用函数创建一个 kprobe,该 kprobe 会执行自定义的 hello() 函数。可以通过多次执行 attach_kprobe() ,将自定义的 C 函数附加到多个内核函数上。b.trace_fields():从 trace_pipe 返回固定的字段集,与 trace_print() 类似,对黑客来说很方便,但实际作为工具时,推荐使用 BPF_PERF_OUTPUT()。
Lesson 4. sync_timing.py
还记得系统管理员在重启前在一个慢控制台上输入 sync 三次的日子吗,这些操作是为了给第一个异步 sync 完成的时间?有人认为直接执行一行代码sync;sync;sync更加便利,这种方式后来成为了行业惯例,尽管它违背了最初的目的。此时 sync 变成了同步执行的指令,这看起来很愚蠢。
下面例子展示了do_sync函数被调用的速度,并打印输出 (如果最近调用的时间超过一秒钟),sync;sync;sync会打印输出第二次和第三次 sync。
# ./examples/tracing/sync_timing.py
Tracing for quick sync's... Ctrl-C to end
At time 0.00 s: multiple syncs detected, last 95 ms ago
At time 0.10 s: multiple syncs detected, last 96 ms ago
代码来自 examples/tracing/sync_timing.py。
from __future__ import print_function
from bcc import BPF

# load BPF program
b = BPF(text="""
#include <uapi/linux/ptrace.h>

BPF_HASH(last); #初始化一个哈希,用于保存时间,一个哈希可以保存多个 key/value 对,使用 items() 进行迭代

int do_trace(struct pt_regs *ctx) {
    u64 ts, *tsp, delta, key = 0;

    // attempt to read stored timestamp
    tsp = last.lookup(&key); //查找是否存在 key,哈希在保存时采纳的时 key 的值,而不是 key 的地址,因此要保证 key 的值是唯一的
    if (tsp != NULL) {
        delta = bpf_ktime_get_ns() - *tsp;// 打印两次调用之间的时间差,纳秒
        if (delta < 1000000000) {
            // output if time is less than 1 second
            bpf_trace_printk("%d\\n", delta / 1000000);
        }
        last.delete(&key);
    }

    // update stored timestamp
    ts = bpf_ktime_get_ns(); //将当前时间保存到键为 key 的 hash 中
    last.update(&key, &ts);
    return 0;
}
""")

b.attach_kprobe(event=b.get_syscall_fnname("sync"), fn_name="do_trace")#追踪 sync 命令
print("Tracing for quick sync's... Ctrl-C to end")

# format output
start = 0
while 1:
    (task, pid, cpu, flags, ts, ms) = b.trace_fields()
    if start == 0:
        start = ts
    ts = ts - start
    print("At time %.2f s: multiple syncs detected, last %s ms ago" % (ts, ms))
内容包括:
bpf_ktime_get_ns(): 返回纳秒为单位的时间BPF_HASH(last):创建一个 hash(关联数组)的 BPF map 对象,称为”last“,由于没有进一步指定任何参数,因此默认为 u64 类型的 key 和 value。key = 0:只在该 hash 中存储一个 key/value 对,其中 key 为零。last.lookup(&key): 在 hash 中查找 key,如果存在,则返回对应的值,否则返回 NULL。上面将 key 作为指向指针的地址传入。if (tsp != NULL) {: 校验指针是否为空,如果不为空,则表示该函数并非首次调用,可以计算两次调用的时间差last.delete(&key):删除键,原因是内核的.update()存在的 bug。last.update(&key, &ts):将第二个参数表示的时间值保存到键为 key 的 hash 中,覆盖之前的数值。
Lesson 5. sync_count.py
修改 sync_timing.py 程序,保存所有 sync 系统调用的次数,并打印输出,修改如下 (注意运行不能带中文字符):
#!/usr/bin/python

from __future__ import print_function
from bcc import BPF

# load BPF program
b = BPF(text="""
#include <uapi/linux/ptrace.h>

BPF_HASH(last);
BPF_HASH(count); //创建一个新的 count

int do_trace(struct pt_regs *ctx) {
    u64 curct=1,ts, *tsp, delta, key = 0,key1 = 1;
    u64 *ctp;

    // attempt to read stored timestamp
    tsp = last.lookup(&key);
    ctp = count.lookup(&key1); //获取保存的地址,一个 key 对应一个变量地址
    if (NULL != ctp){          //如果存在则累加,并更新
        curct = *ctp+1;   //注意:此处不能使用*curct++,可能是因为内核数据的原因,只能通过 count.update 更新
		count.update(&key1, &curct);
    }else{
		count.update(&key1, &curct);//如果不存在直接保存当前值 1
    }

    if (tsp != NULL) {
        delta = bpf_ktime_get_ns() - *tsp;
        if (delta < 1000000000) {
            // output if time is less than 1 second
            bpf_trace_printk("count:%d,%d\\n", curct,delta / 1000000); //打印 count
        }
        last.delete(&key);
    }

    // update stored timestamp
    ts = bpf_ktime_get_ns();
    last.update(&key, &ts);
    return 0;
}
""")

b.attach_kprobe(event=b.get_syscall_fnname("sync"), fn_name="do_trace")
print("Tracing for quick sync's... Ctrl-C to end")

# format output
start = 0
while 1:
    (task, pid, cpu, flags, ts, ms) = b.trace_fields()
    if start == 0:
        start = ts
    ts = ts - start
    print("At time %.2f s: multiple syncs detected, last %s ms ago" % (ts, ms))
输出结果如下:
Tracing for quick sync's... Ctrl-C to end
At time 0.00 s: multiple syncs detected, last count:2,3 ms ago
At time 0.00 s: multiple syncs detected, last count:3,0 ms ago
At time 0.41 s: multiple syncs detected, last count:4,413 ms ago
At time 0.42 s: multiple syncs detected, last count:5,2 ms ago
At time 0.42 s: multiple syncs detected, last count:6,0 ms ago
Lesson 6. disksnoop.py
执行 examples/tracing/disksnoop.py ,部分输出结果如下:
$ ./disksnoop.py
TIME(s)            T  BYTES    LAT(ms)
4011.638426000     W  65536       1.01
4011.638754000     W  65536       1.33
4011.639049000     W  65536       1.62
4011.639490000     W  65536       2.06
4011.639511000     W  65536       2.08
4011.639750000     W  65536       2.32
代码为:
[...]
REQ_WRITE = 1		# from include/linux/blk_types.h

# load BPF program
b = BPF(text="""
#include <uapi/linux/ptrace.h>
#include <linux/blkdev.h>

BPF_HASH(start, struct request *); //此处的 value 为一个指针。由于 trace_start 和 trace_completion 中的入参 req 其实是同一个地址,因此此处可以使用指针

void trace_start(struct pt_regs *ctx, struct request *req) {
	// stash start timestamp by request ptr
	u64 ts = bpf_ktime_get_ns();

	start.update(&req, &ts); //使用 req 的地址作为 key
}

void trace_completion(struct pt_regs *ctx, struct request *req) {
	u64 *tsp, delta;

	tsp = start.lookup(&req);
	if (tsp != 0) {
		delta = bpf_ktime_get_ns() - *tsp;
		bpf_trace_printk("%d %x %d\\n", req->__data_len,
		    req->cmd_flags, delta / 1000);
		start.delete(&req);
	}
}
""")

b.attach_kprobe(event="blk_start_request", fn_name="trace_start")
b.attach_kprobe(event="blk_mq_start_request", fn_name="trace_start")
b.attach_kprobe(event="blk_account_io_completion", fn_name="trace_completion")
[...]
包含内容:
REQ_WRITE:此处在 python 程序中定义了一个内核常量,该变量来自include/linux/blk_types.h,可以直接使用trace_start(struct pt_regs *ctx, struct request *req):该函数后续会添加到 kprobes 中。第一个参数struct pt_regs *ctx用于通过 kprpbe 函数注册 BPF 上下文,第二个参数才是给该函数的参数。此处将该函数附加到 blk_start_request 上,其首个参数类型为struct request *。start.update(&req, &ts): 使用指向 request 结构体的指针作为 hash 的 key,使用指向结构体的指针作为 key 是个不错的选择,因为指针的地址是唯一的 (需要注意释放和重用场景)。此处是给描述磁盘 I/O 的 request 结构体打上时间标签。还有两个常用的键用于存储时间戳:指向结构体的指针和线程 ID。req->__data_len:此处访问了struct request的成员,可以在内核源代码中查看它的定义,并了解其中有哪些成员。bcc 实际上会将这些表达重写为一系列的bpf_probe_read_kernel()调用,有时 bcc 无法处理复杂的引用,此时需要直接调用bpf_probe_read_kernel()
注:上述程序使用
trace_start和trace_completion对访问磁盘的操作进行打点,blk_start_request,blk_mq_start_request和blk_account_io_completion都是内核函数,具体实现可以在 linux 源码中找到,对函数的描述如下 (来自内核 v5.7.7 版本):/** * blk_mq_start_request - Start processing a request * @rq: Pointer to request to be started * * Function used by device drivers to notify the block layer that a request * is going to be processed now, so blk layer can do proper initializations * such as starting the timeout timer. */ /** * blk_mq_complete_request - end I/O on a request * @rq: the request being processed * * Description: * Ends all I/O on a request. It does not handle partial completions. * The actual completion happens out-of-order, through a IPI handler. **/在内核 5.7.7 版本中已经不存在
blk_start_request函数,因此在最新的 bcc 0.1.10 版本中上述程序修改为:if BPF.get_kprobe_functions(b'blk_start_request'): #首先验证该内核函数是否存在 b.attach_kprobe(event="blk_start_request", fn_name="trace_start") b.attach_kprobe(event="blk_mq_start_request", fn_name="trace_start") b.attach_kprobe(event="blk_account_io_completion", fn_name="trace_completion")bcc 使用 get_kprobe_functions 函数校验内涵函数是否存在,可以看到是在/proc/kallsyms 中进行检查的,/proc/kallsyms 保存了 Linux 内核符号表。
Lesson 7. hello_perf_output.py
最后使用 bpf_trace_printk() 和 BPF_PERF_OUTPUT() 接口,这也意味着将不再使用trace_field()获取如 PID 和时间戳等信息。
执行 examples/tracing/hello_perf_output.py 的结果如下:
# ./hello_perf_output.py
TIME(s)            COMM             PID    MESSAGE
0.000000000        bash             22986  Hello, perf_output!
0.021080275        systemd-udevd    484    Hello, perf_output!
0.021359520        systemd-udevd    484    Hello, perf_output!
0.021590610        systemd-udevd    484    Hello, perf_output!
[...]
代码如下:
from bcc import BPF

# define BPF program
prog = """
#include <linux/sched.h>

// define output data structure in C
struct data_t {
    u32 pid;
    u64 ts;
    char comm[TASK_COMM_LEN];
};
BPF_PERF_OUTPUT(events);

int hello(struct pt_regs *ctx) {
    struct data_t data = {};

    data.pid = bpf_get_current_pid_tgid(); //获取执行该命令的进程 ID
    data.ts = bpf_ktime_get_ns();
    bpf_get_current_comm(&data.comm, sizeof(data.comm));

    events.perf_submit(ctx, &data, sizeof(data));

    return 0;
}
"""

# load BPF program
b = BPF(text=prog)
b.attach_kprobe(event=b.get_syscall_fnname("clone"), fn_name="hello")

# header
print("%-18s %-16s %-6s %s" % ("TIME(s)", "COMM", "PID", "MESSAGE"))

# process event
start = 0
def print_event(cpu, data, size):
    global start
    event = b["events"].event(data)
    if start == 0:
            start = event.ts
    time_s = (float(event.ts - start)) / 1000000000
    print("%-18.9f %-16s %-6d %s" % (time_s, event.comm, event.pid,
        "Hello, perf_output!"))

# loop with callback to print_event
b["events"].open_perf_buffer(print_event)
while 1:
    b.perf_buffer_poll()
需要掌握的内容为:
struct data_t: 定义了将数据从内核空间传递到用户空间的 C 结构体BPF_PERF_OUTPUT(events): 将输出 channel 命名为"events"struct data_t data = {};: 创建一个空的 data_t 结构体bpf_get_current_pid_tgid(): 获取低 32 为的进程 ID(内核角度的 PID,在用户空间体现为线程 ID),线程组 ID 和高 32 位 (在用户空间体现为 PID)。保存低 32 位的内容,并丢弃高 32 位的内容。那么应该呈现的是 PID 还是 TGID?对于一个多线程 app,其 TGID 是相同的,因此需要使用 PID 来进行区分。bpf_get_current_comm(): 用当前进程名填充第一个参数地址。在上述例子中打点的系统调用位"clone",在执行 clone 时会填充 clone 的进程的 PID,时间戳和进程名,因此进程名和 PID 是一致的。events.perf_submit():通过一个 perf ring buffer 将事件交给用户空间。def print_event(): 定义一个 Python 函数,用于从事件流中处理事件b["events"].event(data): 通过 C 声明自动将事件转为为 Python 对象b["events"].open_perf_buffer(print_event): 将 Python 的print_event与事件流关联起来。while 1: b.perf_buffer_poll():阻塞等待事件
Lesson 8. sync_perf_output.py
重新修改前面的 sync_timing.py,使用BPF_PERF_OUTPUT进行输出:
#!/usr/bin/python
#
# sync_timing.py    Trace time between syncs.
#                   For Linux, uses BCC, eBPF. Embedded C.
#
# Written as a basic example of tracing time between events.
#
# Copyright 2016 Netflix, Inc.
# Licensed under the Apache License, Version 2.0 (the "License")

from __future__ import print_function
from bcc import BPF
from bcc.utils import printb

# load BPF program
b = BPF(text="""
#include <uapi/linux/ptrace.h>

BPF_HASH(last);

struct data_t {
    u64 cur_ts;
	u64 diff_ts;
};

BPF_PERF_OUTPUT(events);

int do_trace(struct pt_regs *ctx) {
    u64 ts, *tsp, key = 0;
    struct data_t data = {};
    // attempt to read stored timestamp
    tsp = last.lookup(&key);
    if (tsp != NULL) {
	    data.cur_ts = bpf_ktime_get_ns() / 1000000000;
	    data.diff_ts = bpf_ktime_get_ns() - *tsp;
        if (data.diff_ts < 1000000000) {
            // output if time is less than 1 second
            events.perf_submit(ctx, &data, sizeof(data));
        }
        last.delete(&key);
    }

    // update stored timestamp
    ts = bpf_ktime_get_ns();
    last.update(&key, &ts);
    return 0;
}
""")

b.attach_kprobe(event=b.get_syscall_fnname("sync"), fn_name="do_trace")
print("Tracing for quick sync's... Ctrl-C to end")

# format output
start = 0
def print_event(cpu, data, size):
    global start
    event = b["events"].event(data)
    if start == 0:
        start = event.cur_ts
    ts = event.cur_ts - start
    printb(b"At time %.2f s: multiple syncs detected, last %s ms ago" % (ts, event.diff_ts / 1000000))

# loop with callback to print_event
b["events"].open_perf_buffer(print_event)

while 1:
    b.perf_buffer_poll()
Lesson 9. bitehist.py
examples/tracing/bitehist.py 程序直方图记录了磁盘 I/O 的大小:
# ./bitehist.py
Tracing... Hit Ctrl-C to end.
^C
     kbytes          : count     distribution
       0 -> 1        : 3        |                                      |
       2 -> 3        : 0        |                                      |
       4 -> 7        : 211      |**********                            |
       8 -> 15       : 0        |                                      |
      16 -> 31       : 0        |                                      |
      32 -> 63       : 0        |                                      |
      64 -> 127      : 1        |                                      |
     128 -> 255      : 800      |**************************************|
代码如下:
from __future__ import print_function
from bcc import BPF
from time import sleep

# load BPF program
b = BPF(text="""
#include <uapi/linux/ptrace.h>
#include <linux/blkdev.h>

BPF_HISTOGRAM(dist); //定义一个直方图,名为 dist

int kprobe__blk_account_io_completion(struct pt_regs *ctx, struct request *req)
{
	dist.increment(bpf_log2l(req->__data_len / 1024)); //增加直方图的计数,key 为 bpf_log2l(req->__data_len / 1024)
	return 0;
}
""")

# header
print("Tracing... Hit Ctrl-C to end.")

# trace until Ctrl-C
try:
	sleep(99999999)
except KeyboardInterrupt:
	print()

# output
b["dist"].print_log2_hist("kbytes") #打印直方图
回顾之前的内容:
kprobe__: 以该前缀开头的函数将会被认为是一个内核函数名,并使用 kprobe 进行检测,相当于直接对内核函数进行检测。第一个参数总是struct pt_regs *,其余的参数为内核函数的入参,如果不使用,则可以忽略。其与使用BPF.attach_kprobe()的方式是相同的。struct pt_regs *ctx, struct request *req: 给 kprobe 传参,ctx用于寄存器和 BPF 上下文,req为传递给被检测函数blk_account_io_completion()的第一个参数。req->__data_len: 获取该成员的值。
新的内容为:
BPF_HISTOGRAM(dist): 定义一个 BPF map 对象,为直方图,名称为"dist"dist.increment():增加直方图 bucket 的索引,默认每次增加 1,可以使用第二个参数自定义增量。bpf_log2l(): 对提供的值进行 log-2 计算,作为直方图的索引,构造二次幂直方图。b["dist"].print_log2_hist("kbytes"): 以二次幂直方图的方式打印"dist",列标题为"kbytes"。从内核空间传递到用户空间的唯一数据是 bucket 计数,这样更加高效。
Lesson 10. disklatency.py
编写一个程序计算磁盘 I/O 时间,并打印延迟的直方图。可以在前面的 disksnoop.py 中找到磁盘 I/O 检测和计时的方式,直方图的代码可以参考 bitehist.py。
#!/usr/bin/python

from __future__ import print_function
from bcc import BPF
from time import sleep

# load BPF program
b = BPF(text="""
#include <uapi/linux/ptrace.h>
#include <linux/blkdev.h>

BPF_HISTOGRAM(dist);
BPF_HASH(start, struct request *);

void trace_start(struct pt_regs *ctx, struct request *req) {
    // stash start timestamp by request ptr
    u64 ts = bpf_ktime_get_ns();

    start.update(&req, &ts);
}

void trace_completion(struct pt_regs *ctx, struct request *req) {
    u64 *tsp, delta;

    tsp = start.lookup(&req);
    if (tsp != 0) {
        delta = (bpf_ktime_get_ns() - *tsp)/1000;
        dist.increment(bpf_log2l(delta));
        //dist.increment((delta)); /*直接使用非 bpf_log2l 将无法输出结果,原因是本机延迟普遍大于 250us,直方图无法输出这么多行,可以减少 delta 的比例即可,如设置 delta = (bpf_ktime_get_ns() - *tsp)/100000;*/
        start.delete(&req);
    }
}

""")

# header
if BPF.get_kprobe_functions(b'blk_start_request'):
    b.attach_kprobe(event="blk_start_request", fn_name="trace_start")
b.attach_kprobe(event="blk_mq_start_request", fn_name="trace_start")
b.attach_kprobe(event="blk_account_io_completion", fn_name="trace_completion")
print("Tracing... Hit Ctrl-C to end.")

# trace until Ctrl-C
try:
    sleep(99999999)
except KeyboardInterrupt:
    print()

# output
b["dist"].print_log2_hist("LAT-us")
输出如下:
Tracing... Hit Ctrl-C to end.
^C
     LAT-us              : count     distribution
         0 -> 1          : 0        |                                        |
         2 -> 3          : 0        |                                        |
         4 -> 7          : 0        |                                        |
         8 -> 15         : 0        |                                        |
        16 -> 31         : 0        |                                        |
        32 -> 63         : 0        |                                        |
        64 -> 127        : 0        |                                        |
       128 -> 255        : 0        |                                        |
       256 -> 511        : 1        |****************************************|
       512 -> 1023       : 1        |****************************************|
Lesson 11. vfsreadlat.py
本例分为 python 和 C 两部分文件: examples/tracing/vfsreadlat.py 和 examples/tracing/vfsreadlat.c,直接结果如下
# ./vfsreadlat.py
Tracing... Hit Ctrl-C to end.

     usecs               : count     distribution
         0 -> 1          : 2120     |****************************************|
         2 -> 3          : 26       |                                        |
         4 -> 7          : 0        |                                        |
         8 -> 15         : 6        |                                        |

     usecs               : count     distribution
         0 -> 1          : 2120     |****************************************|
         2 -> 3          : 26       |                                        |
         4 -> 7          : 2        |                                        |
         8 -> 15         : 4        |                                        |
        16 -> 31         : 2        |                                        |

     usecs               : count     distribution
         0 -> 1          : 627      |****************************************|
         2 -> 3          : 10       |                                        |
         4 -> 7          : 2        |                                        |
         8 -> 15         : 3        |                                        |
内容为:
b = BPF(src_file = "vfsreadlat.c"): 从独立的源代码文件中读取 BPF C 程序b.attach_kretprobe(event="vfs_read", fn_name="do_return"): 将 BPF C 程序do_return()附加到内核函数vfs_read()。kretprobe 用于检测程序的返回值,而非入口。区别是 attach_kprobe() 在进入函数时探测,而 attach_kretprobe() 在退出函数时探测。b["dist"].clear():清除直方图
Lesson 12. urandomread.py
执行examples/tracing/urandomread.py,并执行命令dd if=/dev/urandom of=/dev/null bs=8k count=5,输出如下结果:
# ./urandomread.py
TIME(s)            COMM             PID    GOTBITS
4150.692889000     sshd             1420   112
4150.692918000     sshd             1420   384
4150.702547000     sshd             1421   384
4151.182605000     sshd             1420   880
4151.182658000     sshd             1420   8192
4151.182771000     sshd             1420   440
4151.205307000     sshd             1420   128
4151.230603000     sshd             1422   112
4151.230639000     sshd             1422   384
4151.256883000     sshd             1423   384
4151.330354000     sshd             1422   880
4151.330396000     sshd             1422   8192
4151.330503000     sshd             1422   440
4151.353134000     sshd             1422   128
4154.874123000     dd               1452   65536
4154.874193000     dd               1452   65536
4154.874252000     dd               1452   65536
4154.874318000     dd               1452   65536
4154.874383000     dd               1452   65536
源码为:
from __future__ import print_function
from bcc import BPF

# load BPF program
b = BPF(text="""
TRACEPOINT_PROBE(random, urandom_read) {
    // args is from /sys/kernel/debug/tracing/events/random/urandom_read/format
    bpf_trace_printk("%d\\n", args->got_bits);
    return 0;
}
""")

# header
print("%-18s %-16s %-6s %s" % ("TIME(s)", "COMM", "PID", "GOTBITS"))

# format output
while 1:
    try:
        (task, pid, cpu, flags, ts, msg) = b.trace_fields()
    except ValueError:
        continue
    print("%-18.9f %-16s %-6d %s" % (ts, task, pid, msg))
需要掌握的内容为:
TRACEPOINT_PROBE(random, urandom_read): 检测内核 tracepointsrandom:urandom_read。这是一个稳定的 API,推荐尽可能使用该函数替换kprobes。可以使用perf list列出系统支持的 tracepoints,使用 BPF 程序对 tracepoint 检测时,要求内核版本>=4.7。args->got_bits:args自动填充为跟踪点参数,其数据结构如下:
#  cat /sys/kernel/debug/tracing/events/random/urandom_read/format
name: urandom_read
ID: 1075
format:
        field:unsigned short common_type;       offset:0;       size:2; signed:0;
        field:unsigned char common_flags;       offset:2;       size:1; signed:0;
        field:unsigned char common_preempt_count;       offset:3;       size:1; signed:0;
        field:int common_pid;   offset:4;       size:4; signed:1;

        field:int got_bits;     offset:8;       size:4; signed:1;
        field:int pool_left;    offset:12;      size:4; signed:1;
        field:int input_left;   offset:16;      size:4; signed:1;

print fmt: "got_bits %d nonblocking_pool_entropy_left %d input_entropy_left %d", REC->got_bits, REC->pool_left, REC->input_left
Lesson 13. disksnoop.py fixed
下面使用block:block_rq_issue 和block:block_rq_complete重写 disksnoop.py :
#!/usr/bin/python
#
# disksnoop.py  Trace block device I/O: basic version of iosnoop.
#               For Linux, uses BCC, eBPF. Embedded C.
#
# Written as a basic example of tracing latency.
#
# Copyright (c) 2015 Brendan Gregg.
# Licensed under the Apache License, Version 2.0 (the "License")
#
# 11-Aug-2015   Brendan Gregg   Created this.

from __future__ import print_function
from bcc import BPF
from bcc.utils import printb

REQ_WRITE = 1   # from include/linux/blk_types.h

# load BPF program
b = BPF(text="""
#include <uapi/linux/ptrace.h>
#include <linux/blkdev.h>

struct data_t {
    u64 len;
    char rwbs[8];
    u64 ts;
};

BPF_HASH(start,u64,struct data_t); //定义一个名为 start 的哈希,key 类型为 u64,value 类型为 struct data_t,注意此处非指针

TRACEPOINT_PROBE(block,block_rq_issue){
    u64 key = 0;
    struct data_t data = {}; //在跟踪 block_rq_issue 的时候赋值
    data.len = args->bytes;
    bpf_probe_read(&data.rwbs,sizeof(data.rwbs),(void *)args->rwbs);
    data.ts = bpf_ktime_get_ns();

    start.update(&key, &data);
    return 0;
}

TRACEPOINT_PROBE(block,block_rq_complete){
    u64 delta, key = 0;
    struct data_t* datap;
    datap = start.lookup(&key); //在跟踪 block_rq_complete 时取出保存的值
    if (datap != NULL) {
        delta = bpf_ktime_get_ns() - datap->ts;
        bpf_trace_printk("%d %x %d\\n", datap->len,
        datap->rwbs, delta / 1000);
        start.delete(&key);
    }
    return 0;
}
""")

# header
print("%-18s %-2s %-7s %8s" % ("TIME(s)", "T", "BYTES", "LAT(ms)"))

# format output
while 1:
    try:
        (task, pid, cpu, flags, ts, msg) = b.trace_fields()
        (bytes_s, bflags_s, us_s) = msg.split()

        if int(bflags_s, 16) & REQ_WRITE:
            type_s = b"W"
        elif bytes_s == "0":    # see blk_fill_rwbs() for logic
            type_s = b"M"
        else:
            type_s = b"R"
            ms = float(int(us_s, 10)) / 1000

            printb(b"%-18.9f %-2s %-7s %8.2f" % (ts, type_s, bytes_s, ms))
    except KeyboardInterrupt:
        exit()
Lesson 14. strlen_count.py
本程序探测用户层面的函数strlen(),计算其字符串参数出现的频率,执行examples/tracing/strlen_count.py 的结果为:
# ./strlen_count.py
Tracing strlen()... Hit Ctrl-C to end.
^C     COUNT STRING
         1 " "
         1 "/bin/ls"
         1 "."
         1 "cpudist.py.1"
         1 ".bashrc"
         1 "ls --color=auto"
         1 "key_t"
[...]
        10 "a7:~# "
        10 "/root"
        12 "LC_ALL"
        12 "en_US.UTF-8"
        13 "en_US.UTF-8"
        20 "~"
        70 "#%^,~:-=?+/}"
       340 "\x01\x1b]0;root@bgregg-test: ~\x07\x02root@bgregg-test:~# "
监控的函数strlen()的位置位于 libc,当调用 libc 中的该函数时,会触发运行自定义的count函数
from __future__ import print_function
from bcc import BPF
from time import sleep

# load BPF program
b = BPF(text="""
#include <uapi/linux/ptrace.h>

struct key_t {
    char c[80];
};
BPF_HASH(counts, struct key_t);

int count(struct pt_regs *ctx) {
    if (!PT_REGS_PARM1(ctx))
        return 0;

    struct key_t key = {};
    u64 zero = 0, *val;

    bpf_probe_read_user(&key.c, sizeof(key.c), (void *)PT_REGS_PARM1(ctx));
    // could also use `counts.increment(key)`
    val = counts.lookup_or_try_init(&key, &zero);
    if (val) {
      (*val)++;
    }
    return 0;
};
""")
b.attach_uprobe(name="c", sym="strlen", fn_name="count")

# header
print("Tracing strlen()... Hit Ctrl-C to end.")

# sleep until Ctrl-C
try:
    sleep(99999999)
except KeyboardInterrupt:
    pass

# print output
print("%10s %s" % ("COUNT", "STRING"))
counts = b.get_table("counts")
for k, v in sorted(counts.items(), key=lambda counts: counts[1].value):
    print("%10d \"%s\"" % (v.value, k.c.encode('string-escape')))
PT_REGS_PARM1(ctx): 该宏会获取传递给strlen()的第一个参数,即字符串。b.attach_uprobe(name="c", sym="strlen", fn_name="count"): 附加到"c"库 (如果是主程序,则需要使用其路径,如b.attach_uprobe(name="/usr/bin/python", sym="main", fn_name="do_main")),更多参见reference。counts = b.get_table("counts"):获取 一个 table 对象,用于遍历。该方式已被废弃,可以直接使用counts = b.["counts"]counts.items():返回 table 中的 key 的队列。
Lesson 15. nodejs_http_server.py
本程序会检查用户静态定义跟踪(USDT)probe,它是内核跟踪点的用户级版本,执行examples/tracing/nodejs_http_server.py 的结果如下:
# ./nodejs_http_server.py 24728
TIME(s)            COMM             PID    ARGS
24653324.561322998 node             24728  path:/index.html
24653335.343401998 node             24728  path:/images/welcome.png
24653340.510164998 node             24728  path:/images/favicon.png
代码如下:
from __future__ import print_function
from bcc import BPF, USDT
import sys

if len(sys.argv) < 2:
    print("USAGE: nodejs_http_server PID")
    exit()
pid = sys.argv[1]
debug = 0

# load BPF program
bpf_text = """
#include <uapi/linux/ptrace.h>
int do_trace(struct pt_regs *ctx) {
    uint64_t addr;
    char path[128]={0};
    bpf_usdt_readarg(6, ctx, &addr);
    bpf_probe_read_user(&path, sizeof(path), (void *)addr);
    bpf_trace_printk("path:%s\\n", path);
    return 0;
};
"""

# enable USDT probe from given PID
u = USDT(pid=int(pid))
u.enable_probe(probe="http__server__request", fn_name="do_trace")
if debug:
    print(u.get_text())
    print(bpf_text)

# initialize BPF
b = BPF(text=bpf_text, usdt_contexts=[u])
内容包括:
bpf_usdt_readarg(6, ctx, &addr): 将 USDT 中的第 6 个参数的地址保存到addrbpf_probe_read_user(&path, sizeof(path), (void *)addr):现在字符串addr执行path变量u = USDT(pid=int(pid)):使用给定的 PID 初始化 USDT 跟踪u.enable_probe(probe="http__server__request", fn_name="do_trace"): 将 BPF C 函数do_trace()附加到 Node.js 的http__server__requestUSDT probe 上b = BPF(text=bpf_text, usdt_contexts=[u]): 将 USDT 对象u传递给创建的 BPF 对象
更多参见 reference
Lesson 16. task_switch.c
这是一个老的例子,用于回顾上面的内容。
当内核中的每个任务变更时会唤醒该程序,并在 BPF map 中记录新旧 PIDs。
下面的 C 程序提出了一个新观念:上一个参数。BCC 前端对该参数进行了特别处理,这样就可以从 kprobe 基础设施传递的已保存的上下文中访问该变量。参数的原型位于第一个位置,需要与被 kprobed 的内核函数的原型匹配,如果匹配,程序将可以无缝地访问函数参数。
#include <uapi/linux/ptrace.h>
#include <linux/sched.h>

struct key_t {
    u32 prev_pid;
    u32 curr_pid;
};

BPF_HASH(stats, struct key_t, u64, 1024);
int count_sched(struct pt_regs *ctx, struct task_struct *prev) {
    struct key_t key = {};
    u64 zero = 0, *val;

    key.curr_pid = bpf_get_current_pid_tgid();
    key.prev_pid = prev->pid;

    // could also use `stats.increment(key);`
    val = stats.lookup_or_try_init(&key, &zero);
    if (val) {
      (*val)++;
    }
    return 0;
}
用户空间的组件会加载上述文件,并附加到finish_task_switch内核函数。BPF 对象的[]运算符允许访问程序中的每个 BPF_HASH,进而访问内核的数据。像使用其他 python 字典对象一样使用该对象:允许读取、更新和删除。
BCC 实际不会修改内核数据,只是对内核函数调用处进行打点,采集函数入参的信息等。
from bcc import BPF
from time import sleep

b = BPF(src_file="task_switch.c")
b.attach_kprobe(event="finish_task_switch", fn_name="count_sched")

# generate many schedule events
for i in range(0, 100): sleep(0.01)

for k, v in b["stats"].items():
    print("task_switch[%5d->%5d]=%u" % (k.prev_pid, k.curr_pid, v.value))
Lesson 17. Further Study
更多例子可以参见 Sasha Goldshtein’s linux-tracing-workshop。
注:官方的开发文档中没有给出网络相关的内容,后续补充。
总结
- BCC 的代码分为 python 和 C 两部分,C 代码通常运行在内核态,用于打点采集系统调用的信息,然后将结果返回给 python 代码;也可以用于对特定 lib 的函数进行打点探测。
- BCC 的核心为 C 代码,需要了解系统调用接口,作为信息采集点;以及 BCC 本身提供的 C 代码,提供了获取当前时间,进程 PID,map 数据结构,输出等功能。
- 推荐
TRACEPOINT_PROBE进行打点检测,perf list可以列出系统支持的 tracepoint,该 tracepoint 基本包含了系统的大部分系统调用,如clone,sync等 (要求内核版本>=4.7),但网络相关的还是需要使用 kprobes 对内核函数进行打点,如icmp_rcv。
via:
- BPF:BCC(BPF Compiler Collection)工具集认知_bcc工具-优快云博客
https://blog.youkuaiyun.com/sanhewuyang/article/details/139562192 - Linux探测工具BCC(可观测性) - charlieroro - 博客园
https://www.cnblogs.com/charlieroro/p/13265252.html#lesson-17-further-study


 1498
1498

 被折叠的 条评论
为什么被折叠?
被折叠的 条评论
为什么被折叠?
 到【灌水乐园】发言


