


import matplotlib.pyplot as plt
import numpy as np
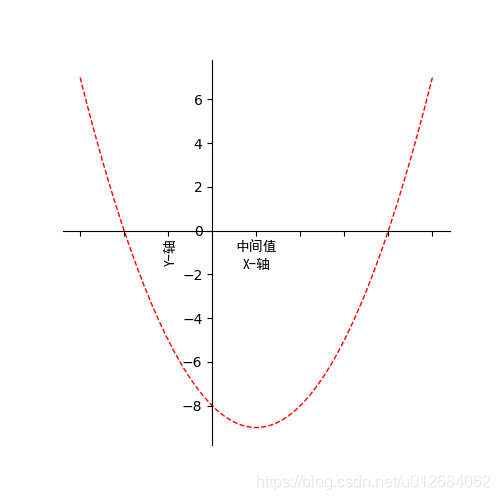
def figure_test():
# x轴范围
x = np.linspace(-3, 5, 50)
#y轴取值范围
y = x**2-2*x-8
# 设置figur名字与大小
plt.figure(num='test', figsize=((5, 5)))
#设置轴名称,若不设置fontproperties='SimHei'则中文显示乱码
plt.xlabel(u'X-轴', fontproperties='SimHei')
plt.ylabel(u'Y-轴', fontproperties='SimHei')
#设置轴上刻度间隔,并显示间隔值
# new_xticks = np.linspace(-3,5,9)
# plt.xticks(new_xticks, ['','','','','中间值'], fontproperties='SimHei')
# 绘制双曲线
plt.plot(x, y, color='red', linewidth=1.0, linestyle='--')
#获取默认坐标轴
ax = plt.gca()
#隐藏top与right坐标轴
ax.spines['top'].set_color('none')
ax.spines['right'].set_color('none')
# 将xy轴原点设置为0、0
ax.spines['bottom'].set_position(('data',0))
ax.spines['left'].set_position(('data', 0))
#设置轴上刻度间隔,并显示间隔值
new_xticks = np.linspace(-3,5,9)
plt.xticks(new_xticks, ['','','','','中间值'], fontproperties='SimHei')
plt.show()
运行效果图:
Annontation标注:
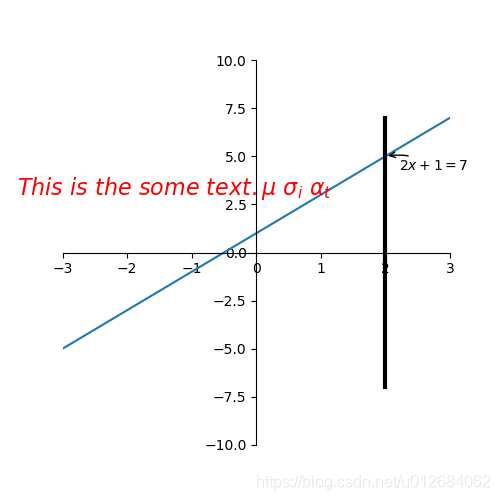
def annontation_test():
    x = np.linspace(-3, 3, 30)
    y = 2*x +1
    # 设置画布名称与大小
    plt.figure(num='one', figsize=((5,5)))
    plt.plot(x,y)
    # 绘制散点,s表示大小
    # plt.scatter(x,y,s=10, color='g')
    # 绘制垂直x轴的直线
    x2 = 2
    y2 = x2+5
    # 将两个点放入plot中,[x2,x2]表示x取值范围,[-y2,y2]表示y取值范围
    plt.plot([x2,x2], [-y2, y2], color='k', linewidth = 3)
    # 设置x/y轴取值范围
    plt.xlim(-3, 3)
    plt.ylim(-10, 10)

    # 获取四个坐标轴
    ax = plt.gca()
    # 隐藏上/右坐标轴
    ax.spines['top'].set_color('none')
    ax.spines['right'].set_color('none')
    #将(0,0)设置为原点
    ax.spines['bottom'].set_position(('data', 0))
    ax.spines['left'].set_position(('data', 0))

    '''
    添加注释annotate
    其中参数xy为箭头将要指向的坐标点,xycoords='data'是说基于数据的值来选位置,
    xytext=(+10, -10)为文本相对与xy的位置,
    textcoord='offset points'表示基于相对位置,
    arrowprops是对图中箭头类型的一下设置
    '''
    plt.annotate(r'$2x+1=%s$'%y2, xy=(x2, 2*x2+1), xycoords='data', xytext=(+10, -10),
                 textcoords='offset points', fontsize=10,
                 arrowprops=dict(arrowstyle='->', connectionstyle='arc3,rad=.2'))

    # 其中-3.7, 3,是选取text的位置, 空格需要用到转字符\ ,fontdict设置文本字体.
    plt.text(-3.7, 3, r'$This\ is\ the\ some\ text.\mu\ \sigma_i\ \alpha_t$',
             fontdict={'size': '16', 'color': 'red'})

    plt.show()
运行效果图:


 被折叠的 条评论
为什么被折叠?
被折叠的 条评论
为什么被折叠?
 到【灌水乐园】发言


