


目录
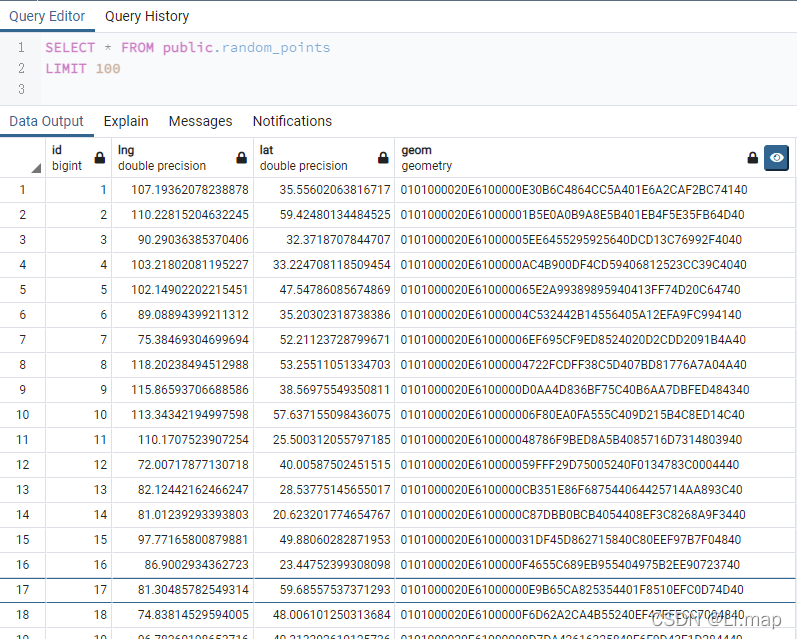
1.数据准备
2.NodeJS 实现
1)瓦片范围计算
class CalculateVectorTile {
  /**
   * 瓦片获得范围
   * **/
  tile2boundingBox(x, y, zoom) {
    let bb = {};
    bb.maxY = this.tile2lat(y, zoom);
    bb.minY = this.tile2lat(y + 1, zoom);
    bb.minX = this.tile2lon(x, zoom);
    bb.maxX = this.tile2lon(x + 1, zoom);
    return bb;
  }

  /**
   * 瓦片转换经度
   * **/
  tile2lon(x, z) {
    return (x / Math.pow(2.0, z)) * 360.0 - 180;
  }

  /**
   *瓦片转换纬度
   * @param y
   * @param z
   * @return
   */
  tile2lat(y, z) {
    let n = Math.PI - (2.0 * Math.PI * y) / Math.pow(2.0, z);
    return (180 * Math.atan(Math.sinh(n))) / Math.PI;
  }
}

module.exports = CalculateVectorTile;
2)根据x,y,z获取瓦片
function getTiles(x, y, z) {
  let bb = calculateVectorTile.tile2boundingBox(x, y, z);
  return new Promise((resolve, reject) => {
    pgConnection.connect(function (err, connection) {
      if (err) {
        reject(err);
      } else {
        let sql = `SELECT ST_AsMVT (tile,
          'points') tile
     FROM
         (SELECT st_asmvtgeom (t.geom,
          st_makeenvelope (${bb.minX},${bb.minY},${bb.maxX},${bb.maxY},4326),4326,0,
         TRUE ) AS geom
         FROM public.${tableName} t ) AS tile
     WHERE tile.geom IS NOT NULL `;

        connection.query(sql, (err, rows) => {
          if (err) {
            reject(err);
          } else {
            resolve(rows);
          }
          // 结束会话
          connection.release();
        });
      }
    });
  });
}

/**
 * 获取瓦片
 */
router.get("/getTiles", async (req, res) => {
  const { x, y, z } = req.query;
  let points = [];
  points = await getTiles(x * 1, y * 1, z * 1);
  res.send(points.rows[0].tile);
});
3.前端调用
1)leaflet 调用
<!DOCTYPE html>
<html lang="en">
<head>
<meta charset="UTF-8" />
<meta http-equiv="X-UA-Compatible" content="IE=edge" />
<meta name="viewport" content="width=device-width, initial-scale=1.0" />
<title>leafletTile</title>
<link
rel="stylesheet"
href="https://unpkg.com/leaflet@1.7.1/dist/leaflet.css"
/>
<script src="https://unpkg.com/leaflet@1.7.1/dist/leaflet.js"></script>
<script src="https://unpkg.com/leaflet.vectorgrid@latest/dist/Leaflet.VectorGrid.js"></script>
<style>
body {
margin: 0;
padding: 0;
}
#map {
position: absolute;
top: 0;
bottom: 0;
width: 100%;
}
</style>
</head>
<body>
<div id="map"></div>
<script>
let map = L.map("map", {
preferCanvas: true,
renderer: L.canvas({ padding: 0.1 }),
}).setView([30.52086429364361, 119.84249877929689], 6);
// 添加背景图层
L.tileLayer("https://{s}.tile.openstreetmap.org/{z}/{x}/{y}.png", {
attribution:
'© <a href="https://www.openstreetmap.org/copyright">OpenStreetMap</a> contributors',
}).addTo(map);
const vectorGridLayer = (url, options) => {
let layerOptions = options || {};
let vectorTileLayerStyles = {};
layerOptions.renderFactory = layerOptions.renderFactory
? layerOptions.renderFactory
: L.canvas.tile;
vectorTileLayerStyles[layerOptions.layerName] =
options.vectorTileLayerStyles;
layerOptions.vectorTileLayerStyles = vectorTileLayerStyles;
let layer = L.vectorGrid.protobuf(url, layerOptions);
return {
layer: layer,
};
};
function getVectorTileLayer() {
let url = "http://localhost:8888/tiles/getTiles?x={x}&y={y}&z={z}";
let localVectorTileOptions = {
renderFactory: L.canvas.tile,
layerName: "points",
vectorTileLayerStyles: function (feature, zoom) {
let weight = 0;
return {
weight: 1,
color: "#10fd00",
fillColor: "#10fd00",
fillOpacity: 1,
radius: 1,
};
},
};
let vectorLayer = vectorGridLayer(url, localVectorTileOptions);
return vectorLayer;
}
let vectorTileLayer = getVectorTileLayer();
map.addLayer(vectorTileLayer.layer);
</script>
</body>
</html>
效果:

2)mapbox 调用
<!DOCTYPE html>
<html>
  <head>
    <meta charset="utf-8" />
    <title>Add a third party vector tile source</title>
    <meta
      name="viewport"
      content="initial-scale=1,maximum-scale=1,user-scalable=no"
    />
    <script src="../js/mapbox-gl-v2.3.0.js"></script>
    <link href="../js/mapbox-gl-v2.3.0.css" rel="stylesheet" />
    <style>
      body {
        margin: 0;
        padding: 0;
      }

      #map {
        position: absolute;
        top: 0;
        bottom: 0;
        width: 100%;
      }
    </style>
  </head>

  <body>
    <div id="map"></div>
    <script>
      mapboxgl.accessToken =
        "pk...";
      var tileset = "mapbox.streets";
      var map = new mapboxgl.Map({
        container: "map",
        zoom: 6,
        center: [119.898625809072612, 29.106708155556731],
        style: "mapbox://styles/mapbox/light-v9",
        hash: false,
      });
      map.on("load", function loaded() {
        map.addSource("custom-go-vector-tile-source", {
          type: "vector",
          tiles: ['http://localhost:8888/tiles/getTiles?x={x}&y={y}&z={z}'],
        });
        map.addLayer({
          id: "custom-go-vector-tile-layer",
          type: "circle",
          source: "custom-go-vector-tile-source",
          "source-layer": "points",
          paint: {
            "circle-radius": 2,
            'circle-color': '#10fd00',
            "circle-opacity": 1,
          },
        });
      });
    </script>
  </body>
</html>
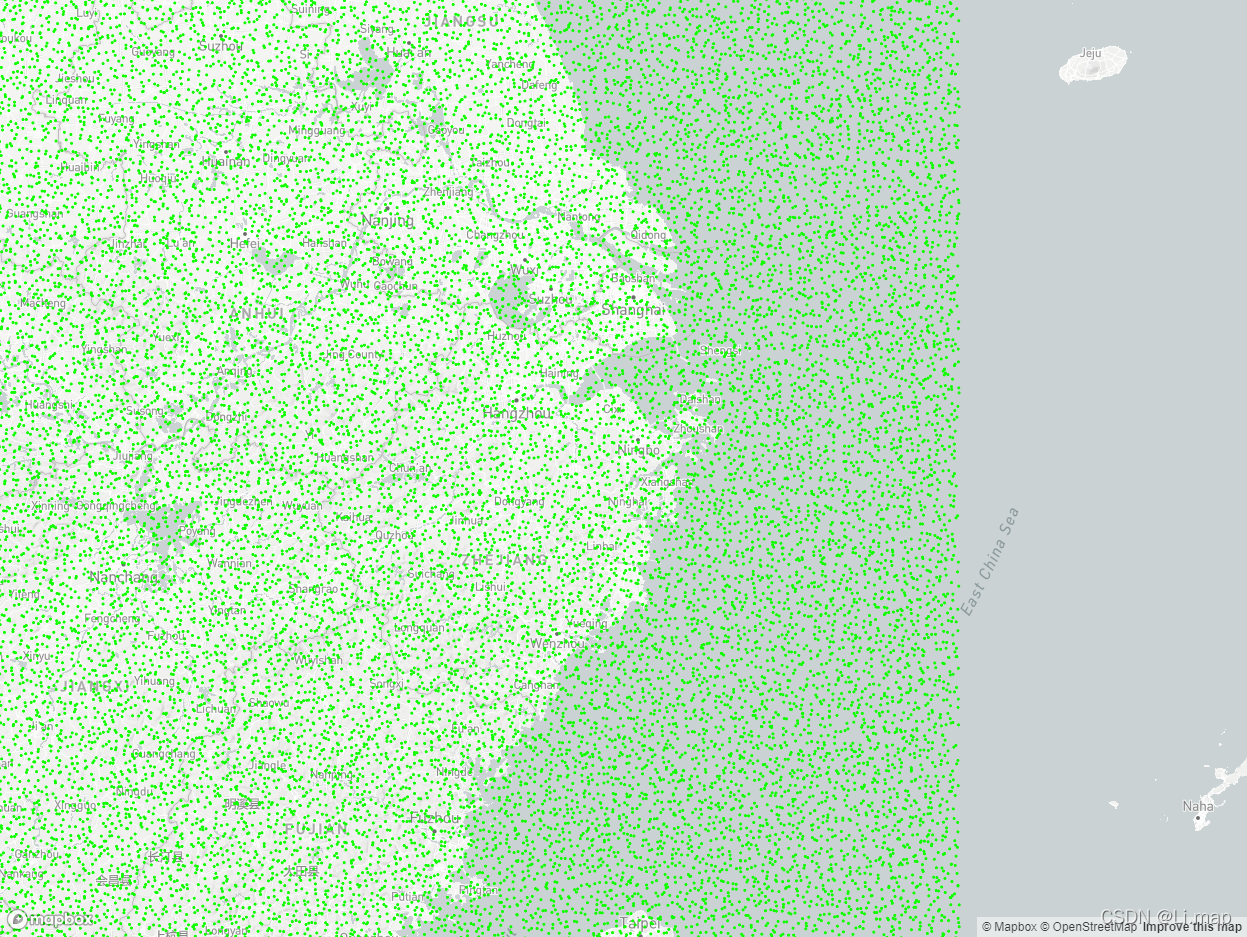
效果:


 1483
1483

 被折叠的 条评论
为什么被折叠?
被折叠的 条评论
为什么被折叠?
 到【灌水乐园】发言


