


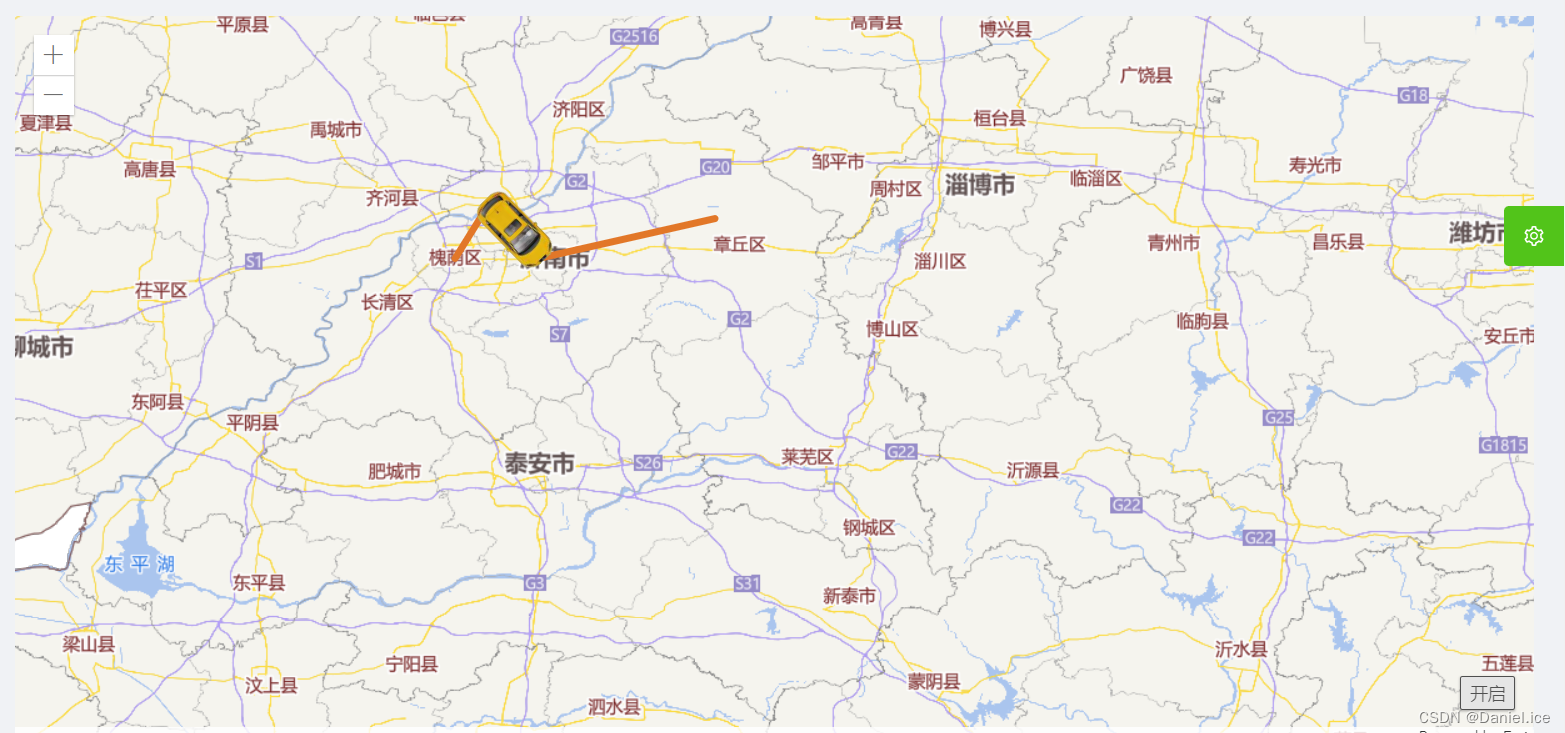
实现效果是小车沿着地图上的线条运动,根据轨迹的角度调整小车的角度。
采用的ArcGis api 版本是4.23
核心算法
function move (start, end) {
      var x1 = points[start][0]
      var y1 = points[start][1]
      var x2 = points[end][0]
      var y2 = points[end][1]

      var p = (y2 - y1) / (x2 - x1)// 斜率
      var v = 0.01// 速度

      moving = setInterval(function () {
        // 分别计算 x,y轴方向速度
        if (Math.abs(p) === Number.POSITIVE_INFINITY) { // 无穷大
          graphic.geometry.y += v
        } else {
          graphic.geometry.x += (1 / Math.sqrt(1 + p * p)) * v
          graphic.geometry.y += (p / Math.sqrt(1 + p * p)) * v
        }
        // 计算汽车角度
        graphic.symbol.angle = (Math.PI / 2 - Math.atan(p)) * 180 / Math.PI
        // 图层刷新
        me.view.graphics.add(graphic)

        if (Math.abs(graphic.geometry.x - x2) < 0.01 && Math.abs(graphic.geometry.y - y2) < 0.01) {
          clearInterval(moving)
          start++
          end++

          if (end < points.length) {
            move(start, end)
          }
        }
      }, 50)
    }
效果图
完整代码
<template>
  <div class="map_wrapper">
    <div id="viewDiv" class="map"></div>
    <button id="btn">开启</button>
  </div>
</template>

<script>
import Map from '@arcgis/core/Map'
import MapView from '@arcgis/core/views/MapView'
import Layer from '@/components/function/Layers'
import Basemap from '@arcgis/core/Basemap'
import Polyline from '@arcgis/core/geometry/Polyline'
import Graphic from '@arcgis/core/Graphic'
import Point from '@arcgis/core/geometry/Point'
export default {
  name: 'Track',
  data() {
    return {
      map: null,
      view: null
    }
  },
  computed: {},
  mounted() {
    var me = this
    this.map = new Map({})
    this.view = new MapView({
      container: 'viewDiv',
      map: this.map,
      zoom: 7,
      spatialReference: {
        wkid: 4490
      },
      center: [119.37473534604646, 36.419393962503314] // longitude, latitude
    })
    // 换用自己的地图底图
    const baseLayer = Layer('1', 7, 'url')
    const basemap = new Basemap({
      baseLayers: [baseLayer]
    })
    this.map.basemap = basemap
    var polylineJson = {
      'paths': [[[116.895, 36.6513], [116.972, 36.773], [117.089212, 36.65343], [117.466312, 36.73743]]],
      'spatialReference': { 'wkid': 4490 }
    }
    var polyline = new Polyline(polylineJson)
    var Symbol = {
      type: 'simple-line', // autocasts as SimpleLineSymbol()
      color: [226, 119, 40],
      width: 4
    }
    var graphic2 = new Graphic(polyline, Symbol)
    this.view.graphics.add(graphic2)
    var point = new Point({
      x: 116.895,
      y: 36.6513,
      spatialReference: {
        wkid: 4490
      }
    })
    var graphic = new Graphic({
      geometry: point,
      symbol: {
        type: 'picture-marker', // autocasts as SimpleMarkerSymbol
        url: '/images/car.png',
        width: '25',
        height: '51'
      }
    })
    this.view.graphics.add(graphic)
    var moving, points
    this.view.ui.add(document.getElementById('btn'), 'bottom-right')
    document.getElementById('btn').onclick = function () {
      points = polylineJson.paths[0]

      graphic.geometry.x = points[0][0]
      graphic.geometry.y = points[0][1]
      // me.view.remove(graphic)
      me.view.graphics.add(graphic)

      move(0, 1)
    }
    // 根据序列点坐标 进行移动
    function move (start, end) {
      var x1 = points[start][0]
      var y1 = points[start][1]
      var x2 = points[end][0]
      var y2 = points[end][1]

      var p = (y2 - y1) / (x2 - x1)// 斜率
      var v = 0.01// 速度

      moving = setInterval(function () {
        // 分别计算 x,y轴方向速度
        if (Math.abs(p) === Number.POSITIVE_INFINITY) { // 无穷大
          graphic.geometry.y += v
        } else {
          graphic.geometry.x += (1 / Math.sqrt(1 + p * p)) * v
          graphic.geometry.y += (p / Math.sqrt(1 + p * p)) * v
        }
        // 计算汽车角度
        graphic.symbol.angle = (Math.PI / 2 - Math.atan(p)) * 180 / Math.PI
        // 图层刷新
        me.view.graphics.add(graphic)

        if (Math.abs(graphic.geometry.x - x2) < 0.01 && Math.abs(graphic.geometry.y - y2) < 0.01) {
          clearInterval(moving)
          start++
          end++

          if (end < points.length) {
            move(start, end)
          }
        }
      }, 50)
    }
  }
}
</script>

<style scoped>
.map_wrapper {
  width: 100%;
  height: 100%;
  background-color: #ffffff;
}
.map_wrapper .map {
  width: 100%;
  height: 80vh;
}
</style>


 146
146

 被折叠的 条评论
为什么被折叠?
被折叠的 条评论
为什么被折叠?
 到【灌水乐园】发言


