


 本文介绍了在Ubuntu18环境下如何在线安装matplotlib库,并通过终端和代码测试验证其安装与使用。首先,通过pip3命令进行安装,然后在终端进行基本测试,最后展示了一个官方的代码示例,用于绘制柱状图。
零、前言
工作中要用到生成图片,最开始使用Qt实现,金主觉得low,卧槽!没办法,就自学Python,使用Python的图片生成库matplotlib,不得不说这库确实很强大!
一、matplotlib安装
1、安装指令:
pip3 install -U matplotlib
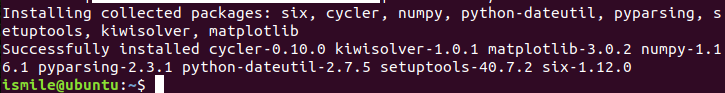
2、安装完成的提示如下:
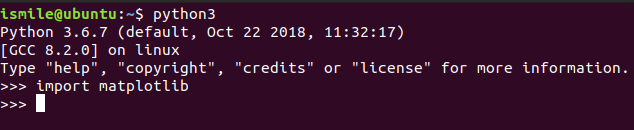
二、终端测试
三、代码测试
(这里直接使用官方给的样例:https://matplotlib.org/gallery/lines_bars_and_markers/barchart.html#sphx-glr-gallery-lines-bars-and-markers-barchart-py)
1、代码:
import numpy as np
import matplotlib.pyplot as plt

men_means, men_std = (20, 35, 30, 35, 27), (2, 3, 4, 1, 2)
women_means, women_std = (25, 32, 34, 20, 25), (3, 5, 2, 3, 3)

ind = np.arange(len(men_means))  # the x locations for the groups
width = 0.35  # the width of the bars

fig, ax = plt.subplots()
rects1 =
最低0.47元/天 解锁文章


 1170
1170

 被折叠的 条评论
为什么被折叠?
被折叠的 条评论
为什么被折叠?
 到【灌水乐园】发言


