C#实现图表中鼠标移动并显示数据

本文介绍了如何在C#中实现图表功能,当鼠标在图表上移动时动态显示数据。关键步骤包括设置图表的MouseMove事件,使用HitTest方法检测鼠标位置,以及自定义方法获取对象属性值来显示相关信息。此外,文章还展示了如何为图表系列添加数据和提示信息。

摘要生成于 C知道 ,由 DeepSeek-R1 满血版支持, 前往体验 >

本文实例为大家分享了C#实现图表中鼠标移动并显示数据的具体代码,供大家参考,具体内容如下
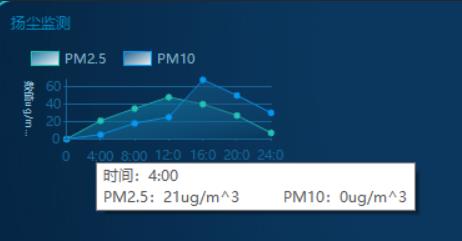
效果图:

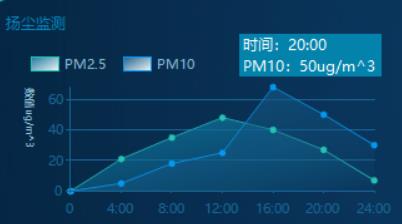
1.首先在页面上添加一个label控件并 默认隐藏:

2.给该图表添加MouseMove鼠标移动事件:

1

2

3

4

5

6

7

8

9

10

11

12

13

14

15

16

17

18

19

20

21

22

23

24

25

26

27

28

29

30

31

32

33

34

35

36

37

38

/// <summary>

/// 鼠标经过时发生

/// </summary>

/// <param name="sender"></param>

/// <param name="e"></param>

private void chart1_MouseMove(object sender, MouseEventArgs e) 

{

   try

   {

       HitTestResult Result = new HitTestResult();

       Result = chart1.HitTest(e.X, e.Y);

       if (Result.Series != null && Result.Object != null)

       {

           // 获取当前焦点x轴的值

           string xValue = ObjectUtil.GetPropertyValue(Result.Object, "AxisLabel").ToString();

           // 获取当前焦点所属区域名称

           string areaName = ObjectUtil.GetPropertyValue(Result.Object, "LegendText").ToString();

           // 获取当前焦点y轴的值

           double yValue = Result.Series.Points[Result.PointIndex].YValues[0];

           // 鼠标经过时label显示

           skinLabel4.Visible = true;

           skinLabel4.Text = "时间:"+ xValue + "\n"+ areaName + ":"+ yValue + "ug/m^3";

           skinLabel4.Location = new Point(e.X, e.Y - 20);

       }

       else

       {

           // 鼠标离开时label隐藏

           skinLabel4.Visible = false;

       }

   }

   catch (Exception se)

   {

       // 鼠标离开时label隐藏

       skinLabel4.Visible = false;

   }

}

3.其中GetPropertyValue() 获取对象中的某个属性 方法如下:

1

2

3

4

5

6

7

8

9

10

11

12

13

14

15

16

public class ObjectUtil

{

   /// <summary>

   /// 获取某个对象中的属性值

   /// </summary>

   /// <param name="info"></param>

   /// <param name="field"></param>

   /// <returns></returns>

   public static object GetPropertyValue(object info, string field)

   {

       if (info == null) return null;

       Type t = info.GetType();

       IEnumerable<System.Reflection.PropertyInfo> property = from pi in t.GetProperties() where pi.Name.ToLower() == field.ToLower() select pi;

       return property.First().GetValue(info, null);

   }

}

另外(以下与上述无关)图表添加数据后绑定提示:

1

2

3

4

5

6

7

8

9

10

11

12

13

14

15

16

17

18

19

20

21

22

/// <summary>

/// 扬尘监测、噪音监测、温度检测、湿度监测

/// </summary>

/// <param name="_Chart"></param>

private void ChartTemperatureMethod(Chart _Chart)

{

    List<string> xData = new List<string>() {"0", "4:00", "8:00", "12:00", "16:00", "20:00", "24:00" };

    List<int> yData = new List<int>() { 0,21, 35, 48, 40, 27, 7 };

    List<int> yData1 = new List<int>() { 0,5, 18, 25, 68, 50, 30 };

    string iss = "#VALX";

    // 需要提示的信息

    chart1.Series["Series1"].ToolTip = "时间:#VALX\nPM2.5:#VALYug/m^3\tPM10:" + yData1[xData.IndexOf("#VALX") + 1] + "ug/m^3";

    // 标签显示 Inside:内部,Outside:外部,Disabled:禁用

    chart1.Series["Series1"]["PieLabelStyle"] = "Outside";

    chart1.Series["Series1"].Points.DataBindXY(xData, yData);

    // 需要提示的信息

    chart1.Series["Series2"].ToolTip = "时间:#VALX\nPM2.5:" + yData[xData.IndexOf("#VALX") + 1] + "ug/m^3\tPM10:#VALYug/m^3";

    // 标签显示 Inside:内部,Outside:外部,Disabled:禁用

    chart1.Series["Series2"]["PieLabelStyle"] = "Outside";

    chart1.Series["Series2"].Points.DataBindXY(xData, yData1);

}

您可能感兴趣的文章:


评论
添加红包

请填写红包祝福语或标题

红包个数最小为10个

红包金额最低5元

当前余额3.43前往充值 >
需支付:10.00
成就一亿技术人!
领取后你会自动成为博主和红包主的粉丝 规则
hope_wisdom
发出的红包
实付
使用余额支付
点击重新获取
扫码支付
钱包余额 0

抵扣说明:

1.余额是钱包充值的虚拟货币,按照1:1的比例进行支付金额的抵扣。
2.余额无法直接购买下载,可以购买VIP、付费专栏及课程。

余额充值