Python中使用Matplotlib注解绘制决策树图形
import matplotlib.pyplot as plt
decisionNode = dict(boxstyle="sawtooth", fc="0.8")
leafNode = dict(boxstyle="round4", fc="0.8")
arrow_args = dict(arrowstyle="<-")
def getNumLeafs(myTree):
"""
计算树的叶子节点数
:param myTree:传入的参数是一个字典类型的树结构
"""
numLeafs = 0
keysList=list( myTree.keys())
firstStr = keysList[0]
secondDict = myTree[firstStr]
for key in secondDict.keys():
if type(secondDict[key]).__name__=='dict':
numLeafs += getNumLeafs(secondDict[key])
else: numLeafs +=1
return numLeafs
def getTreeDepth(myTree):
"""
计算树的深度
:param myTree:传入的参数是一个字典类型的树结构
:return:返回各分支的深度最大值
"""
maxDepth = 0
keysList=list( myTree.keys())
firstStr = keysList[0]
secondDict = myTree[firstStr]
for key in secondDict.keys():
if type(secondDict[key]).__name__=='dict':
thisDepth = 1 + getTreeDepth(secondDict[key])
else: thisDepth = 1
if thisDepth > maxDepth: maxDepth = thisDepth
return maxDepth
def plotNode(nodeTxt, centerPt, parentPt, nodeType):
"""
matplotlib的手册见网址:https://matplotlib.org/stable/api/pyplot_summary.html
Matplotlib提供了一个注解工具annotate()具体参数含义:https://matplotlib.org/stable/api/_as_gen/matplotlib.pyplot.annotate.html
利用添加文本注释的方式来绘制节点和箭头(箭头作为分支)
:param nodeTxt:要生成的节点的文本
:param centerPt:文本的坐标
:param parentPt:父节点的坐标
:param nodeType:节点类型
"""
createPlot.ax1.annotate(nodeTxt, xy=parentPt, xycoords='axes fraction',
xytext=centerPt, textcoords='axes fraction',
va="center", ha="center", bbox=nodeType, arrowprops=arrow_args )
"""
xycoords='axes fraction' 坐标从左下角以小数的形式体现坐标位置,如果xycoords='axes pixels'则以像素的形式体现坐标位置,则可能图形缩放时会出现问题
va="center", ha="center", bbox=nodeType, arrowprops=arrow_args
:va="center"和ha="center"分别设置垂直和水平对齐方式为居中,bbox=nodeType设置节点的边框样式,根据传入的nodeType,可以是决策节点或叶子节点的样式
arrowprops=arrow_args 使用全局变量,定义箭头类型为<-
"""
def plotMidText(cntrPt, parentPt, txtString):
"""
def plotMidText(cntrPt, parentPt, txtString)::定义了一个名为plotMidText的函数,用于在两个点(cntrPt和parentPt)之间的中间位置添加文本。
xMid = (parentPt[0]-cntrPt[0])/2.0 + cntrPt[0]:计算文本在x轴方向的中间位置坐标。
yMid = (parentPt[1]-cntrPt[1])/2.0 + cntrPt[1]:计算文本在y轴方向的中间位置坐标。
createPlot.ax1.text(xMid, yMid, txtString, va="center", ha="center", rotation=30):在计算得到的中间位置(xMid, yMid)添加文本txtString,va="center"和ha="center"设置垂直和水平对齐方式为居中,rotation=30设置文本旋转 30 度。
"""
xMid = (parentPt[0]-cntrPt[0])/2.0 + cntrPt[0]
yMid = (parentPt[1]-cntrPt[1])/2.0 + cntrPt[1]
createPlot.ax1.text(xMid, yMid, txtString, va="center", ha="center", rotation=30)
def plotTree(myTree, parentPt, nodeTxt):
numLeafs = getNumLeafs(myTree)
depth = getTreeDepth(myTree)
keysList=list( myTree.keys())
firstStr = keysList[0]
"""
上次叶子节点x坐标:plotTree.xOff
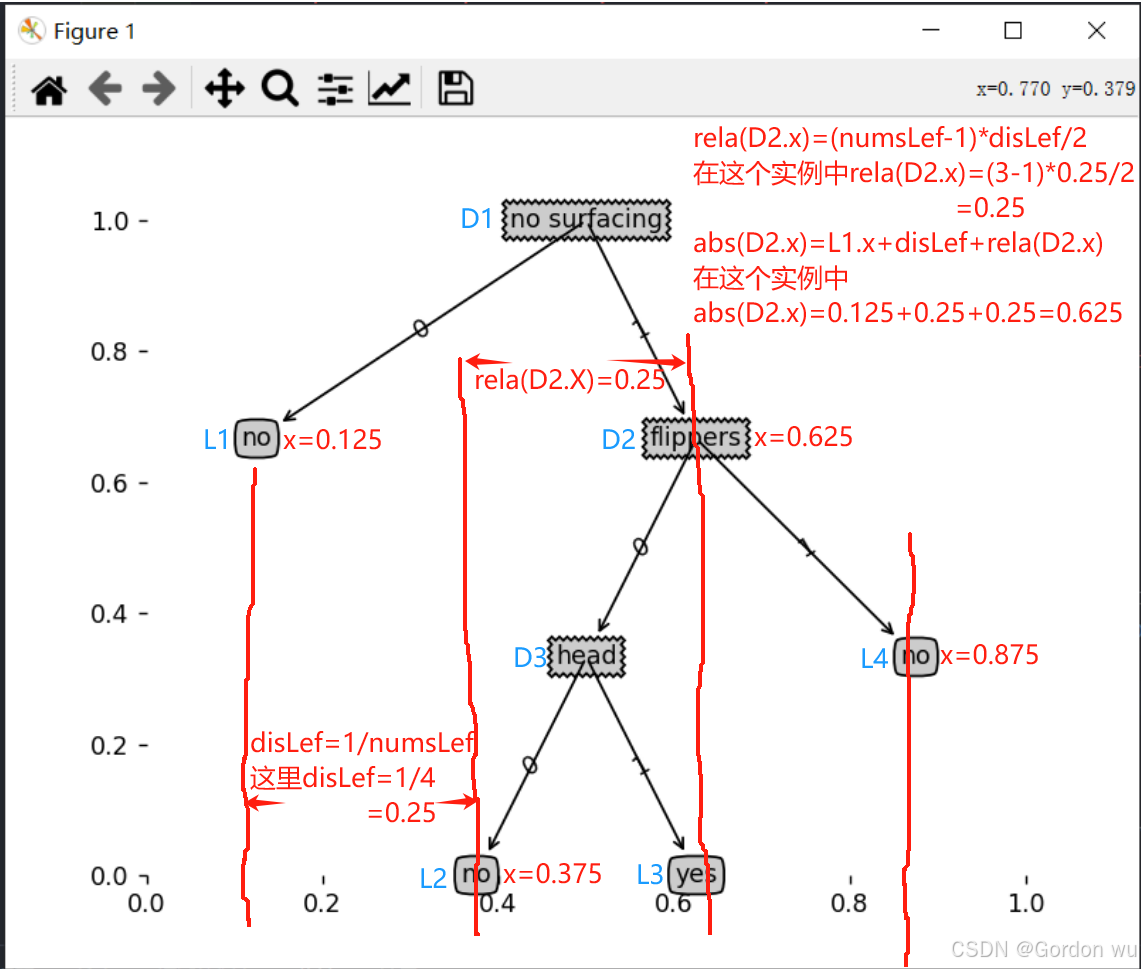
按叶子节点的总数等分划分x轴,则每个叶子节点间的距离为:disLef=1.0/numLeafs
则当前decisionNode节点x坐标绝对位置:cntx=plotTree.xOff + disLef + (numLeafs-1)*disLef/2
(numLeafs-1)*disLef/2 当前decisionNode节点节点总是位于它的第一个叶子和最后一个叶子的x坐标中间,假如有numLeafs个叶子,则最后
一个叶子与第一个叶子之间有numLeafs-1段间隔,而每段间隔的距离是disLef,则最后一个叶子与第一个叶子间的距离是(numLeafs-1)*disLef,
这时我们可以计算出当前decisionNode节点相对于它的一个叶子节点的相对距离为(numLeafs-1)*disLef/2,因为decisionNode节点总是位于
第一个节点与最后一个节点中间。
又因为当前decisionNode节点的第一个叶子节点的x坐标与上个叶子节点x坐标为disLef,所以当前当前decisionNode节点第一个叶子节点的
x坐标绝对位置=plotTree.xOff + disLef ,于是当前decisionNode节点x坐标绝对位置cntx=cntx=plotTree.xOff + disLef + (numLeafs-1)*disLef/2
将disLef换为1.0/numLeafs 则有cntx=cntx=plotTree.xOff + 1.0/numLeafs + (numLeafs-1)/2/numLeafs
有cntx=cntx=plotTree.xOff +(2.0/2 + (numLeafs-1)/2)/numLeafs=plotTree.xOff +(1+numLeafs)/2/numLeafs
"""
cntrPt = (plotTree.xOff + (1.0 + float(numLeafs))/2.0/plotTree.totalW, plotTree.yOff)
plotMidText(cntrPt, parentPt, nodeTxt)
plotNode(firstStr, cntrPt, parentPt, decisionNode)
secondDict = myTree[firstStr]
plotTree.yOff = plotTree.yOff - 1.0/plotTree.totalD
for key in secondDict.keys():
if type(secondDict[key]).__name__=='dict':
plotTree(secondDict[key],cntrPt,str(key))
else:
plotTree.xOff = plotTree.xOff + 1.0/plotTree.totalW
plotNode(secondDict[key], (plotTree.xOff, plotTree.yOff), cntrPt, leafNode)
plotMidText((plotTree.xOff, plotTree.yOff), cntrPt, str(key))
plotTree.yOff = plotTree.yOff + 1.0/plotTree.totalD
def createPlot(inTree):
"""
定义createPlot函数,用于创建绘制决策树的图形环境并绘制决策树。
matplot手册:https://matplotlib.org/stable/api/_as_gen/matplotlib.pyplot.figure.html
"""
fig = plt.figure(1, facecolor='white')
fig.clf()
axprops = dict(xticks=[], yticks=[])
createPlot.ax1 = plt.subplot(111, frameon=False, **axprops)
plotTree.totalW = float(getNumLeafs(inTree))
plotTree.totalD = float(getTreeDepth(inTree))
plotTree.xOff = -0.5/plotTree.totalW; plotTree.yOff = 1.0;
plotTree(inTree, (0.5,1.0), '')
plt.show()
def retrieveTree(i):
"""
这是一个用于测试的数列表,包含2个树
"""
listOfTrees =[{'no surfacing': {0: 'no', 1: {'flippers': {0: 'no', 1: 'yes'}}}},
{'no surfacing': {0: 'no', 1: {'flippers': {0: {'head': {0: 'no', 1: 'yes'}}, 1: 'no'}}}}
]
return listOfTrees[i]
if __name__ =='__main__':
testTree=retrieveTree(1)
lefs=getNumLeafs(testTree)
dep=getTreeDepth(testTree)
print('Leaves:%s Depth:%s'%(lefs,dep))
createPlot(testTree)


 3578
3578


 到【灌水乐园】发言


