# coding:utf-8
# python 3.6
# OS windows
"""
Author: TYT
Date: 2019/01/04
Blog: https://blog.youkuaiyun.com/tianyutang777
"""
import numpy as np
import matplotlib.pyplot as plt
from pylab import *
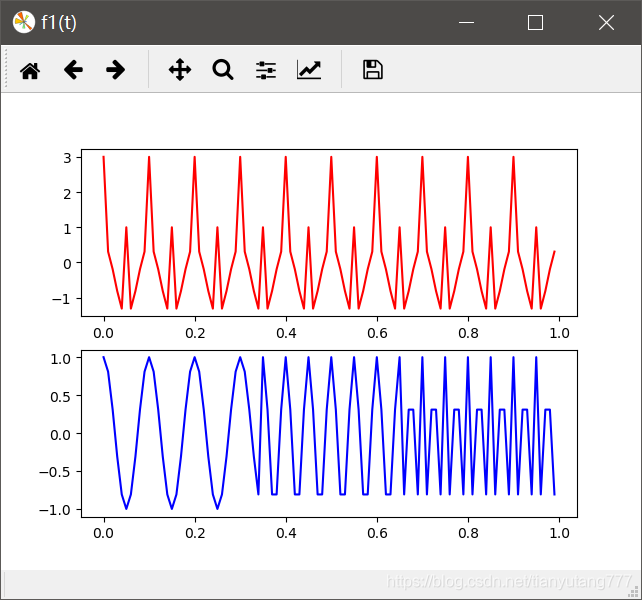
x = np.arange(0, 1.0, 0.01)
print (x)
#定义y1
y1 = np.cos(20*x*np.pi)+np.cos(40*x*np.pi)+np.cos(120*x*np.pi)
#定义y2
cond =[True if (i>0.35 and i<=0.65) else False for i in x]
y2 =cos(20*x*np.pi)*(x<0.35)+np.cos(40*x*np.pi)*cond+np.cos(120*x*np.pi)*(x>0.65)
#绘制
plt.figure(r'f1(t)')
plt.subplot(211)
plt.plot(x, y1,color='red')
plt.subplot(212)
plt.plot(x, y2,color='blue')
plt.show()


 3391
3391

 被折叠的 条评论
为什么被折叠?
被折叠的 条评论
为什么被折叠?
 到【灌水乐园】发言


