手写笔记
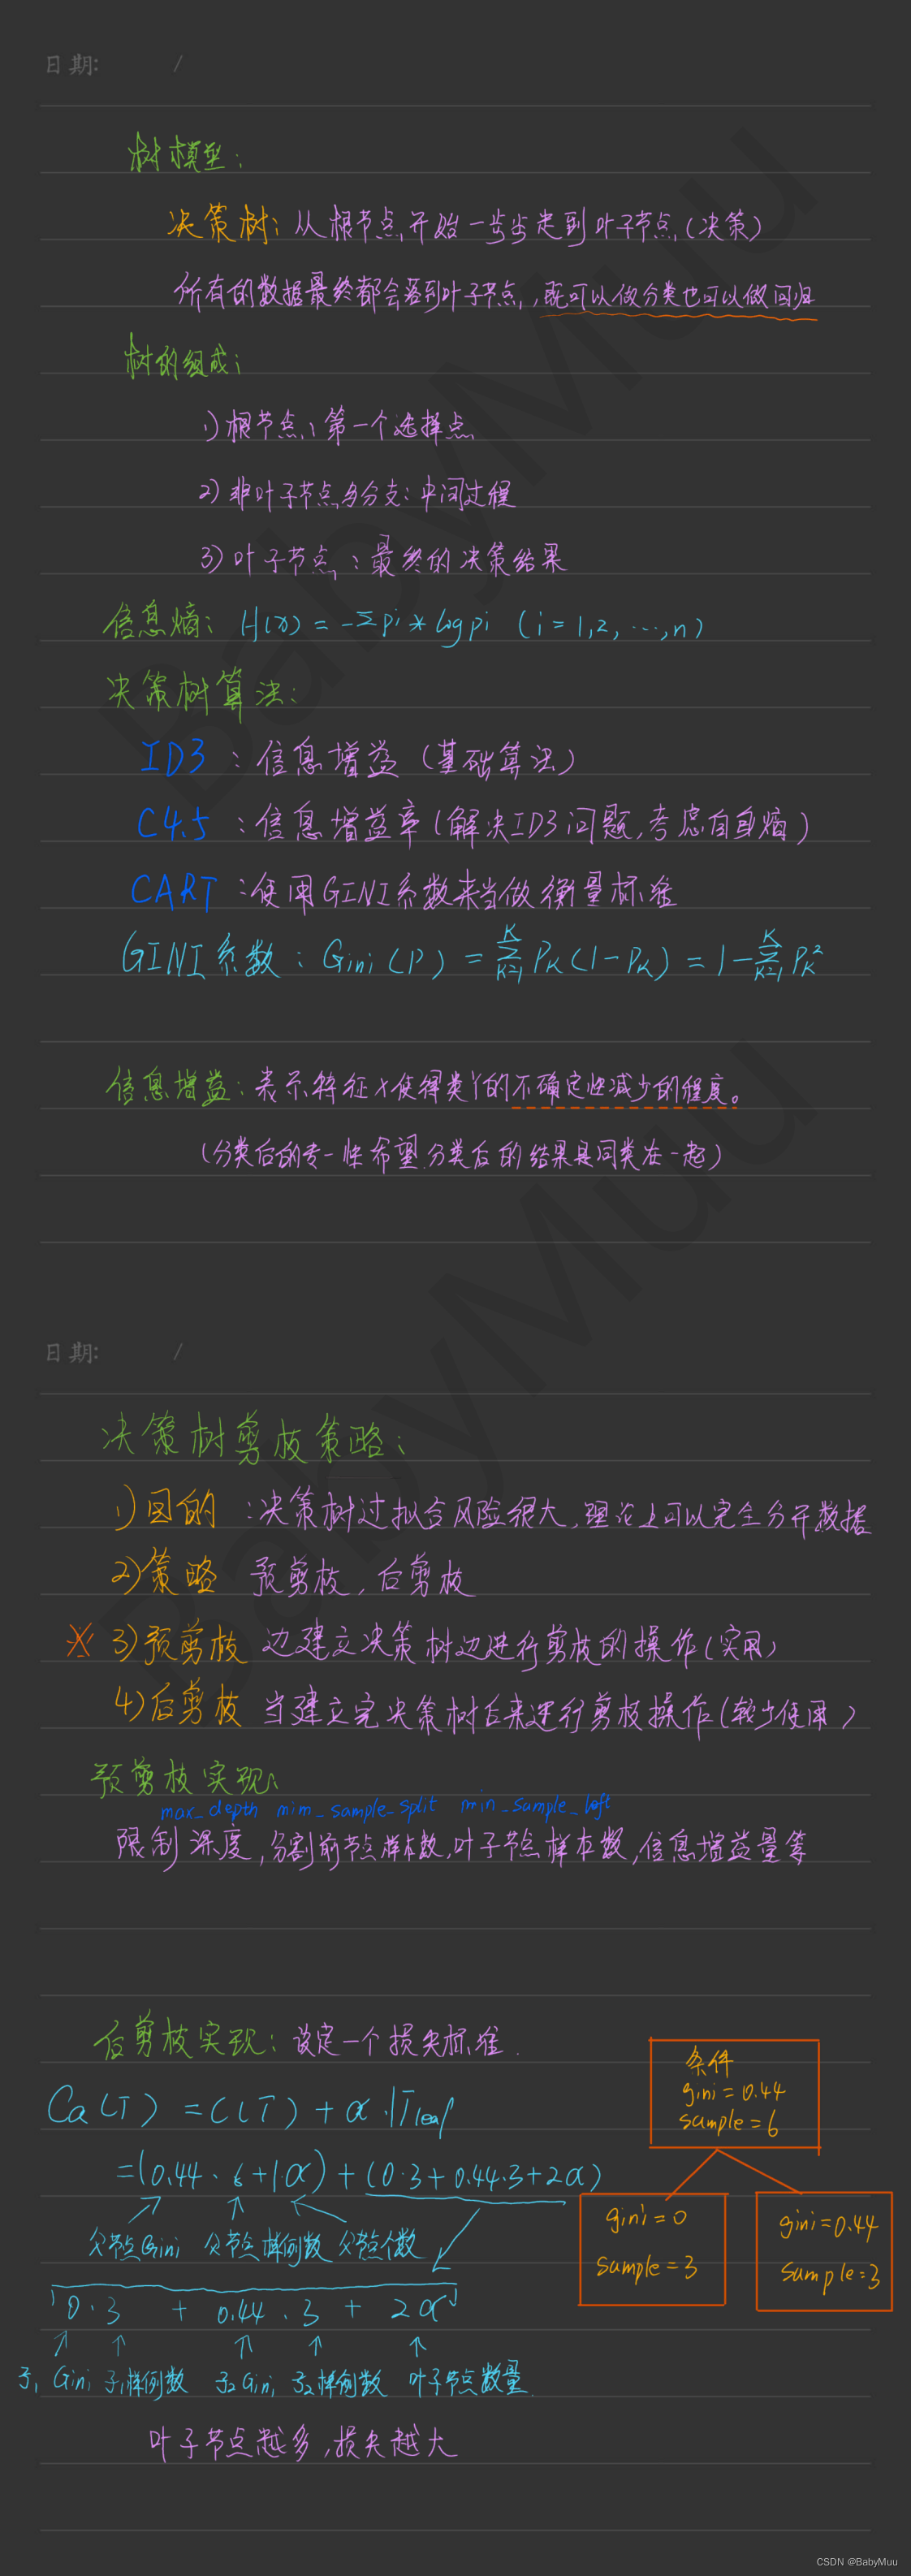
决策树算法实现
""" @File : DecisionTree
@Author : BabyMuu
@Time : 2022/4/12 13:00
"""
import pandas as pd
import numpy as np
class DecisionTree:
def __init__(self, feature, target, labels, max_depth=None):
""""""
self.feature = feature.copy()
self.target = target.copy()
self.labels = labels
self.feature_labels = []
self.tree_height = self.feature.shape[1]
if max_depth:
self.max_depth = max_depth
else:
self.max_depth = self.tree_height
self.tree = self.init(self.feature, self.target, self.labels)
def init(self, feature, target, labels):
"""创建决策树"""
if target.nunique() == 1:
return target.unique()[0]
if self.tree_height - feature.shape[1] == self.max_depth:
return self.majority_cnt(target)
best_feature_label = \
self.choose_best_feature(feature, target)
self.feature_labels.append(best_feature_label)
labels = labels.drop(best_feature_label)
cur_tree = {best_feature_label: {}}
unique_vals = feature[best_feature_label].unique()
for value in unique_vals:
index = feature[feature[best_feature_label] == value].index
f = feature[labels].loc[index]
t = target.loc[index]
cur_tree[best_feature_label][value] = self.init(f, t, labels)
return cur_tree
@staticmethod
def majority_cnt(target: pd.DataFrame):
"""计算当前节点中哪一个类别的比较多"""
return target.describe()['top']
def choose_best_feature(self, features, target: pd.DataFrame):
"""选择信息增益最高的特征"""
base_entropy = self.cal_entropy(target.value_counts())
print(base_entropy)
info_gain = self.cal_info_gain(features, target, base_entropy)
return sorted(info_gain, key=lambda x: info_gain[x], reverse=True)[0]
def cal_info_gain(self, features: pd.DataFrame, target, base_info_gain):
"""计算信息增益"""
features['target'] = target
label_counts = {}
feature_entropy = {}
for feature in features[features.columns.drop('target')]:
value_counts = features.groupby(feature)['target'].value_counts()
feature_unique = features[feature].unique().tolist()
label_counts[feature] = (value_counts, feature_unique)
features.drop(columns='target', inplace=True)
for feature in label_counts:
label_count, value_count = label_counts[feature]
entropy = 0
for value in value_count:
entropy += self.cal_entropy(
label_count[value]) * label_count[value].sum()
feature_entropy[feature] = \
base_info_gain - entropy / label_count.sum()
return feature_entropy
@staticmethod
def cal_entropy(target_count):
"""计算信息熵"""
value = target_count / target_count.sum()
print(value)
return -np.dot(np.log2(value), value.T)
决策树可视化
""" @File : draw_tree
@Author : BabyMuu
@Time : 2022/4/13 9:09
"""
import matplotlib.pyplot as plt
plt.rcParams['font.sans-serif'] = ['SimHei']
plt.rcParams['axes.unicode_minus'] = False
def getTreeSize(decisionTree):
nodeName = list(decisionTree.keys())[0]
nodeValue = decisionTree[nodeName]
leafNum = 0
treeDepth = 0
leafDepth = 0
for val in nodeValue.keys():
if type(nodeValue[val]) == dict:
leafNum += getTreeSize(nodeValue[val])[0]
leafDepth = 1 + getTreeSize(nodeValue[val])[1]
else:
leafNum += 1
leafDepth = 1
treeDepth = max(treeDepth, leafDepth)
return leafNum, treeDepth
decisionNodeStyle = dict(boxstyle="sawtooth", fc="0.8")
leafNodeStyle = {"boxstyle": "round4", "fc": "0.8"}
arrowArgs = {"arrowstyle": "<-"}
def plotNode(nodeText, centerPt, parentPt, nodeStyle):
createPlot.ax1.annotate(nodeText, xy=parentPt, xycoords="axes fraction",
xytext=centerPt
, textcoords="axes fraction", va="center",
ha="center", bbox=nodeStyle, arrowprops=arrowArgs)
def plotMidText(centerPt, parentPt, lineText):
xMid = (centerPt[0] + parentPt[0]) / 2.0
yMid = (centerPt[1] + parentPt[1]) / 2.0
createPlot.ax1.text(xMid, yMid, lineText)
def plotTree(decisionTree, parentPt, parentValue):
leafNum, treeDepth = getTreeSize(decisionTree)
plotTree.xOff = plotTree.figSize / (plotTree.totalLeaf - 1)
plotTree.yOff = plotTree.figSize / plotTree.totalDepth
nodeName = list(decisionTree.keys())[0]
centerPt = (plotTree.x + (leafNum - 1) * plotTree.xOff / 2.0, plotTree.y)
plotNode(nodeName, centerPt, parentPt, decisionNodeStyle)
plotMidText(centerPt, parentPt, parentValue)
treeValue = decisionTree[nodeName]
plotTree.y = plotTree.y - plotTree.yOff
for val in treeValue.keys():
if type(treeValue[val]) == dict:
plotTree(treeValue[val], centerPt, str(val))
else:
plotNode(treeValue[val], (plotTree.x, plotTree.y), centerPt,
leafNodeStyle)
plotMidText((plotTree.x, plotTree.y), centerPt, str(val))
plotTree.x = plotTree.x + plotTree.xOff
plotTree.y = plotTree.y + plotTree.yOff
def createPlot(decisionTree):
fig = plt.figure(1, facecolor="white")
fig.clf()
axprops = {"xticks": [], "yticks": []}
createPlot.ax1 = plt.subplot(111, frameon=False, **axprops)
plotTree.figSize = 1.0
plotTree.totalLeaf, plotTree.totalDepth = getTreeSize(decisionTree)
plotTree.x = 0
plotTree.y = plotTree.figSize
plotTree(decisionTree, (plotTree.figSize / 2.0, plotTree.y), "")
plt.show()
简单测试
""" @File   : demo1
    @Author : BabyMuu
    @Time   : 2022/5/6 13:01
"""
from pprint import pprint

import pandas as pd

from handwritten_algorithm_model.decision_tree.DecisionTree import DecisionTree
from handwritten_algorithm_model.template.draw.draw_tree import createPlot

data_path = '../_data/sales_data.xls'
data = pd.read_excel(data_path, index_col='序号')
feature = data[data.columns.drop('销量')]
target = data['销量']
tree = DecisionTree(feature, target, feature.columns)
pprint(tree.tree)
createPlot(tree.tree)
可视化结果
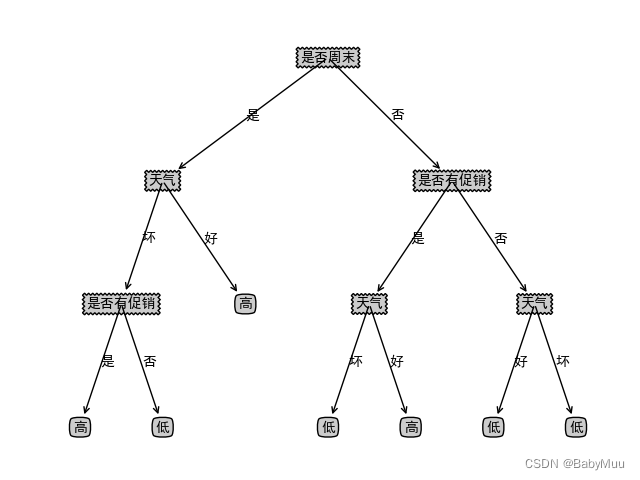


 本文详细介绍了如何使用决策树算法实现,并通过实例展示了如何构建决策树并进行可视化。通过决策树的选择最佳特征和信息增益计算,展示了其在数据分类中的应用过程。


 2156
2156

 被折叠的 条评论
为什么被折叠?
被折叠的 条评论
为什么被折叠?
 到【灌水乐园】发言


