


使用简单 python 脚本监控服务器应用的日志,通过日志增量来判断当前服务状态和应用压力。
实现思路:
> 思路很简单,监控应用的日志文件,定时读取行数,如果日志文件在单位时间行数增多,可以理解为当前服务的压力大,如果当前文件长时间没有日志增加,可以理解成服务出现假死,需要做下一步处理.
采集的数据,通过 http 接口发送到统计应用,再通过 grafana 展示图表.
代码如下:
```python
#coding=utf-8
import time
import json
import requests
# 启动脚本
# nohup python readLogFile.py > /dev/null 2>&1 &
#是否是第一次统计,1 是, 0:否
firstCount = 1
# 统计最新日志行数
def count_new_lines(file_path, last_position=0):
with open(file_path, 'r') as file:
file.seek(last_position)
lines = file.readlines()
new_position = file.tell()
return len(lines), new_position
# 监控日志
def monitor_file(file_path, interval=30):
global firstCount
last_position = 0
print("侦听文件启动...")
while True:
if firstCount==0:
time.sleep(interval)
new_lines, last_position = count_new_lines(file_path, last_position)
if new_lines == 0:
last_position=0
firstCount=1
print("最近{}秒,新增行={}...".format(interval,new_lines))
if firstCount == 0:
insertLog(new_lines)
firstCount = 0
# 调用远程 http 接口写入当前日志新增行数,这里可以根据自己的情况进行采集
def insertLog(new_lines):
params = {}
params['countNum'] = new_lines
params['ip'] = "输入应用所在服务器的 ip"
params['topic'] = "数据统计的 topi"
params['groupId'] = "数据统计的 groupId"
params['desc'] = '统计的描述'
paramsAll = {}
paramsAll['monitor_log'] = params
datastr = json.dumps(paramsAll)
response = requests.post('http://xxxx/abc/ccc/ddd/eeee/', data=datastr)
print response.content
if __name__ == "__main__":
# 替换为你的日志文件
file_path = '/aaaaaa/logs/xxxx.log'
monitor_file(file_path)
```
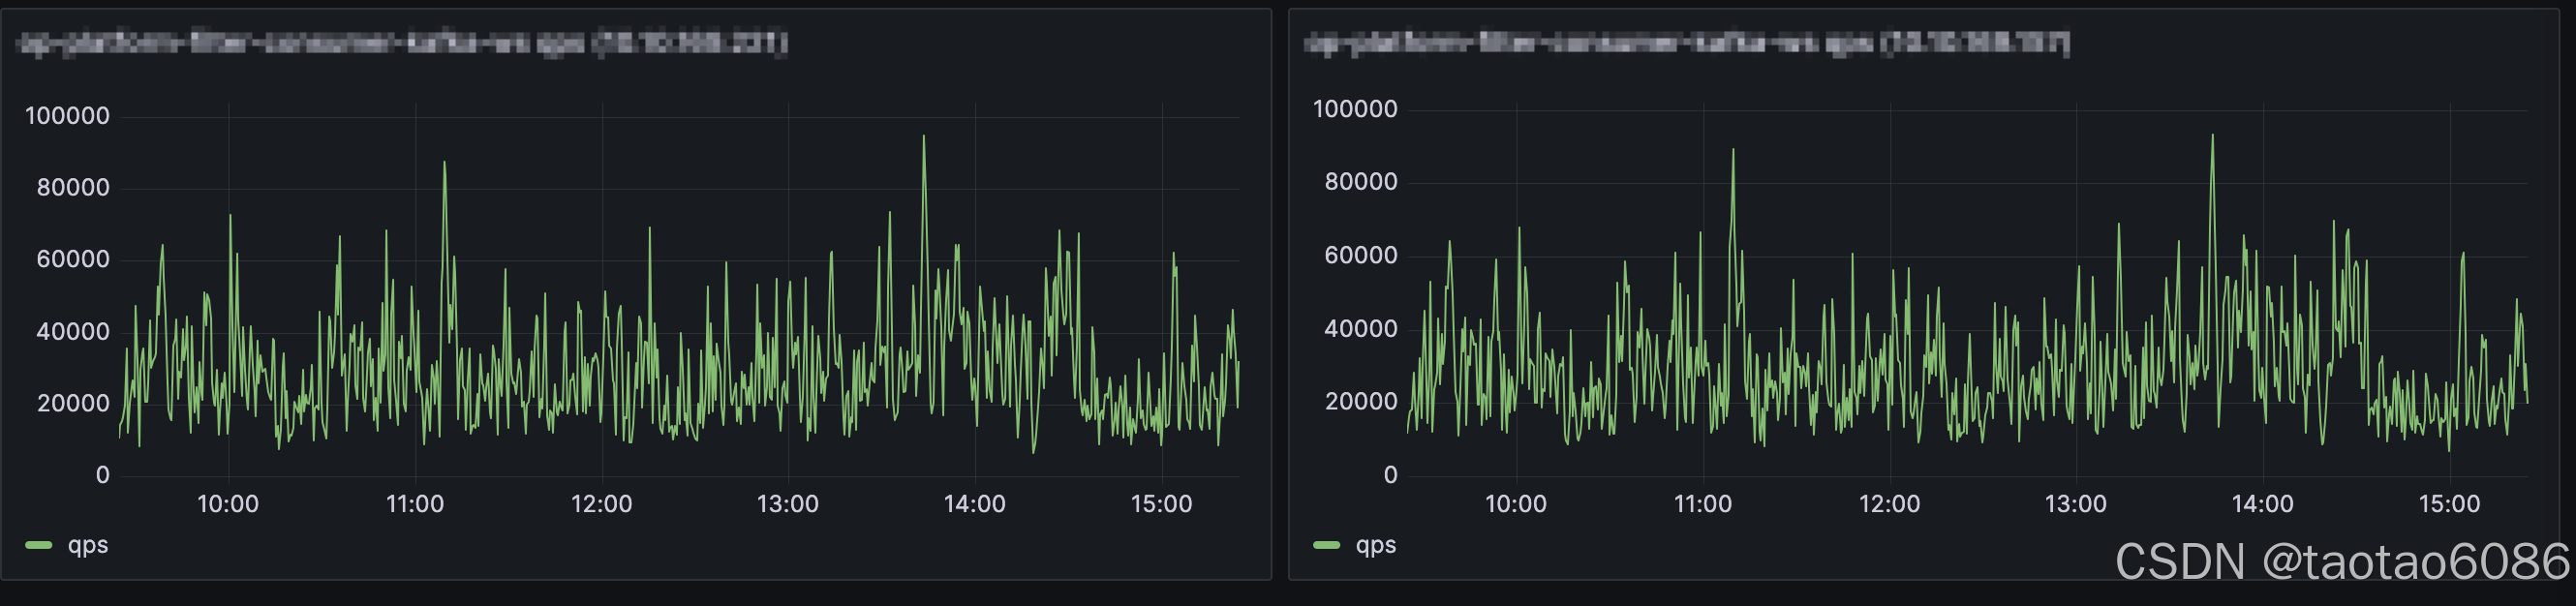
grafana 监控图表:


 95
95

 被折叠的 条评论
为什么被折叠?
被折叠的 条评论
为什么被折叠?
 到【灌水乐园】发言


