 K-means聚类算法的Python实现与讨论


 本文详细介绍了K-means聚类算法的原理和Python实现过程,包括算法的步骤、代码实现及可视化展示。通过实例展示了如何使用K-means将数据分为不同类别,并讨论了算法的敏感性和类数K的选择问题。
K-means 聚类算法——python实现
1. 聚类算法简介
聚类是把数据对象集划分成多个组或簇的算法,划分的结果是簇内的对象具有很高的相似性,而不同簇之间的对象差异比较大。聚类与分类最大的区别是,分类属于监督学习,划分的标准已知,而聚类是无监督学习,自动地发现分组,不需要提供类划分标准。
2. K-means 聚类
K-means 聚类算法是基于质心的划分方法,其核心思想通俗易懂:
①算法输入:k-簇的数目,D-数据集;
②算法流程:
(1)初始化:从D中随机选择k个对象作为初始簇中心;
(2)repeat
(3) 将每个对象分配到最相似的簇中;
(4) 重新计算每个簇中对象的均值,作为新的簇中心;
(5)until k个簇的中心不再发生变化。
③算法输出:k个簇的集合;
3. python实现
# -*- coding: utf-8 -*-
import pandas as pd
import random
import math
import matplotlib.pyplot as plt
from matplotlib.pylab import mpl
import numpy as np
mpl.rcParams['font.sans-serif'] = ['SimHei']  # 添加这条可以让图形显示中文

def calDistance(centers,nodes):
    '''
    计算节点间距离
    输入:centers-中心,nodes-节点;
    输出:距离矩阵-dis_matrix
    '''
    dis_matrix = pd.DataFrame(data=None,columns=range(len(centers)),index=range(len(nodes)))
    for i in range(len(nodes)):
        xi,yi = nodes[i][0],nodes[i][1]
        for j in range(len(centers)):
            xj,yj = centers[j][0],centers[j][1]
            dis_matrix.iloc[i,j] = round(math.sqrt((xi-xj)**2+(yi-yj)**2),2)

    return dis_matrix

def scatter_diagram(clusters,nodes):
    '''
    #画路径图
    输入:nodes-节点坐标;
    输出:散点图
    '''
    for cluster in clusters:
        x,y= [],[]
        for Coordinate in cluster:
            x.append(Coordinate[0])
            y.append(Coordinate[1])
        plt.scatter(x, y,alpha=0.8,)
    plt.xlabel('x')
    plt.ylabel('y')
    plt.show()

def distribute(center,nodes,K):
    '''
    将节节点分给最近的中心
    输入:center-中心,nodes-节点,K-类数量
    输出:新的簇-clusters
    '''
    clusters = [[] for i in range(K)]
    dis_matrix = calDistance(center,nodes)
    for i in range(len(nodes)):
        node = nodes[i]
        min_index = list(dis_matrix.loc[i,:]).index(dis_matrix.loc[i,:].min())
        clusters[min_index].append(node)

    return clusters

def cal_center(clusters):
    '''
    计算簇的中心
    输入:clusters-类坐标;
    输出:簇中心-new_center
    '''
    new_center = []
    for cluster in clusters:
        x,y= [],[]
        for Coordinate in cluster:
            x.append(Coordinate[0])
            y.append(Coordinate[1])
        x_mean = np.mean(x)
        y_mean = np.mean(y)
        new_center.append((round(x_mean,2),round(y_mean,2)))

    return new_center

if __name__ == "__main__":
    #输入数据
    nodes = [(11, 36),(13, 35),(10, 20),(25, 22),(15, 11),(16, 24),(14, 30),(16, 32),(26, 10),(27, 31),(22, 29),(1, 29),(20, 29),(17, 15),(5, 38),
             (7, 15),(22, 20),(4, 13),(4, 22),(12, 18),(23, 12),(25, 15),(5, 13),(9, 27),(17, 36),(2, 14),(1, 16),(7, 15),(25, 15),(19, 26),(25, 40),
             (26, 34),(25, 35),(2, 36),(29, 24),(17, 17),(8, 26),(4, 14),(5, 25),(6, 37),(1, 16),(6, 39),(11, 13),(10, 20),(21, 11),(5, 19),(5, 35),(1, 34),
             (16, 39),(19, 24),(39, 31),(49, 31),(41, 45),(31, 33),(32, 40),(35, 33),(31, 39),(34, 48),(42, 32),(32, 35),(35, 33),(35, 34),(43, 41),(35, 47),
             (49, 36),(37, 41),(43, 46),(41, 41),(45, 50),(41, 35),(45, 44),(41, 30),(43, 33),(31, 45),(48, 32),(39, 49),(38, 42),(33, 39),(49, 33),(43, 44),
             (32, 30),(40, 47),(36, 46),(47, 47),(37, 33),(35, 31),(42, 38),(43, 44),(40, 47),(30, 30),(37, 34),(41, 45),(37, 33),(42, 39),(43, 43),(50, 43),
             (31, 45),(35, 41),(32, 41),(31, 30)]
    scatter_diagram([list(nodes)],nodes)#画图

    #参数
    K = 3  #簇的数量

    #初始化随机生成簇中心
    index = random.sample(list(range(len(nodes))),K)
    center = [nodes[i] for i in index]

    while True:
    # 节点——> 簇
        clusters = distribute(center,nodes,K)
        new_center = cal_center(clusters)
        if center == new_center:#中心不再变化时退出循环
            break
        center = new_center.copy()

    scatter_diagram(clusters,nodes)#画图
【结果展示】

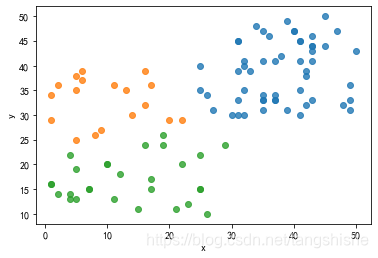


4 谈论
K-means 算法计算确实方便,算法也容易理解,不足之处在于算法对随机初始中心比较敏感,不同初始中心会导致聚类效果存在差别,而且类数K需要给定,难以确定分多少类的聚类效果是最好的,大概只能引入相关指标,对不同类数下的指标表现进行对比。


 10万+
10万+

 被折叠的 条评论
为什么被折叠?
被折叠的 条评论
为什么被折叠?
 到【灌水乐园】发言


