


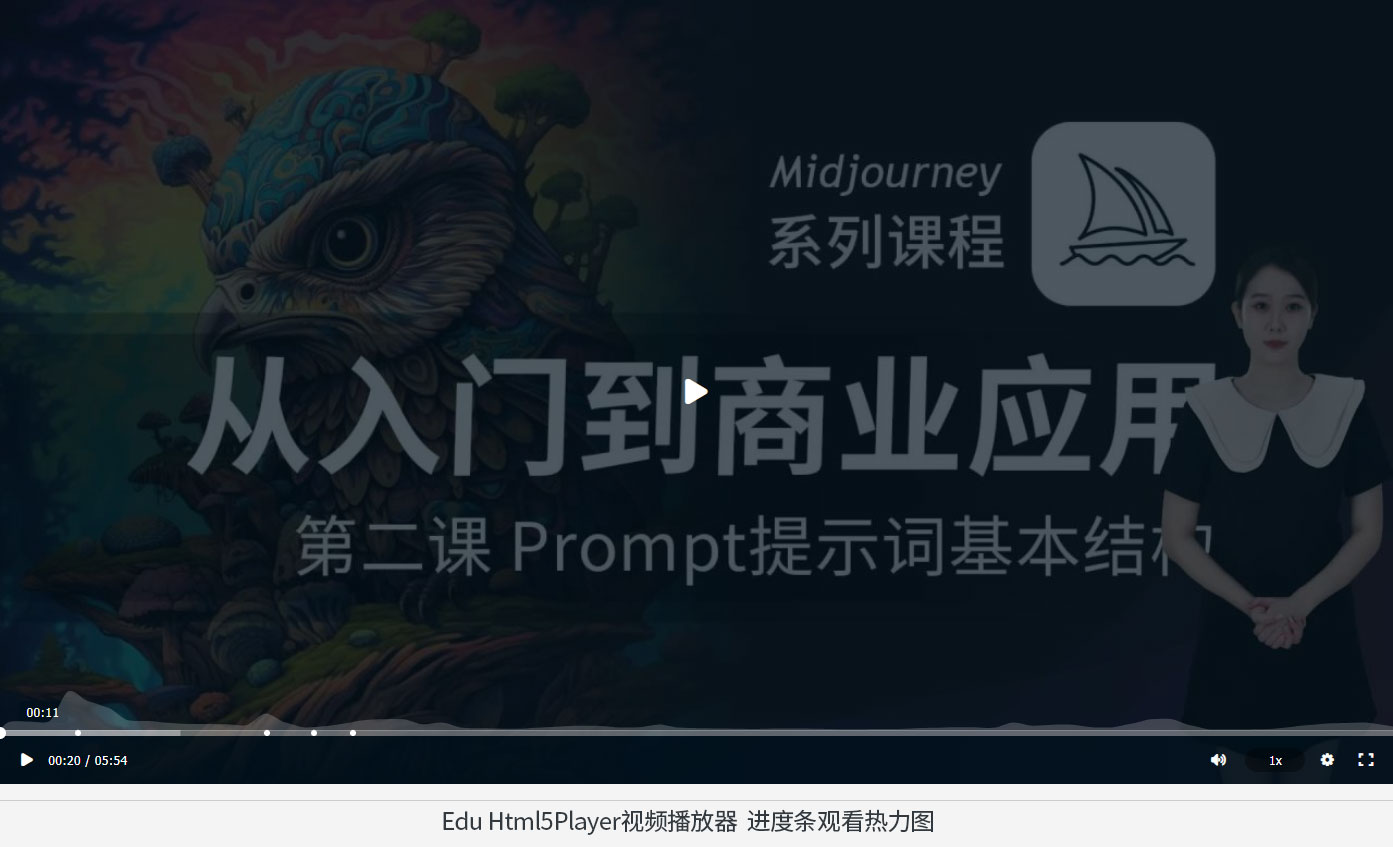
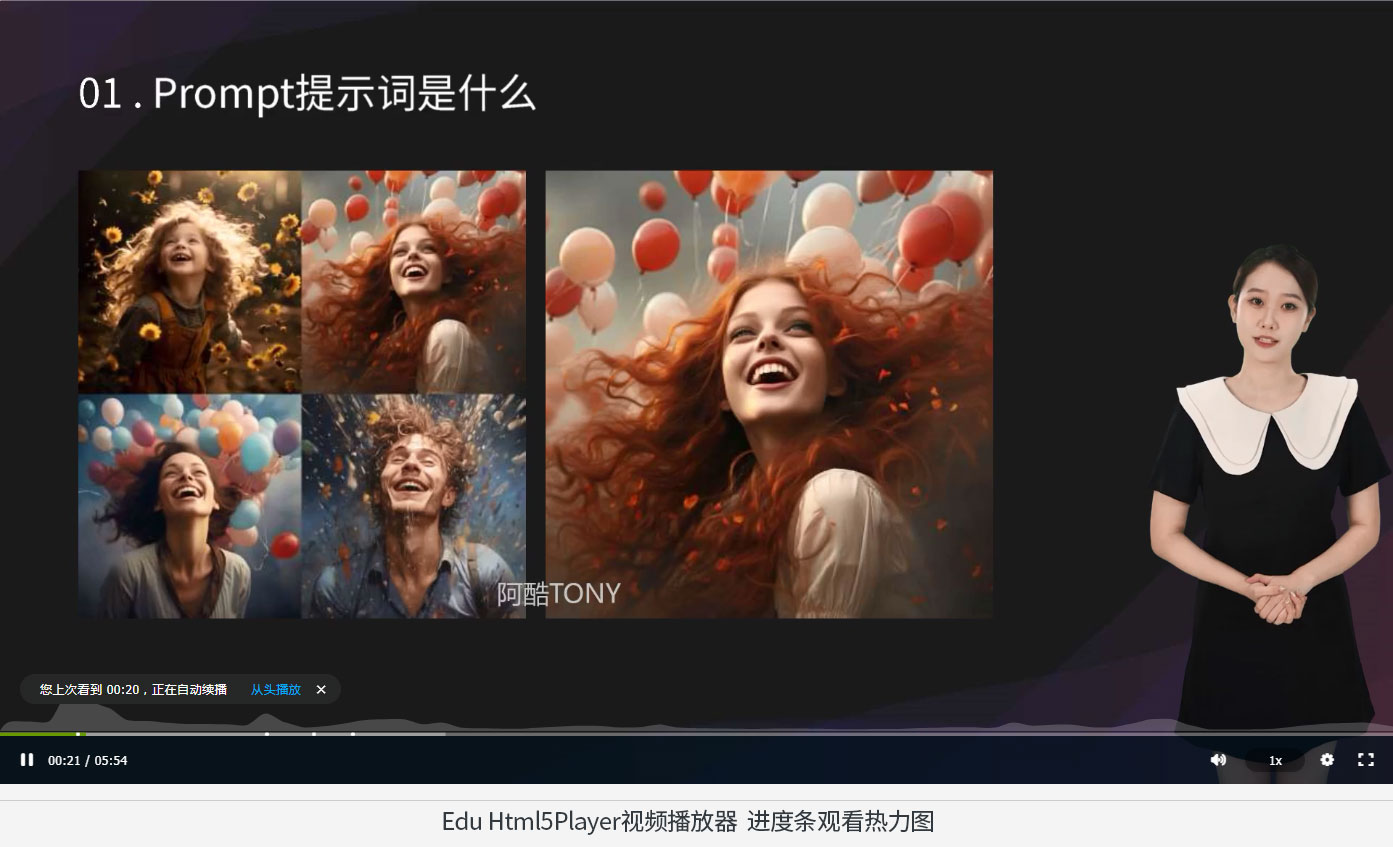
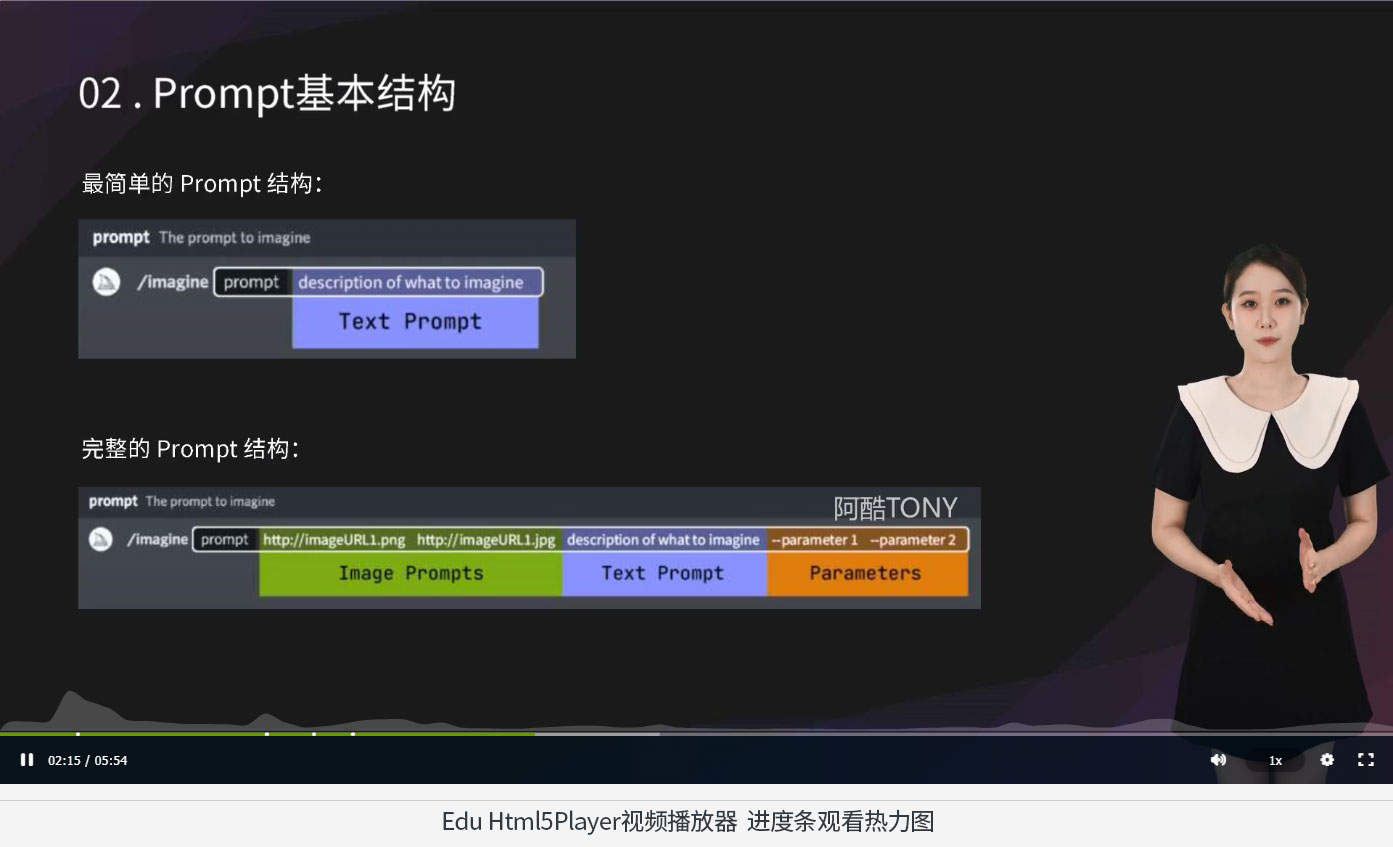
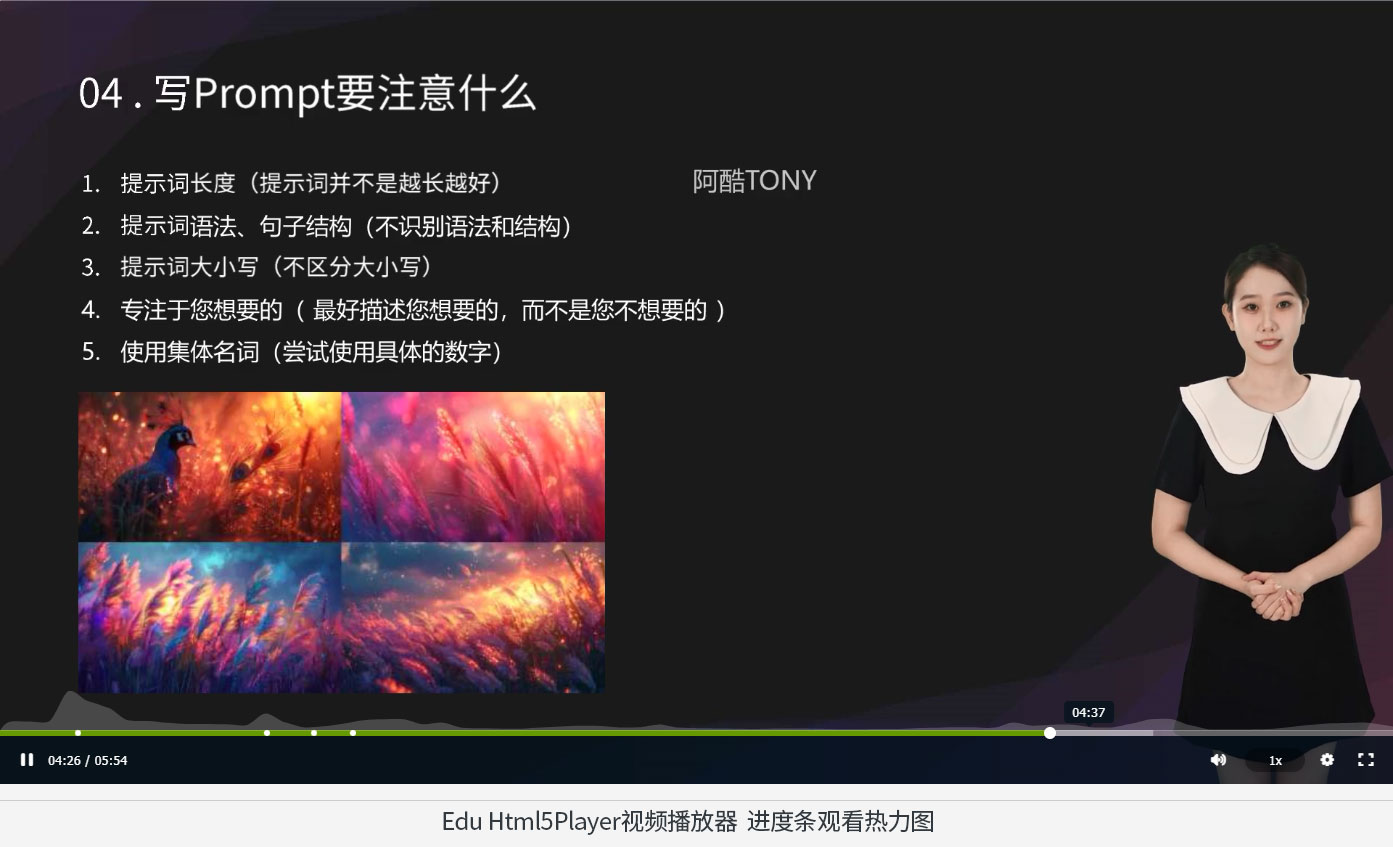
( 注意图中进度条上方的播放热力图 )
视频播放热力图的实现代码及其应用价值。热力图可以应用于视频推广策略中,以提高完播率和转化率。例如,通过观察热力图,可以识别出视频开头部分是否具有足够的吸引力,以及是否有特定的片段引起观众的兴趣。此外,热力图还可以用于视频内容的分析,比如在教育视频中,热力图可以显示哪些知识点最受学生关注,从而指导内容的调整和优化。
通过JavaScript代码示例展示了如何集成热力图功能到视频播放器中,使用色彩渐变(红表示高关注度,蓝表示低关注度)来可视化观众观看行为。热力图可帮助分析视频吸引力分布,识别观众兴趣点,优化视频内容结构,提升完播率和转化率,在教育、营销等领域均有重要应用价值。
我做的演示实例效果:视频热力图,播放器进度条上方实现播放热力图功能
视频播放热力图(播放器进度条热力图)的实例代码参考:
<script src="https://player.polyv.net/resp/vod-player/latest/player.js"></script>
  <script>
    function getHeatPoints() {
      return [9592, 9692, 10063, 41138, 30485, 23905, 10966.5, 10316.5, 8533.5, 7249, 7181, 6813, 5929, 18046.5,  8817, 3684.5, 4863.5, 7818, 11122, 11977.5, 12045.5, 6882, 8616, 3389.5, 2791.5, 2378, 2415, 3561.5, 4563.5, 5351, 5166, 3649.5, 3817.5, 6808, 3503, 2831.5, 2617.5, 2401, 2149, 2478.5, 2498.5, 2311.5, 1843.5, 1800, 2101, 2002.5, 2882.5, 3380, 3880, 3966, 3257, 8804, 5440, 6468, 6432, 3885, 3611, 7348, 11954, 12317, 5834, 1549.5, 1658.5, 1649, 2053, 3831.5, 6050.5, 7764, 8290, 8549, 5757, 1898, 1393, 1263.5, 1356.5, 2841, 5774, 4294, 1798, 1260.5];
    }
    // 创建热力图节点
    const $heatMap = document.createElement('div');
    $heatMap.classList.add('heat-map');

    /**
     * 初始化热力图组件
     * 示例使用的 PPBar 来实现,仓库链接:https://www.npmjs.com/package/ppbar
     * 也可以自行实现热力图效果或者其他第三方仓库实现
    */
    const bar = new ppbar.ProgressBar($heatMap);
    var pdiv = document.getElementById("player");
      var w = pdiv.offsetWidth;    // 返回元素的总宽度
      var h = pdiv.offsetWidth*0.5625;    // 返回元素的总高度

    const player = polyvPlayer({
      wrap: '#player',
      width: '100%',
      height: h, df: 3, autoplay: 'true',
      vid: 'b5487973205af63cc2afe3bf58cb3b90_b',
      //vid: '88083abbf5b42072ec029201d9fee095_8',

      /**
       * 传入参数 progressSlot,参数类型是 HTMLElement
       * 传入后会将该节点添加到进度条控件里面,样式可参考页面的设置或根据实际调整
      */
      progressSlot: $heatMap,
      videoKeyframes: [
        {
          keycontext: '打点1',
          keytime: 20,
        },
        {
          keycontext: '保利威',
          btnDesc: '前往',
          btnHref: 'https://www.polyv.net/',
          keytime: 68,
        },
        {
          keycontext: '打点3',

          keytime: 80,
        },
        {
          keycontext: '打点4',
          keytime: 90,
        }
      ]
      // hideControlBar: true,
    });

    // 播放器初始化完成,更新热力图数据,切换视频会再次触发
    player.on('s2j_onPlayerInitOver', () => {
      const duration = player.j2s_getDuration();
      // 参数参考 https://www.npmjs.com/package/ppbar#heatmap
      bar.updateConfig({
        duration: duration,
        heatMap: {
          points: getHeatPoints(),
          defaultDuration: 5,
        }
      });
    });

    // 保利威播放器控制栏显示则显示热力图
    player.on('controlShow', () => {
      $heatMap.classList.remove('hide');
    });

    // 控制栏隐藏则隐藏热力图
    player.on('controlHide', () => {
      $heatMap.classList.add('hide');
    });

    document.getElementById('switchMedia').addEventListener('click', () => {
      player.changeVid('88083abbf5b42072ec029201d9fee095_8');
    });
  </script>
视频播放热力图,又称视频热图,是一种可视化工具,用于分析和展示用户在观看视频时的行为模式和关注度分布。它通过色彩渐变来表示用户点击或关注的密集程度,红色通常代表高关注度区域,而蓝色则代表低关注度区域。这种图可以帮助视频制作者和营销人员了解视频哪些部分吸引观众,哪些部分可能需要优化。
( 注意图中进度条上方的播放热力图 )
Install
npm i ppbar
or via CDN
<link rel="stylesheet" href="https://unpkg.com/ppbar@latest/dist/index.min.css">

<script src="https://unpkg.com/ppbar@latest/dist/index.min.js"></script>

<script>
  console.log(ppbar)
</script>
Usage
The first step is to import the ProgressBar class and the style of ppbar.
import ProgressBar from 'ppbar';
import 'ppbar/dist/index.min.css';

const div = document.createElement('div');
const bar = new ProgressBar(div, {
  // config
})

document.body.appendChild(div)
The ProgressBar constructor accepts two parameters, the first is its container, and the second is the config for ppbar. Setting the first parameter will automatically add the ppbar's DOM element to the incoming container.
Of course, if you want to manually add the DOM element of ppbar, you can set the first parameter to undefined.
import ProgressBar from 'ppbar';
import 'ppbar/dist/index.min.css';

const bar = new ProgressBar(undefined, {
  // config
})

document.body.appendChild(bar.el)
ppbar has an updateConfig method that can be used to dynamically update config at any time.
import ProgressBar from 'ppbar';
import 'ppbar/dist/index.min.css';

const bar = new ProgressBar(undefined, {
  // config
})

document.body.appendChild(bar.el)

bar.updateConfig({ /* new config */ })

// Destroy the bar object if you don't need it anymore
bar.destroy()
Chapter
Chapters can set the progress bar segmentation effect. Each chapter must have a title, which will be displayed when the mouse hovers the progress bar.
Chapters should have a time attribute, indicating the end of the chapter, the last chapter can omit the time attribute.
import ProgressBar from 'ppbar';
import 'ppbar/dist/index.min.css';

new ProgressBar(document.body, {
  chapters: [
    { time: 10, title: 'chapter1' },
    { time: 20, title: 'chapter2' },
    { title: 'chapter3' },
  ]
})
A total of 3 chapters are set above.
0s - 10schapter110s - 20schapter220s - durationchapter3
Marker
Markers allow you to place markers on the progress bar, each of which can be placed in a custom DOM or an image.
import ProgressBar from 'ppbar';
import 'ppbar/dist/index.min.css';

new ProgressBar(document.body, {
  markers: [
    { time: 10, title: 'marker1', image: './img.jpg', size: [30, 30] },
  ]
})
The above code sets a marker at the 10-second position of the progress bar. There is an image in the marker, and its size is 30x30.
In addition to images, you can also use custom dom elements.
import ProgressBar from 'ppbar';
import 'ppbar/dist/index.min.css';

const div = document.createElement('div')

new ProgressBar(document.body, {
  markers: [
    { time: 10, title: 'marker1', el: div },
  ]
})
The markerClick event is fired when a marker is clicked.
import { EVENT, ProgressBar } from 'ppbar'

const bar = new ProgressBar(document.body, {
  markers: [
    { time: 10, title: 'marker1' },
  ]
})

bar.on(EVENT.MARKER_CLICK, (marker) => console.log(marker))
HeatMa
Heatmaps are used to mark changes in the views of the entire video at different time periods. For example, the views from 0 to 5 seconds is 100, and the views from 5 to 10 seconds is 200... Then plotting these views into a curve is the heat map of ppbar.
const bar = new ProgressBar(document.body, {
  heatMap: {
    points: [1, 2, 3],
    defaultDuration: 5,
  }
})
The above code configuration indicates that the duration represented by each point is 5 seconds, that is, the value of 0 - 5 is 1, the value of 5 - 10 is 2, and the value of 10 - 15 is 3 .
In addition, it also supports to set the duration separately for each point.
const bar = new ProgressBar(document.body, {
  heatMap: {
    points: [{ duration: 10, score: 1 }, { score: 2 }, { duration: 2, score: 3 }],
    defaultDuration: 5,
  }
})
In the above configuration, the first and third have their own durations, and the second uses defaultDuration.
If you want the heatmap to be the same as Youtube, it will only be displayed on hover, you can set hoverShow.
const bar = new ProgressBar(document.body, {
  heatMap: {
    points: [1, 2, 3],
    defaultDuration: 5,
    hoverShow: true
  }
})
Thumbnail
Thumbnails are used to preview the footage at different points in the video. A thumbnail is formed by splicing multiple small thumbnails.
const bar = new ProgressBar(document.body, {
  thumbnail: {
    start: 0, // Start time,
    gap: 10, // Single small thumbnail duration
    row: 5, // The large thumbnail is composed of several lines of small thumbnails
    col: 5, // The large thumbnail is composed of several columns of small thumbnails
    width: 160, // Single small thumbnail width
    height: 90, // Single small thumbnail height
    images: [], // Thumbnail url array
  }
})
The values of the above config are all default config.
Also if you don't want to show thumbnails you can set it to false.
const bar = new ProgressBar(document.body, {
  thumbnail: false
})
Live
It also supports live mode. In live mode, the time display of the progress bar will be a negative number.
new ProgressBar(document.body, { live: true })
In addition, you can use the updateConfig method to dynamically turn on and off the live mode.
const bar = new Progress(document.body)

bar.updateConfig({ live: true })
热门原创推荐
- 无版权,全免费,请收藏这10个免费高清无权素材网站
- 常用照片尺寸对照表,照片大小看这个表就OK了
- 如何使用FTP上传文件(FTP文件传输)
- 在线视频加密播放(加密视频观看)操作教程完整版
- 企业公众号菜单添加视频的完整教程(组图)
AI工具类文章
- AI应用:mijdourney 如何写prompt
- Midjourney最基础的一些使用设置
- Gemini 前世今生全面的信息介绍
- AI视频成工具D-ID介绍(AI数字人常用工具)
- Midjourney Prompt的使用基本结构介绍
视频加密/防下载/防录屏


 761
761

 被折叠的 条评论
为什么被折叠?
被折叠的 条评论
为什么被折叠?
 到【灌水乐园】发言


