


YOLOv3: An Incremental Improvement
Joseph Redmon Ali Farhadi
University of Washington
好吧,整篇看起来并不是一篇论文,感觉就是一个随手写的文章,如果想要详细的了解YOLOV3,还是建议AB大神写的Darknet源码 https://github.com/AlexeyAB/darknet
Abstract
We present some updates to YOLO! We made a bunch of little design changes to make it better. We also trained this new network that’s pretty swell. It’s a little bigger than last time but more accurate. It’s still fast though, don’t worry. At 320 320 YOLOv3 runs in 22 ms at 28.2 mAP, as accurate as SSD but three times faster. When we look at the old .5 IOU mAP detection metric YOLOv3 is quite good. It achieves 57.9 AP50 in 51 ms on a Titan X, compared to 57.5 AP50 in 198 ms by RetinaNet, similar performance but 3.8 faster. As always, all the code is online at https://pjreddie.com/yolo/.
我们对 YOLO 进行了一些更新!我们在设计上做了一些小改动,使它变得更好。我们还训练了一个新的网络,它非常强大。在模型上,它比上次的大了一点,但更准确了,不过速度还是很快,不用担心。在 320×320 时,YOLOv3 以 28.2 mAP 在 22 毫秒内运行,与 SSD 一样精确,但速度快三倍。当我们使用旧的 0.5 IOU mAP 检测指标时,YOLOv3 的表现相当不错。在 Titan X 上,它在 51 毫秒内实现了 57.9 AP50,而 Retina Net 在 198 毫秒内实现了 57.5 AP50,性能相似,但快了 3.8 倍。一如既往,所有代码均可在 https://pjreddie.com/yolo/ 上在线查阅。
1 Introduction
Sometimes you just kinda phone it in for a year, you know? I didn’t do a whole lot of research this year. Spent a lot of time on Twitter. Played around with GANs a little. I had a little momentum left over from last year [12] [1]; I managed to make some improvements to YOLO. But, honestly, nothing like super interesting, just a bunch of small changes that make it better. I also helped out with other people’s research a little.
有时候,你会在一年里碌碌无为,你知道吗?今年我没做什么研究。在 Twitter 上花了很多时间。玩了一会儿 GANs。去年[12][1]我还有点余力;我设法对YOLO做了一些改进。不过,说实话,也没什么特别有意思的,只是做了一些让它变得更好的小改动。我还为其他人的研究提供了一些帮助。
Actually, that’s what brings us here today. We have a camera-ready deadline[4] and we need to cite some of the random updates I made to YOLO but we don’t have a source. So get ready for a TECH REPORT!
其实,这就是我们今天在这里的原因。我有一个截稿日期,需要引用我对《YOLO》进行的一些随机更新,但我们没有资料来源。所以,准备一下技术报告!
The great thing about tech reports is that they don’t need intros, y’all know why we’re here. So the end of this introduction will signpost for the rest of the paper. First we’ll tell you what the deal is with YOLOv3. Then we’ll tell you how we do. We’ll also tell you about some things we tried that didn’t work. Finally we’ll contemplate what this all means.
技术报告的好处是不需要前言,你们都知道我为什么在这。因此,本引言的结尾将为本文的其余部分指明方向。首先,我们会告诉大家 YOLOv3 是怎么回事。然后,我们将告诉大家我们是如何做的。我们还会告诉你我们尝试过的一些行不通的方法。最后,我们将思考这一切意味着什么。
 |
|---|
 |
2 The Deal
So here’s the deal with YOLOv3: We mostly took good ideas from other people. We also trained a new classifier network that’s better than the other ones. We’ll just take you through the whole system from scratch so you can understand it all.
所以,YOLOv3 的情况是这样的:我们主要从其他人那里汲取了好点子。我们还训练了一个新的分类器网络,它比其他网络更好。我们将带你从头开始了解整个系统,以便你能理解这一切。
2.1 Bounding Box Prediction
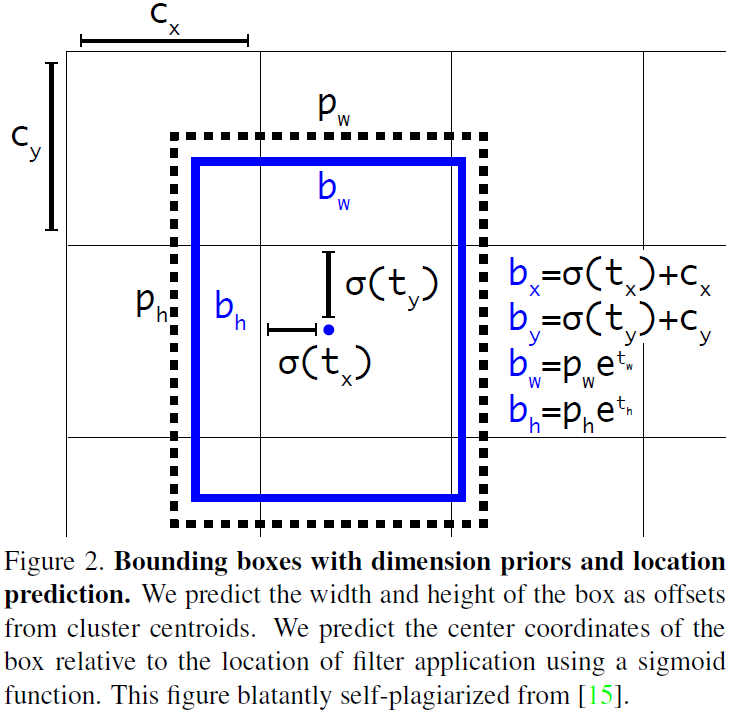
Following YOLO9000 our system predicts bounding boxes using dimension clusters as anchor boxes [15]. The network predicts 4 coordinates for each bounding box,$ t_x,t_y,t_w,t_h$. If the cell is offset from the top left corner of the image by (cx; cy) and the bounding box prior has width and height p w , p h p_w,p_h pw,ph, then the predictions correspond to:
继 YOLO9000 之后,我们的系统使用维度集群(使用k-means聚类方法在数据集上生成anchor)作为锚框预测边界框[15]。网络会为每个边框预测 4 个坐标:$ t_x,t_y,t_w,t_h$。如果单元格与图像左上角的偏移量为 (cx;cy),且边界框的宽度和高度为
p
w
,
p
h
p_w,p_h
pw,ph,则预测框对应的坐标为
b
x
=
σ
(
t
x
)
+
c
x
b
y
=
σ
(
t
y
)
+
c
y
b
w
=
p
w
e
t
w
b
h
=
p
h
e
t
h
b_x = \sigma(t_x) + c_x \\ b_y = \sigma(t_y) + c_y \\ b_w = p_we^{t_w} \\ b_h = p_he^{t_h}
bx=σ(tx)+cxby=σ(ty)+cybw=pwetwbh=pheth
During training we use sum of squared error loss. If the ground truth for some coordinate prediction is ^t* our gradient is the ground truth value (computed from the ground truth box) minus our prediction:$ \hat{t}-t$. This ground truth value can be easily computed by inverting the equations above.
在训练过程中,我们使用平方误差之和损失。如果某个坐标预测的地面真实值是 t ∗ ^t* t∗,我们的梯度就是地面真实值(由地面真实框计算得出)减去我们的预测值:$ \hat{t}-t$。这个地面真实值可以通过反演上面的等式轻松计算出来。
YOLOv3 predicts an objectness score for each bounding box using logistic regression. This should be 1 if the bounding box prior overlaps a ground truth object by more than any other bounding box prior. If the bounding box prior is not the best but does overlap a ground truth object by more than some threshold we ignore the prediction, following [17]. We use the threshold of .5. Unlike [17] our system only assigns one bounding box prior for each ground truth object. If a bounding box prior is not assigned to a ground truth object it incurs no loss for coordinate or class predictions, only objectness.
YOLOv3 使用逻辑回归法为每个边界框预测对象度得分。如果边界框先验值与地面实况对象的重叠程度大于任何其他边界框先验值,则分数应为 1。如果边界框先验值不是最好的,但与地面实况对象的重叠程度超过了某个阈值,我们就会忽略该预测框,具体做法与文献[17]相同。我们使用的阈值是0.5。与 [17] 不同的是,我们的系统只为每个地面实况对象分配一个边界框先验。如果没有为地面实况对象分配边界框先验,则不会造成坐标或类别预测的损失,只会造成对象性的损失。
2.2. Class Prediction
Each box predicts the classes the bounding box may contain using multilabel classification. We do not use a softmax as we have found it is unnecessary for good performance, instead we simply use independent logistic classifiers. During training we use binary cross-entropy loss for the class predictions.
每个预测框都会使用多标签分类来预测边界框可能包含的类别。我们没有使用软最大值,因为我们发现软最大值并不能带来良好的性能,相反,我们只使用了独立的逻辑分类器。在训练过程中,我们使用二元交叉熵损失来预测类别。
This formulation helps when we move to more complex domains like the Open Images Dataset [7]. In this dataset there are many overlapping labels (i.e. Woman and Person). Using a softmax imposes the assumption that each box has exactly one class which is often not the case. A multilabel approach better models the data.
当我们进入更复杂的领域(如开放图像数据集 [7])时,这种方法会有所帮助。在这个数据集中,有很多重叠的标签(如 "女人 "和 “人”)。使用 softmax 方法需要假设每个方框只有一个类别,而实际情况往往并非如此。多标签方法能更好地模拟数据。
2.3. Predictions Across Scales
YOLOv3 predicts boxes at 3 different scales. Our system extracts features from those scales using a similar concept to feature pyramid networks [8]. From our base feature extractor we add several convolutional layers. The last of these predicts a 3-d tensor encoding bounding box, objectness, and class predictions. In our experiments with COCO [10] we predict 3 boxes at each scale so the tensor is N × N × [ 3 × ( 4 + 1 + 80 ) ] N\times N\times [3\times (4+1+80)] N×N×[3×(4+1+80)] for the 4 bounding box offsets, 1 objectness prediction, and 80 class predictions.
YOLOv3 在 3 个不同尺度上预测框。我们的系统使用与特征金字塔网络[8]类似的概念从这些尺度上提取特征。我们从基础特征提取器中添加了几个卷积层。其中最后一层预测编码边框、对象性和类别预测的 3-D 张量。在 COCO [10] 的实验中,我们在每个尺度上预测 3 个边框,因此 4 个边框偏移、1 个对象性预测和 80 个类别预测的张量为 N × N × [ 3 × ( 4 + 1 + 80 ) ] N\times N\times [3\times (4+1+80)] N×N×[3×(4+1+80)]。
Next we take the feature map from 2 layers previous and upsample it by 2. We also take a feature map from earlier in the network and merge it with our upsampled features using concatenation. This method allows us to get more meaningful semantic information from the upsampled features and finer-grained information from the earlier feature map. We then add a few more convolutional layers to process this combined feature map, and eventually predict a similar tensor, although now twice the size.
接下来,我们提取前两层的特征图,并采用2倍上采样。我们还提取了网络早期的特征图,并使用连接法将其与高采样特征图合并。通过这种方法,我们可以从上采样的特征图中获得更有意义的语义信息,并从早期的特征图中获得更精细的信息。然后,我们再添加几个卷积层来处理这个合并的特征图,最终预测出一个类似的张量,虽然现在的张量是原来的两倍。
We perform the same design one more time to predict boxes for the final scale. Thus our predictions for the 3rd scale benefit from all the prior computation as well as finegrained features from early on in the network.
我们再进行一次同样的设计,以预测最终尺度的预测框。因此,我们对第三个尺度的预测得益于之前的所有计算以及网络早期的精细特征。
We still use k-means clustering to determine our bounding box priors. We just sort of chose 9 clusters and 3 scales arbitrarily and then divide up the clusters evenly across scales. On the COCO dataset the 9 clusters were: (10×13); (16×30); (33×23); (30×61); (62×45); (59×119); (116×90); (156×198); (373×326).
我们仍然使用 K 均值聚类来确定边界框先验。我们只是任意选择了 9 个聚类和 3 个尺度,然后在各个尺度之间平均分配聚类。COCO 数据集的 9 个聚类分别是 (10×13); (16×30); (33×23); (30×61); (62×45); (59×119); (116×90); (156×198); (373×326).
2.4. Feature Extractor
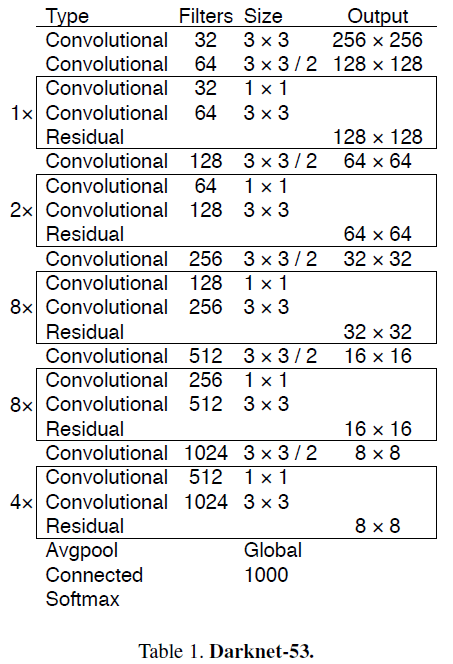
We use a new network for performing feature extraction. Our new network is a hybrid approach between the network used in YOLOv2, Darknet-19, and that newfangled residual network stuff. Our network uses successive 33 and 11 convolutional layers but now has some shortcut connections as well and is significantly larger. It has 53 convolutional layers so we call it… wait for it… Darknet-53!
我们使用一种新的网络来进行特征提取。我们的新网络是 YOLOv2、Darknet-19 和新式残差网络之间的混合方法。我们的网络连续使用了 33 层和 11 层卷积层,但现在也有了一些快捷连接,而且规模要大得多。它有 53 个卷积层,所以我们称之为… 等等… Darknet-53!
 |
|---|
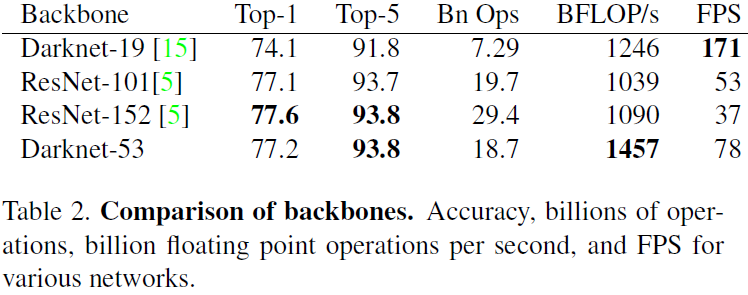
This new network is much more powerful than Darknet-19 but still more efficient than ResNet-101 or ResNet-152. Here are some ImageNet results:
这个新网络比 Darknet-19 强大得多,但仍比 ResNet-101和ResNet-152 高效。以下是一些 ImageNet 结果:
 |
|---|
Each network is trained with identical settings and tested at 256×256, single crop accuracy. Run times are measured on a Titan X at 256×256. Thus Darknet-53 performs on par with state-of-the-art classifiers but with fewer floating point operations and more speed. Darknet-53 is better than ResNet-101 and 1.5 faster. Darknet-53 has similar performance to ResNet-152 and is 2 faster.
每个网络都使用相同的设置进行训练,并在 256×256 的单精度下进行测试。运行时间是在Titan X 上测量256×256的图像。因此,Darknet-53 与最先进的分类器性能相当,但浮点运算更少,速度更快。Darknet-53 优于 ResNet-101,速度快 1.5倍。Darknet-53 的性能与 ResNet-152 相似,快 2 倍。
Darknet-53 also achieves the highest measured floating point operations per second. This means the network structure better utilizes the GPU, making it more efficient to evaluate and thus faster. That’s mostly because ResNets have just way too many layers and aren’t very efficient.
Darknet-53 还实现了最高的每秒浮点运算速度。这意味着该网络结构更好地利用了 GPU,使其评估效率更高,因此速度更快。这主要是因为 ResNets 的层数太多,效率不高。
2.5. Training
We still train on full images with no hard negative mining or any of that stuff. We use multi-scale training, lots of data augmentation, batch normalization, all the standard stuff. We use the Darknet neural network framework for training and testing [14].
我们仍然在完整图像上进行训练,没有硬性挖掘其他任何东西。我们使用多尺度训练、大量数据增强、批量归一化等所有标准方法。我们使用 Darknet 神经网络框架进行训练和测试 [14]。
3 How We Do
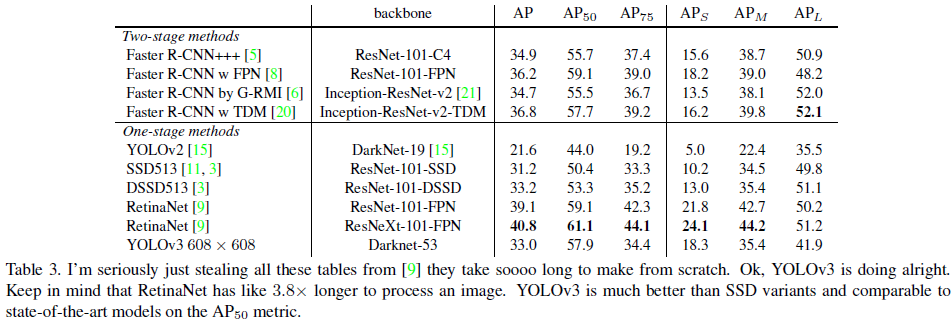
YOLOv3 is pretty good! See table 3. In terms of COCOs weird average mean AP metric it is on par with the SSD variants but is 3 faster. It is still quite a bit behind other models like Retina Net in this metric though.
YOLOv3 相当不错!见表 3。在 COCOs 怪异的平均平均 AP 指标方面,它与 SSD 版本相当,但速度快了 3 倍。不过,在这一指标上,它与 Retina Net 等其他机型仍有不小差距。
However, when we look at the “old” detection metric of mAP at IOU= .5 (or AP50 in the chart) YOLOv3 is very strong. It is almost on par with RetinaNet and far above the SSD variants. This indicates that YOLOv3 is a very strong detector that excels at producing decent boxes for objects. However, performance drops significantly as the IOU threshold increases indicating YOLOv3 struggles to get the boxes perfectly aligned with the object.
然而,当我们使用 IOU= .5 时的 mAP(或图表中的 AP50)这一 "老式 "检测指标时,YOLOv3 就显得非常强大。它几乎与 RetinaNet 不相上下,远远高于 SSD 变体。这表明 YOLOv3 是一个非常强大的检测器,擅长为物体生成像样的方框。然而,随着 IOU 临界值的增加,性能会明显下降,这表明 YOLOv3 难以使方框与物体完美对齐。
In the past YOLO struggled with small objects. However, now we see a reversal in that trend. With the new multi-scale predictions we see YOLOv3 has relatively high APS performance. However, it has comparatively worse performance on medium and larger size objects. More investigation is needed to get to the bottom of this.
过去,YOLO 在处理小物体时非常吃力。然而,现在我们看到这一趋势发生了逆转。通过新的多尺度预测,我们发现 YOLOv3 的 APS 性能相对较高。但是,它在中型和大型天体上的性能相对较差。我们需要进行更多的调查来找出原因。
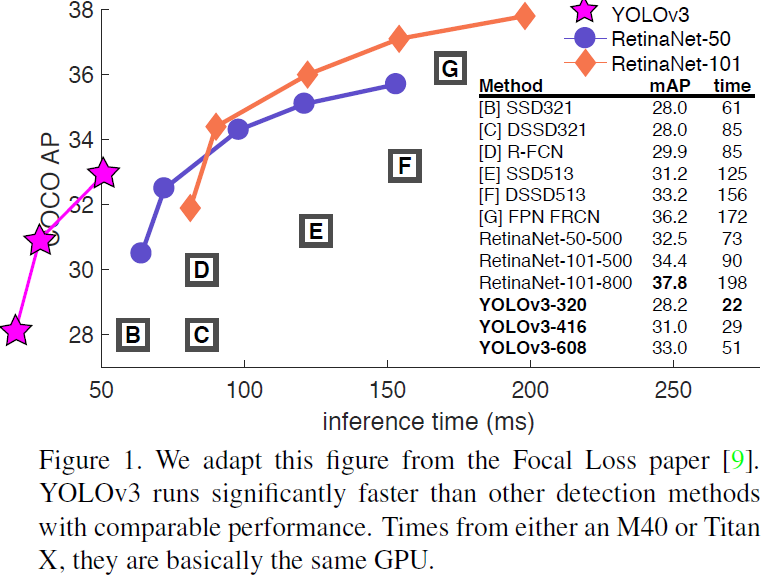
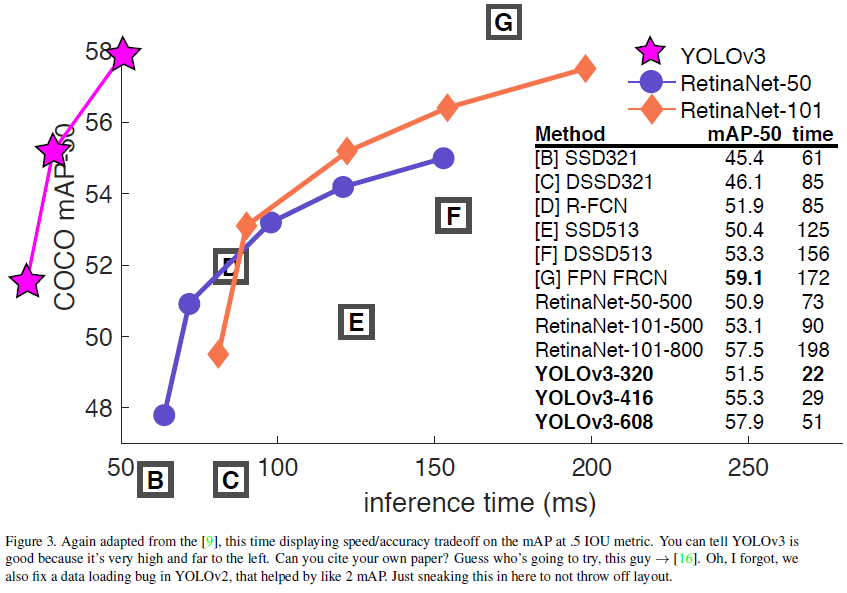
When we plot accuracy vs speed on the AP50 metric (see figure 5) we see YOLOv3 has significant benefits over other detection systems. Namely, it’s faster and better.
当我们在 AP50 指标上绘制精确度与速度的对比图时(见图 5),我们发现 YOLOv3 与其他检测系统相比具有显著优势。也就是说,它更快更好。
4 Things We Tried That Didn’t Work
We tried lots of stuff while we were working on YOLOv3. A lot of it didn’t work. Here’s the stuff we can remember.
在开发 YOLOv3 的过程中,我们尝试了很多方法。很多都没有成功。以下是我们能记住的东西。
Anchor box x; y offset predictions. We tried using the normal anchor box prediction mechanism where you predict the x; y offset as a multiple of the box width or height using a linear activation. We found this formulation decreased model stability and didn’t work very well.
锚点框 x; y 偏移预测。我们尝试过使用普通的锚点框预测机制,即使用线性激活来预测 x; y 偏移量作为框宽或框高的倍数。我们发现这种方法会降低模型的稳定性,而且效果不佳。
Linear x; y predictions instead of logistic. We tried using a linear activation to directly predict the x; y offset instead of the logistic activation. This led to a couple point drop in mAP.
线性 x; y 预测代替逻辑预测。我们尝试使用线性激活来直接预测 x; y 偏移量,而不是使用逻辑激活。这导致 mAP 下降了几个点。
Focal loss. We tried using focal loss. It dropped our mAP about 2 points. YOLOv3 may already be robust to the problem focal loss is trying to solve because it has separate objectness predictions and conditional class predictions. Thus for most examples there is no loss from the class predictions? Or something? We aren’t totally sure.
Focal 损失。我们尝试使用Focal 损失。它使我们的 mAP 下降了约 2 个点。YOLOv3 可能已经能够很好地解决Focal 损失试图解决的问题,因为它具有独立的对象性预测和条件类别预测。因此,对于大多数示例而言,类别预测不会造成损失?还是其他什么原因?我们还不能完全确定。
Dual IOU thresholds and truth assignment. Faster RCNN uses two IOU thresholds during training. If a prediction overlaps the ground truth by .7 it is as a positive example, by [:3:7] it is ignored, less than .3 for all ground truth objects it is a negative example. We tried a similar strategy but couldn’t get good results.
Dual IOU 阈值和 truth assignment。Faster RCNN 在训练过程中使用了两个 IOU 阈值。如果预测与 ground truth 重叠 0.7,则作为正例;[0.3,0.7] 则忽略不计;对于所有 ground truth 对象,小于 0.3 则作为负例。我们尝试过类似的策略,但效果不佳。
We quite like our current formulation, it seems to be at a local optima at least. It is possible that some of these techniques could eventually produce good results, perhaps they just need some tuning to stabilize the training.
我们很喜欢目前的方案,它似乎至少处于局部最优状态。其中一些技术最终可能会产生好的结果,也许它们只是需要一些调整来稳定训练。
 |
|---|
 |
|---|
5 What This All Means
YOLOv3 is a good detector. It’s fast, it’s accurate. It’s not as great on the COCO average AP between .5 and .95 IOU metric. But it’s very good on the old detection metric of .5 IOU.
YOLOv3 是一款优秀的探测器。速度快,精度高。在 0.5 至 0.95 IOU 的 COCO 平均 AP 指标上,它并不出色。但在 0.5 IOU 的旧检测指标上,它却非常出色。
Why did we switch metrics anyway? The original COCO paper just has this cryptic sentence: “A full discussion of evaluation metrics will be added once the evaluation server is complete”. Russakovsky et al report that that humans have a hard time distinguishing an IOU of .3 from .5! “Training humans to visually inspect a bounding box with IOU of 0.3 and distinguish it from one with IOU 0.5 is surprisingly difficult.” [18] If humans have a hard time telling the difference, how much does it matter?
我们为什么要转换指标呢?最初的 COCO 论文中只有这样一句隐晦的话 “一旦评估服务器完成,将添加对评估指标的全面讨论”。Russakovsky 等人报告说,人类很难区分 0.3 和 0.5 的IOU!"训练人类目视检查 IOU 为 0.3 的边界框,并将其与 IOU 为 0.5 的边界框区分开来,难度之大令人吃惊。[18]如果人类很难分辨两者的区别,那么这又有多大关系呢?
But maybe a better question is: “What are we going to do with these detectors now that we have them?” A lot of the people doing this research are at Google and Facebook. I guess at least we know the technology is in good hands and definitely won’t be used to harvest your personal information and sell it to… wait, you’re saying that’s exactly what it will be used for?? Oh.
但也许更好的问题是:"既然我们有了这些探测器,我们该拿它们怎么办?很多从事这项研究的人都在谷歌和脸书工作。我想,至少我们知道这项技术掌握在可靠的人手里,而且绝对不会被用来收集你的个人信息,然后卖到… 等等,你是说这正是它的用途?是的。
Well the other people heavily funding vision research are the military and they’ve never done anything horrible like killing lots of people with new technology oh wait…1 I have a lot of hope that most of the people using computer vision are just doing happy, good stuff with it, like counting the number of zebras in a national park [13], or tracking their cat as it wanders around their house [19]. But computer vision is already being put to questionable use and as researchers we have a responsibility to at least consider the harm our work might be doing and think of ways to mitigate it. We owe the world that much.
我很希望大多数使用计算机视觉的人都是在用它做快乐的好事,比如计算国家公园里斑马的数量[13],或者追踪在家里闲逛的猫[19]。但是,计算机视觉已经被用于令人质疑的用途,作为研究人员,我们有责任至少考虑一下我们的工作可能造成的危害,并想办法减轻这种危害。这是我们欠世界的。
In closing, do not@me. (Because I finally quit Twitter).
Rebuttal
We would like to thank the Reddit commenters, labmates, emailers, and passing shouts in the hallway for their lovely, heartfelt words. If you, like me, are reviewing for ICCV then we know you probably have 37 other papers you could be reading that you’ll invariably put off until the last week and then have some legend in the field email you about how you really should finish those reviews execept it won’t entirely be clear what they’re saying and maybe they’re from the future? Anyway, this paper won’t have become what it will in time be without all the work your past selves will have done also in the past but only a little bit further forward, not like all the way until now forward. And if you tweeted about it I wouldn’t know. Just sayin.
我们要感谢 Reddit 上的评论者、实验室里的伙伴、发邮件的人,以及走廊里路过的呼喊声,感谢他们可爱而真挚的话语。如果你和我一样,正在为ICCV审稿,那么我们知道你可能还有37篇论文可以阅读,而你总是会把它们拖到最后一周才看,然后就会有一些该领域的传奇人物给你发邮件,说你真的应该完成这些审稿了,但他们说的是什么并不完全清楚,也许他们来自未来?总之,如果没有过去的自己所做的工作,这篇论文就不会变成现在的样子。如果你在推特上说了,我就不知道了。说说而已。
Reviewer #2 AKA Dan Grossman (lol blinding who does that) insists that I point out here that our graphs have not one but two non-zero origins. You’re absolutely right Dan, that’s because it looks way better than admitting to ourselves that we’re all just here battling over 2-3% mAP. But here are the requested graphs. I threw in one with FPS too because we look just like super good when we plot on FPS.
评论者 #2 又名丹-格罗斯曼(笑死我了,谁会这么做)坚持要我在这里指出,我们的图形不是只有一个,而是有两个非零的起源。你说得一点没错,丹,因为这比我们自己承认我们只是在这里为 2-3% mAP 争论要好得多。这是我们要求的图表。我还加入了一张 FPS 图,因为我们在绘制 FPS 图时看起来超级棒。
Reviewer #4 AKA JudasAdventus on Reddit writes “Entertaining read but the arguments against the MSCOCO metrics seem a bit weak”. Well, I always knew you would be the one to turn on me Judas. You know how when you work on a project and it only comes out alright so you have to figure out some way to justify how what you did actually was pretty cool? I was basically trying to do that and I lashed out at the COCO metrics a little bit. But now that I’ve staked out this hill I may as well die on it.
Reddit 上的评论者 #4 AKA JudasAdventus 写道:"阅读很有趣,但反对 MSCOCO 指标的论据似乎有点薄弱。我就知道你会背叛我,犹大。你知道,当你在一个项目上工作,但结果却不尽如人意时,你必须想出一些办法来证明你所做的其实很酷。我基本上就是这样做的,我对 COCO 的指标有点抨击。但既然我已经站在了这个山坡上,我也不妨死在它上面。
See here’s the thing, mAP is already sort of broken so an update to it should maybe address some of the issues with it or at least justify why the updated version is better in some way. And that’s the big thing I took issue with was the lack of justification. For PASCAL VOC, the IOU threshold was ”set deliberately low to account for inaccuracies in bounding boxes in the ground truth data“ [2]. Does COCO have better labelling than VOC? This is definitely possible since COCO has segmentation masks maybe the labels are more trustworthy and thus we aren’t as worried about inaccuracy. But again, my problem was the lack of justification.
事情是这样的,mAP 已经有点坏了,所以对它的更新也许应该解决它的一些问题,或者至少证明为什么更新后的版本在某些方面更好。而这正是我对缺乏正当理由的最大意见。对于 PASCAL VOC,IOU 临界值 “故意设置得很低,以考虑到地面实况数据中边界框的不准确性”[2]。COCO 是否比 VOC 有更好的标签?这肯定是有可能的,因为 COCO 有分段掩码,也许标签更可信,因此我们不用担心不准确的问题。但我的问题还是在于缺乏理由。
The COCO metric emphasizes better bounding boxes but that emphasis must mean it de-emphasizes something else, in this case classification accuracy. Is there a good reason to think that more precise bounding boxes are more important than better classification? A miss-classified example is much more obvious than a bounding box that is slightly shifted.
COCO 指标强调的是更好的边界框,但这种强调必然意味着它不强调其他东西,在这里就是分类准确性。是否有充分的理由认为更精确的边界框比更好的分类更重要?一个分类错误的例子要比一个稍有偏移的边界框明显得多。
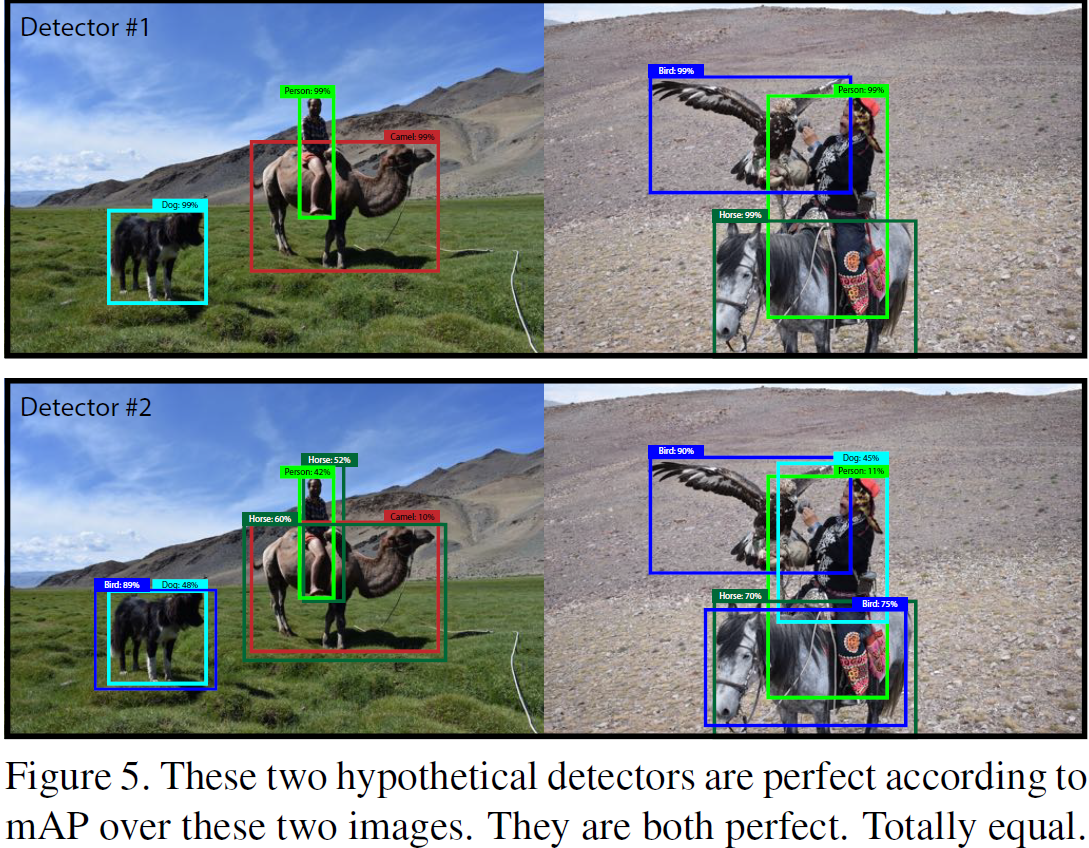
mAP is already screwed up because all that matters is per-class rank ordering. For example, if your test set only has these two images then according to mAP two detectors that produce these results are JUST AS GOOD:
mAP 已经搞砸了,因为最重要的是每类的等级排序。例如,如果您的测试集只有这两张图片,那么根据 mAP,产生这些结果的两个检测器也一样好:
 |
|---|
Now this is OBVIOUSLY an over-exaggeration of the problems with mAP but I guess my newly retconned point is that there are such obvious discrepancies between what people in the “real world” would care about and our current metrics that I think if we’re going to come up with new metrics we should focus on these discrepancies. Also, like, it’s already mean average precision, what do we even call the COCO metric, average mean average precision?
这显然夸大了 mAP 存在的问题,但我想我新提出的观点是,"现实世界 "中人们关心的问题与我们现有的衡量标准之间存在着明显的差异,因此我认为,如果我们要提出新的衡量标准,就应该关注这些差异。另外,比如,现在已经是平均平均精度了,那我们还叫什么 COCO 指标,平均平均精度?
Here’s a proposal, what people actually care about is given an image and a detector, how well will the detector find and classify objects in the image. What about getting rid of the per-class AP and just doing a global average precision? Or doing an AP calculation per-image and averaging over that?
这里有一个建议,人们真正关心的是,给定一幅图像和一个检测器,检测器能在多大程度上发现图像中的物体并对其进行分类。不如取消每类 AP,只计算全球平均精度?或者按图像计算 AP,然后求平均值?
Boxes are stupid anyway though, I’m probably a true believer in masks except I can’t get YOLO to learn them.
无论如何,方框都是愚蠢的,我可能是掩码的忠实信徒,只是我无法让 YOLO 学习它们。


 被折叠的 条评论
为什么被折叠?
被折叠的 条评论
为什么被折叠?
 到【灌水乐园】发言


