1.arthas简介
Arthas 是Alibaba开源的Java诊断工具,深受开发者喜爱。
当你遇到以下类似问题而束手无策时,Arthas可以帮助你解决:
- 这个类从哪个jar包加载的?为什么会报各种类相关的Exception?
- 我改的代码为什么没有执行到?难道是我没commit?分支搞错了?
- 遇到问题无法在线上debug,难道只能通过加日志再重新发布吗?
- 线上遇到某个用户的数据处理有问题,但线上同样无法debug,线下无法重现!
- 是否有一个全局视角来查看系统的运行状况?
- 有什么办法可以监控到JVM的实时运行状态?
- 怎么快速定位应用的热点,生成火焰图?
- 怎样直接从JVM内查找某个类的实例?
Arthas支持JDK 6+,支持Linux/Mac/Windows,采用命令行交互模式,同时提供丰富的 Tab 自动补全功能,进一步方便进行问题的定位和诊断。
说了一大堆,其实Arthas最厉害的地方就在于,能够让你在线上环境没有日志的情况下进行调试程序,定位问题。
2.Arthas快速入门
1.首先在IDEA的插件Marketplace中找到arthas idea这款插件,安装;如果安装失败可以点击这里进行安装
2.打开线上环境的terminal,执行以下语句
windows下执行cmd
curl -O https://arthas.aliyun.com/arthas-boot.jar
java -jar arthas-boot.jar
3.出现以下界面

4.[数字]代表java进程,如自己启动的服务是xxxxAppliaction,按1然后回车,arthas就会绑定到目标进程上。
[INFO] arthas-boot version: 3.6.3
[INFO] Process 22104 already using port 3658
[INFO] Process 22104 already using port 8563
[INFO] Found existing java process, please choose one and input the serial number of the process, eg : 1. Then hit ENTER.
* [1]: 22104 xxxx.xxxxx.xxxxx.XxxxxxApplication
  [2]: 15504 org.jetbrains.jps.cmdline.Launcher
  [3]: 12532 arthas-boot.jar
  [4]: 21036
  [5]: 5596 org.jetbrains.jps.cmdline.Launcher
  [6]: 6668
1
[INFO] arthas home: D:\MyData\chenjw82\.arthas\lib\3.6.4\arthas
[INFO] The target process already listen port 3658, skip attach.
[INFO] arthas-client connect 127.0.0.1 3658
  ,---.  ,------. ,--------.,--.  ,--.  ,---.   ,---.
 /  O  \ |  .--. ''--.  .--'|  '--'  | /  O  \ '   .-'
|  .-.  ||  '--'.'   |  |   |  .--.  ||  .-.  |`.  `-.
|  | |  ||  |\  \    |  |   |  |  |  ||  | |  |.-'    |
`--' `--'`--' '--'   `--'   `--'  `--'`--' `--'`-----'

wiki       https://arthas.aliyun.com/doc
tutorials  https://arthas.aliyun.com/doc/arthas-tutorials.html
version    3.6.4
main_class
pid        22104
time       2022-08-18 10:58:51
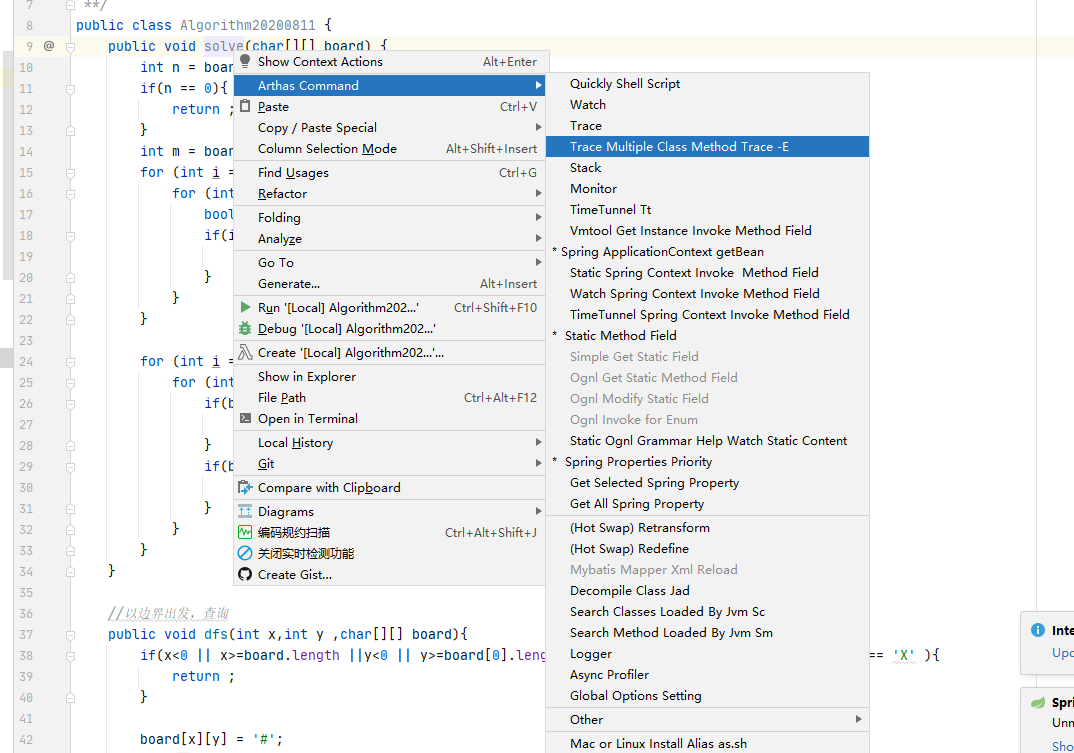
5.鼠标移至代码方法处,右键点击Arthas Command的方法生成需要观察的脚本,并拷贝至cmd上。随后运行代码即可返回监控堆栈日志等。

trace 跟踪请求链路
#查看跟踪请求链路
trace -E xxx.x.xxx.x.xxx.x.x.x.XxxController|xxx.x.xx.x.x.x.service.service.impl.XxxxServiceImpl xxxx|xxxxxx -n 5  --skipJDKMethod false '1==1'
查看调用栈
#查看调用栈
stack xxx.x.x.x.x.x.XxxController AAAAA  -n 5
监控方法执行情况
#
monitor xx.x.x.x.x.x.XxxController aaaaAaaAaAaa  -n 10  --cycle 10
profiler start --event cpu --interval 10000000 --threads --format svg -duration 30 --threads
profiler stop
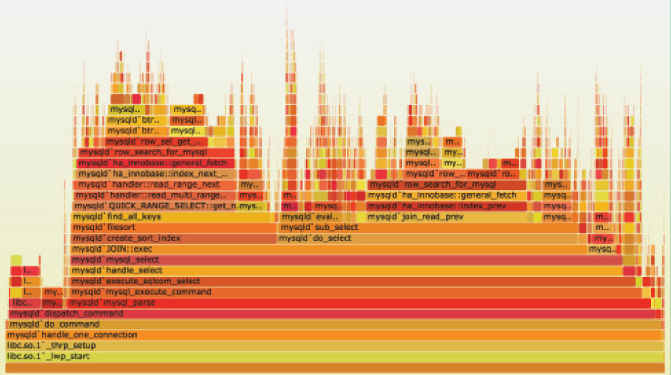
就可以生产火焰图了
火焰图

y轴代表调用栈,每一层都是一个函数;调用栈越深,火焰就越高,顶部就是正在执行的函数,下方都是它的父函数。
x轴代表抽样数,如果一个函数在x轴占据宽度越宽,就表示它被抽到的次数多,即执行的时间长。注意,x轴不代表时间,而是所有的调用栈合并后,按照字母顺序排列的。
火焰图就是顶层的哪个函数占据的宽度最大。只要有“平顶”(plateaus),就代表该函数可能存在性能问题。
颜色没有特殊含义,因为火焰图表示的是CPU的繁忙程度,所以一般选择暖色调。
封面:

参考文档:结合 arthas idea 插件的基本玩法(常用)


 Arthas是一款由Alibaba开源的Java诊断工具,适用于解决类加载、线上调试、日志查看等问题。本文介绍了Arthas的安装与使用,包括通过IDEA插件快速接入,在线程跟踪、调用栈查看、方法监控等方面的应用,以及如何生成火焰图进行性能分析。通过Arthas,开发者可以在不依赖日志的情况下高效地定位和解决问题。


 被折叠的 条评论
为什么被折叠?


