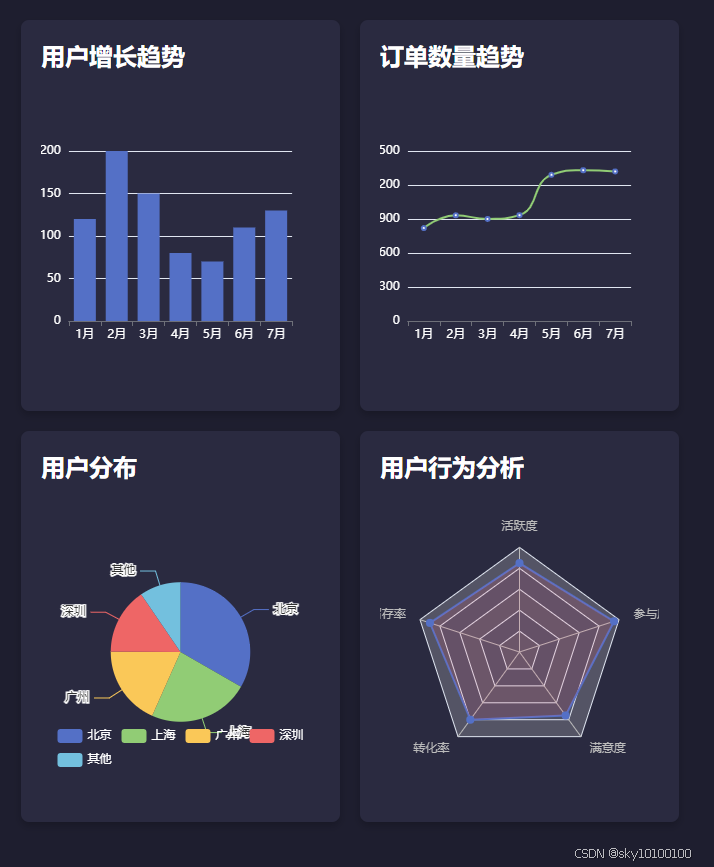
效果图:
完整代码
<!DOCTYPE html>
<html>
<head>
<meta charset="utf-8">
<title>可视化智慧大屏 - ECharts + Vue2</title>
<script src="https://cdn.jsdelivr.net/npm/vue@2"></script>
<script src="https://cdn.jsdelivr.net/npm/echarts@5.4.2/dist/echarts.min.js"></script>
<style>
body {
font-family: Arial, sans-serif;
background-color: #1e1e2f;
color: #fff;
margin: 0;
padding: 0;
}
.dashboard {
display: flex;
flex-wrap: wrap;
padding: 20px;
}
.card {
background: #2a2a40;
border-radius: 8px;
box-shadow: 0 4px 8px rgba(0, 0, 0, 0.2);
margin: 10px;
padding: 20px;
width: calc(50% - 40px);
box-sizing: border-box;
}
.card h2 {
margin-top: 0;
color: #fff;
}
.chart {
width: 100%;
height: 300px;
}
</style>
</head>
<body>
<div id="app">
<div class="dashboard">
<div class="card">
<h2>用户增长趋势</h2>
<div class="chart" ref="barChart"></div>
</div>
<div class="card">
<h2>订单数量趋势</h2>
<div class="chart" ref="lineChart"></div>
</div>
<div class="card">
<h2>用户分布</h2>
<div class="chart" ref="pieChart"></div>
</div>
<div class="card">
<h2>用户行为分析</h2>
<div class="chart" ref="radarChart"></div>
</div>
</div>
</div>
<script>
new Vue({
el: '#app',
mounted() {
this.initBarChart();
this.initLineChart();
this.initPieChart();
this.initRadarChart();
},
methods: {
initBarChart() {
const chart = echarts.init(this.$refs.barChart);
const option = {
tooltip: {
trigger: 'axis',
axisPointer: {
type: 'shadow'
}
},
xAxis: {
type: 'category',
data: ['1月', '2月', '3月', '4月', '5月', '6月', '7月'],
axisLabel: {
color: '#fff'
}
},
yAxis: {
type: 'value',
axisLabel: {
color: '#fff'
}
},
series: [{
data: [120, 200, 150, 80, 70, 110, 130],
type: 'bar',
itemStyle: {
color: '#5470c6'
}
}]
};
chart.setOption(option);
},
initLineChart() {
const chart = echarts.init(this.$refs.lineChart);
const option = {
tooltip: {
trigger: 'axis'
},
xAxis: {
type: 'category',
data: ['1月', '2月', '3月', '4月', '5月', '6月', '7月'],
axisLabel: {
color: '#fff'
}
},
yAxis: {
type: 'value',
axisLabel: {
color: '#fff'
}
},
series: [{
data: [820, 932, 901, 934, 1290, 1330, 1320],
type: 'line',
smooth: true,
lineStyle: {
color: '#91cc75'
}
}]
};
chart.setOption(option);
},
initPieChart() {
const chart = echarts.init(this.$refs.pieChart);
const option = {
tooltip: {
trigger: 'item'
},
legend: {
bottom: '10%',
left: 'center',
textStyle: {
color: '#fff'
}
},
series: [{
name: '用户分布',
type: 'pie',
radius: '50%',
data: [
{ value: 1048, name: '北京' },
{ value: 735, name: '上海' },
{ value: 580, name: '广州' },
{ value: 484, name: '深圳' },
{ value: 300, name: '其他' }
],
emphasis: {
itemStyle: {
shadowBlur: 10,
shadowOffsetX: 0,
shadowColor: 'rgba(0, 0, 0, 0.5)'
}
}
}]
};
chart.setOption(option);
},
initRadarChart() {
const chart = echarts.init(this.$refs.radarChart);
const option = {
tooltip: {
trigger: 'item'
},
radar: {
indicator: [
{ name: '活跃度', max: 100 },
{ name: '留存率', max: 100 },
{ name: '转化率', max: 100 },
{ name: '满意度', max: 100 },
{ name: '参与度', max: 100 }
],
axisLabel: {
color: '#fff'
}
},
series: [{
name: '用户行为',
type: 'radar',
data: [
{
value: [85, 90, 80, 75, 95],
name: '用户行为分析'
}
],
areaStyle: {
color: 'rgba(255, 99, 132, 0.2)'
}
}]
};
chart.setOption(option);
}
}
});
</script>
</body>
</html>


 被折叠的 条评论
为什么被折叠?
被折叠的 条评论
为什么被折叠?
 到【灌水乐园】发言


