


 本文详细介绍CSV文件的读取、分析及数据可视化方法,包括使用Python进行数据提取、日期格式化、异常处理等,同时探讨JSON数据的获取与解析技巧。
1. CSV文件格式
首先将sitka_weather_07-2014.csv复制存储到本章程序的文件夹中。
分析CSV文件头
import csv #导入CSV模块

# 将要使用的文件名存储在filename中
filename = 'sitka_weather_07-2014.csv'

# 打开该文件,并将结果文件对象存储在f中
with open(filename) as f:
    # 调用csv.reader(),并将前面存储的文件对象作为实参传递给它,从而创建一个与该文件相关联的阅读器(reader)对象。
    reader = csv.reader(f)
    # 模块csv的reader类包含next()方法,调用内置函数next(),返回文件中的下一行
    header_row = next(reader)
    print(header_row)
在上述代码中,我们只调用了next()一次,因此得到的是文件的第一行,其中包含文件头。
#运行结果

['AKDT', 'Max TemperatureF', 'Mean TemperatureF', 'Min TemperatureF', 'Max Dew PointF', 'MeanDew PointF', 'Min DewpointF', 'Max Humidity', ' Mean Humidity', ' Min Humidity', ' Max Sea Level PressureIn', ' Mean Sea Level PressureIn', ' Min Sea Level PressureIn', ' Max VisibilityMiles', ' Mean VisibilityMiles', ' Min VisibilityMiles', ' Max Wind SpeedMPH', ' Mean Wind SpeedMPH', ' Max Gust SpeedMPH', 'PrecipitationIn', ' CloudCover', ' Events', ' WindDirDegrees']
reader处理文件中以逗号分隔的第一行数据,并将每项数据都作为一个元素存储在列表中。
注
:
文
件
头
的
格
式
并
非
总
是
一
致
的
,
空
格
和
单
位
可
能
出
现
在
奇
怪
的
地
方
,
这
在
原
始
数
据
中
很
常
见
,
但
不
会
带
来
任
何
问
题
\color{red}{注:文件头的格式并非总是一致的,空格和单位可能出现在奇怪的地方,这在原始数据中很常见,但不会带来任何问题}
注:文件头的格式并非总是一致的,空格和单位可能出现在奇怪的地方,这在原始数据中很常见,但不会带来任何问题
打印文件头及其位置
import csv

filename = 'sitka_weather_07-2014.csv'
with open(filename) as f:
    reader = csv.reader(f)
    header_row = next(reader)

	# 对列表调用enumerate()来获取每个元素的索引及其值。
    for index, column_header in enumerate(header_row):
        print(index, column_header)
# 运行结果
0 AKDT
1 Max TemperatureF
2 Mean TemperatureF
3 Min TemperatureF
4 Max Dew PointF
5 MeanDew PointF
6 Min DewpointF
7 Max Humidity
8  Mean Humidity
9  Min Humidity
10  Max Sea Level PressureIn
11  Mean Sea Level PressureIn
12  Min Sea Level PressureIn
13  Max VisibilityMiles
14  Mean VisibilityMiles
15  Min VisibilityMiles
16  Max Wind SpeedMPH
17  Mean Wind SpeedMPH
18  Max Gust SpeedMPH
19 PrecipitationIn
20  CloudCover
21  Events
22  WindDirDegrees
提取并读取数据
import csv

# 从文件中获取最高温度

# 版本1
filename = 'sitka_weather_07-2014.csv'
with open(filename) as f:
    reader = csv.reader(f)
    header_row = next(reader)

    highs = []
    for row in reader:
        highs.append(row[1])

    print(highs)

# 版本2
#————snip————
    for row in reader:
        high = int(row[1])
        highs.append(high)

    print(highs)
上述代码,创建了一个名为highs的空列表,再遍历文件中余下的各行。
其中的for循环是从第二行开始——从这行开始包含的是实际数据。
每次执行该循环,都将索引1处(第2列)的数据附加到highs末尾。
# 版本1运行结果
['64', '71', '64', '59', '69', '62', '61', '55', '57', '61', '57', '59', '57', '61', '64', '61', '59', '63', '60', '57', '69', '63', '62', '59', '57', '57', '61', '59', '61', '61', '66']

# 版本2运行结果
[64, 71, 64, 59, 69, 62, 61, 55, 57, 61, 57, 59, 57, 61, 64, 61, 59, 63, 60, 57, 69, 63, 62, 59, 57, 57, 61, 59, 61, 61, 66]
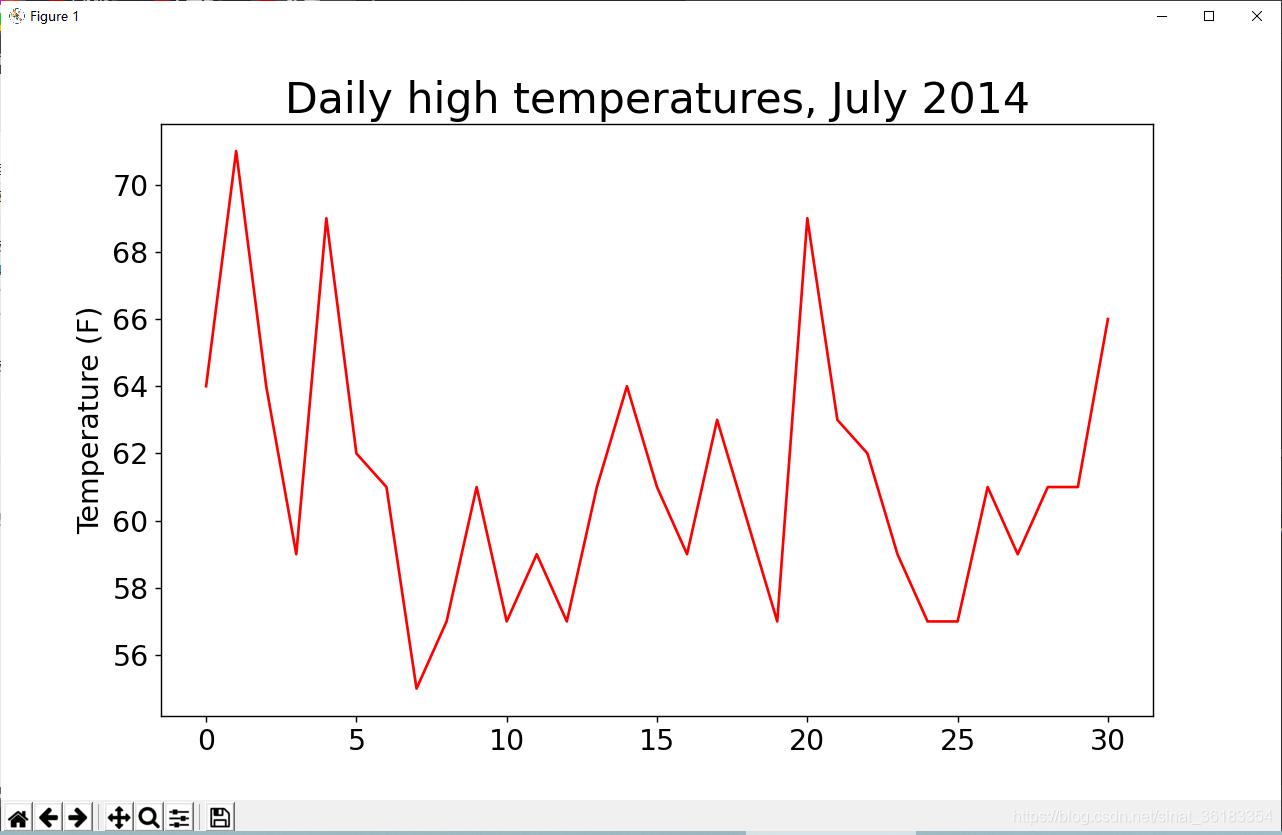
绘制气温图表
import csv

from matplotlib import pyplot as plt

# 从文件中获取最高温度
filename = 'sitka_weather_07-2014.csv'
with open(filename) as f:
    reader = csv.reader(f)
    header_row = next(reader)
    highs = []
    for row in reader:
        high = int(row[1])
        highs.append(high)

# 根据数据绘制图形
fig = plt.figure(dpi=128, figsize=(10, 6))
plt.plot(highs, c='red')

# 设置图形的格式
plt.title('Daily high temperatures, July 2014', fontsize=24)
plt.xlabel('', fontsize=16)
plt.ylabel('Temperature (F)', fontsize=16)
plt.tick_params(axis='both', which='major', labelsize=16)

plt.show()
模块datetime——strptime()
from datetime import datetime
# 导入模块datetime中的datetime类,然后调用方法strptime(),并将包含所需日期的字符串作为第一个实参。第二个实参告诉Python如何设置日期的格式。
first_data = datetime.strptime('2014-7-1', '%Y-%m-%d')
print(first_data)
2014-07-01 00:00:00
模块datetime中设置日期和时间格式的实参
| 实参 | 含义 |
|---|---|
| %A | 星期的名称,如Monday |
| %B | 月份名,如January |
| %m | 用数字表示月份(01~12) |
| %d | 用数字表示月份中的一天(01~31) |
| %Y | 四位的年份,如2020 |
| %y | 两位的年份,如20 |
| %H | 24小时制的小时数(00~23) |
| %I | 12小时制的小时数(01~12) |
| %p | am或pm |
| %M | 分钟数(0~59) |
| %S | 秒数(00~61) |
import csv
from datetime import datetime
from matplotlib import pyplot as plt
# 从文件中获取最高温度
filename = 'sitka_weather_07-2014.csv'
with open(filename) as f:
reader = csv.reader(f)
header_row = next(reader)
# 创建两个空列表,用于存储从文化中提取的日期和最高气温
dates, highs = [], []
for row in reader:
current_date = datetime.strptime(row[0], '%Y-%m-%d')
# 将row[0]转换为dataline对象,并将其附加到列表dates末尾
dates.append(current_date)
high = int(row[1])
highs.append(high)
# 根据数据绘制图形
fig = plt.figure(dpi=128, figsize=(10, 6))
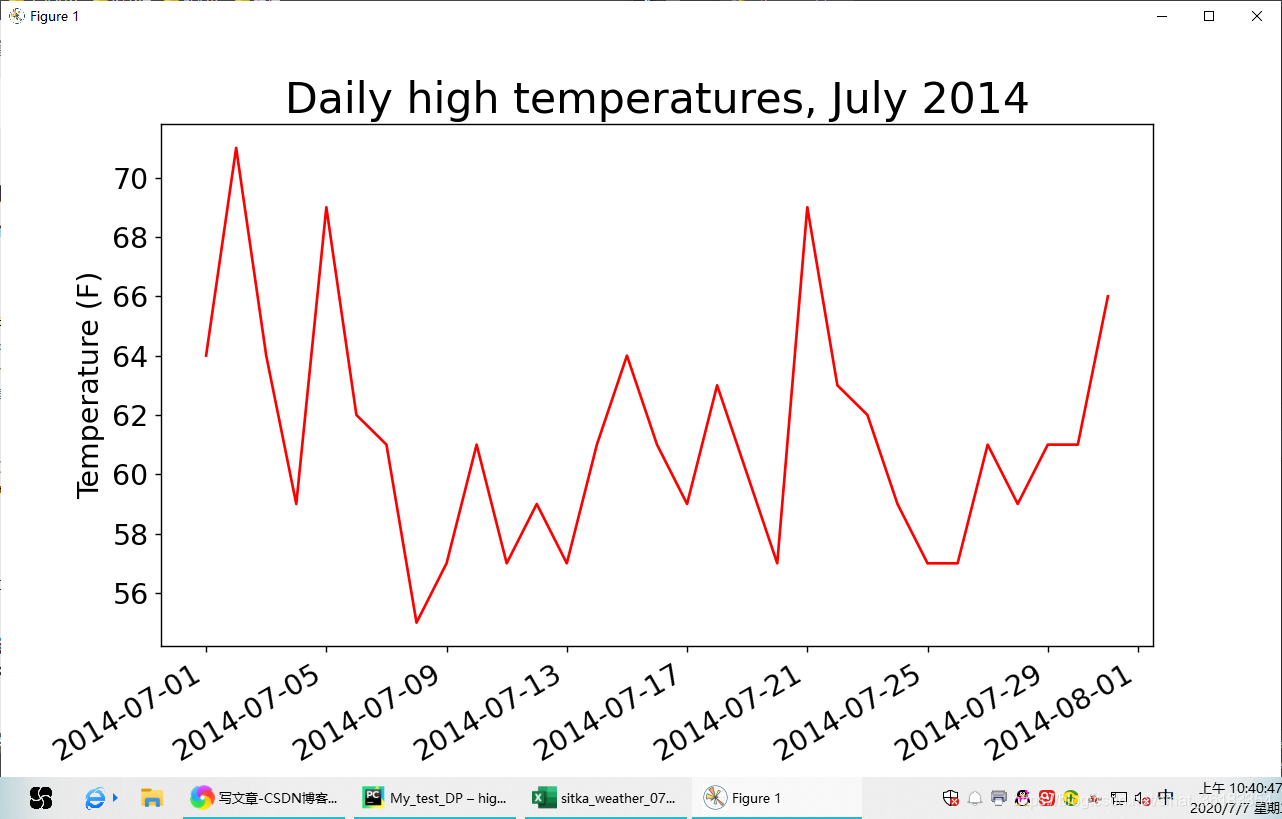
# 调用了fig.autofmt_xdate()来绘制斜的日期标签,以免它们彼此重叠
plt.plot(dates, highs, c='red')
# 设置图形的格式
plt.title('Daily high temperatures, July 2014', fontsize=24)
plt.xlabel('', fontsize=16)
fig.autofmt_xdate()
# ————snip————
- 创建两个空列表dates, highs,用于存储从文化中提取的日期和最高气温
- 将row[0]转换为dataline对象,并将其附加到列表dates末尾
- 调用了fig.autofmt_xdate()来绘制斜的日期标签,以免它们彼此重叠
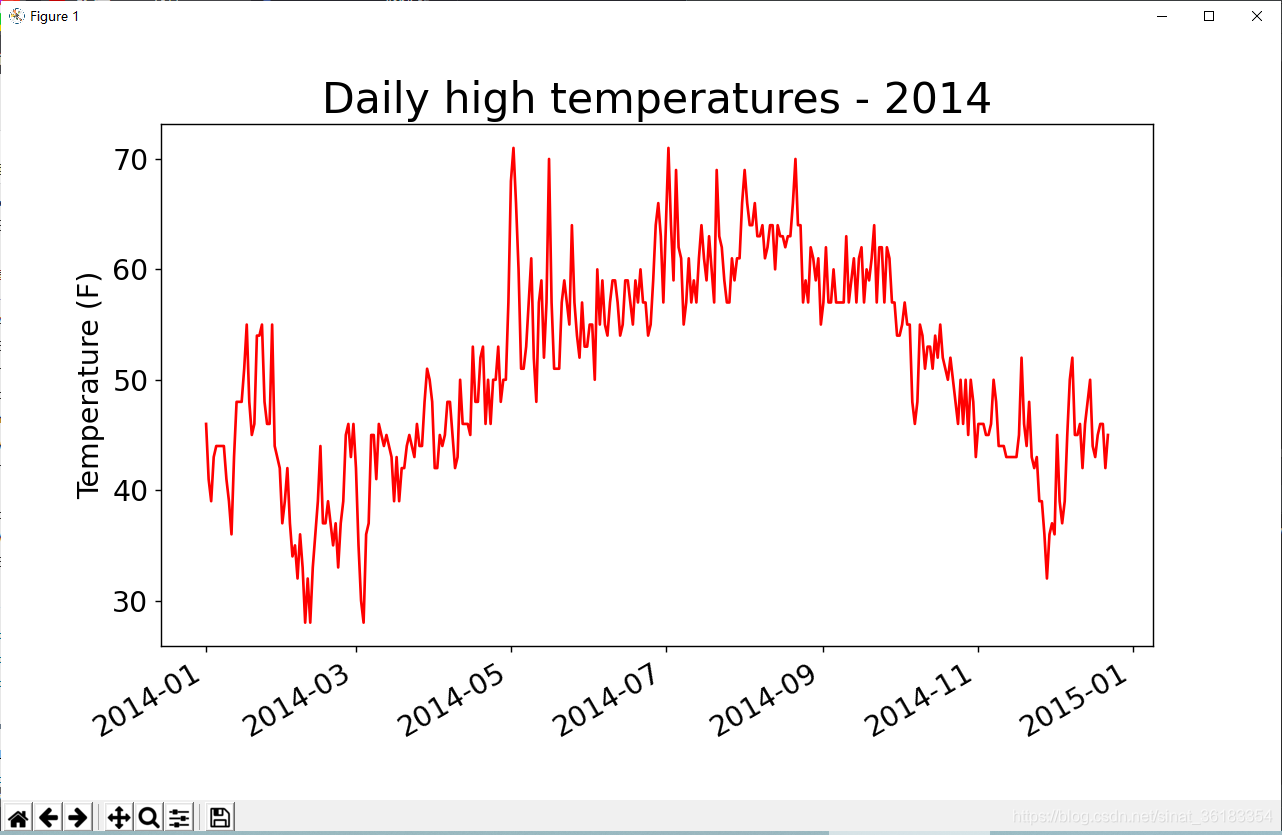
涵盖更长的时间
- 简易代码版本:
# ————snip————

# 从文件中获取最高温度
filename = 'sitka_weather_2014.csv'
with open(filename) as f:
# ————snip————

# 设置图形的格式
plt.title('Daily high temperatures - 2014', fontsize=24)
# ————snip————
- 完整代码版本:
import csv
from datetime import datetime
from matplotlib import pyplot as plt

# 从文件中获取最高温度
filename = 'sitka_weather_2014.csv'
with open(filename) as f:
    reader = csv.reader(f)
    header_row = next(reader)

    dates, highs = [], []
    for row in reader:
        current_date = datetime.strptime(row[0], '%Y-%m-%d')
        dates.append(current_date)
        high = int(row[1])
        highs.append(high)

# 根据数据绘制图形
fig = plt.figure(dpi=128, figsize=(10, 6))
plt.plot(dates, highs, c='red')

# 设置图形的格式
plt.title('Daily high temperatures - 2014', fontsize=24)
plt.xlabel('', fontsize=16)
fig.autofmt_xdate()
plt.ylabel('Temperature (F)', fontsize=16)
plt.tick_params(axis='both', which='major', labelsize=16)

plt.show()
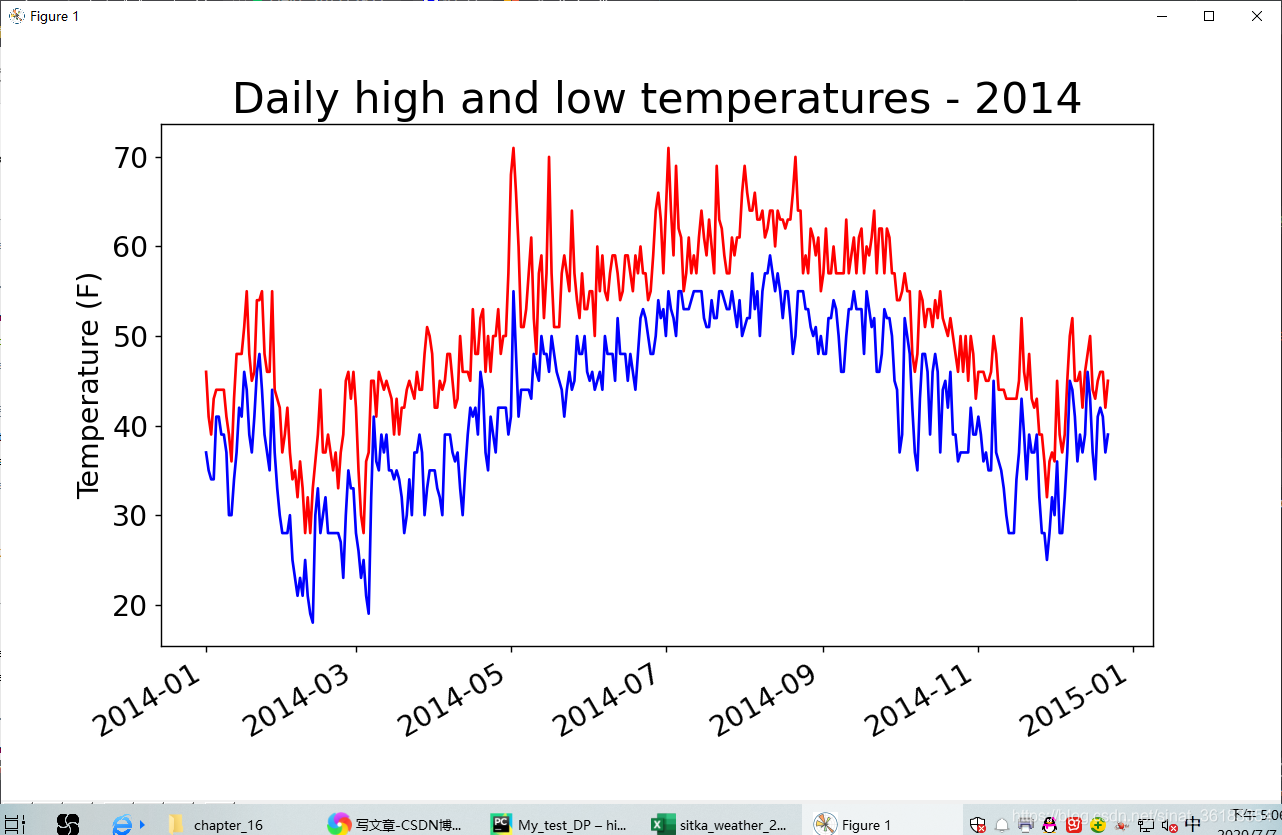
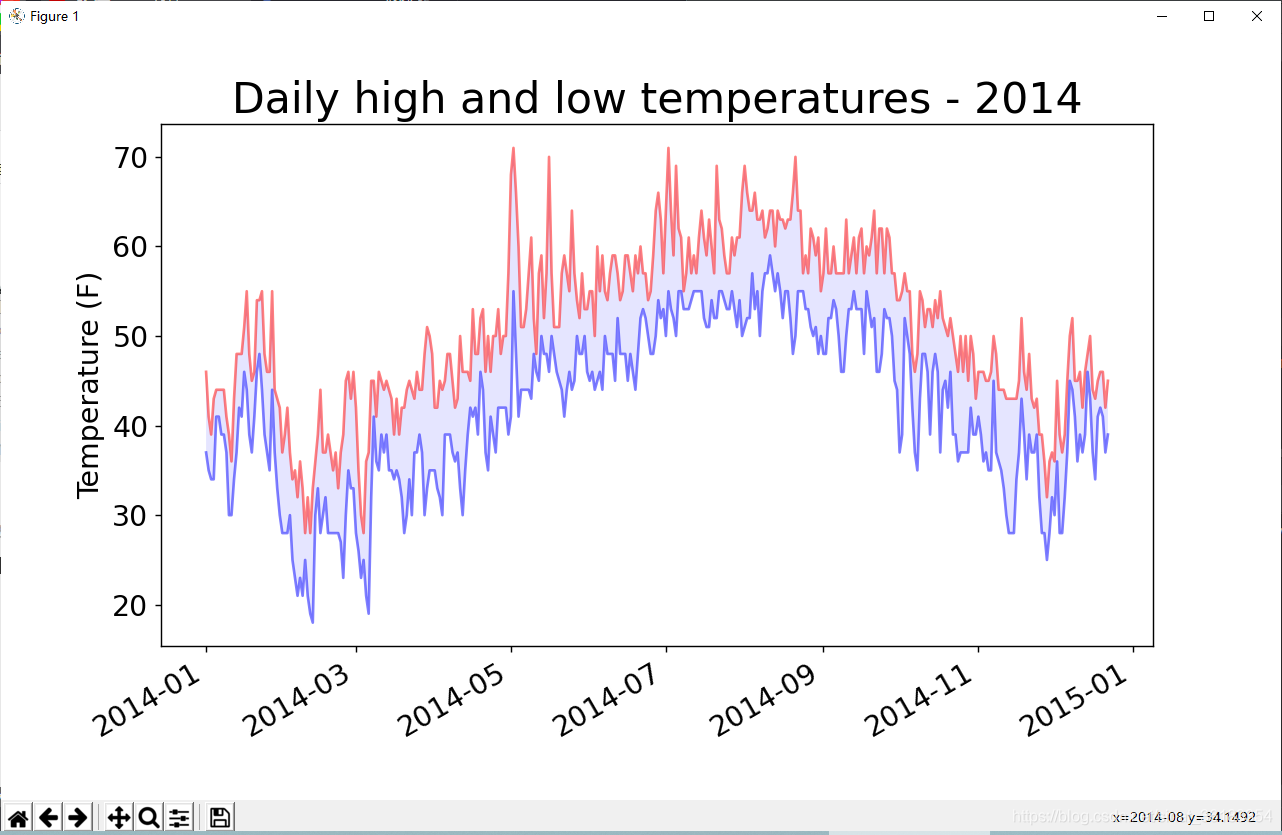
再绘制一个数据系列
import csv
from datetime import datetime
from matplotlib import pyplot as plt

# 从文件中获取最高温度
filename = 'sitka_weather_2014.csv'
with open(filename) as f:
    reader = csv.reader(f)
    header_row = next(reader)

    dates, highs ,lows = [], [], []
    for row in reader:
        current_date = datetime.strptime(row[0], '%Y-%m-%d')
        dates.append(current_date)

        high = int(row[1])
        highs.append(high)

        low = int(row[3])
        lows.append(low)

# 根据数据绘制图形
fig = plt.figure(dpi=128, figsize=(10, 6))
plt.plot(dates, highs, c='red')
plt.plot(dates, lows, c='blue')

# 设置图形的格式
plt.title('Daily high and low temperatures - 2014', fontsize=24)
plt.xlabel('', fontsize=16)
fig.autofmt_xdate()
plt.ylabel('Temperature (F)', fontsize=16)
plt.tick_params(axis='both', which='major', labelsize=16)

plt.show()
添加空列表lows,用于存储最低气温,并添加一个对plot()的调用,以使用蓝色绘制最低气温
给图表区域着色——fill_between()
# ————snip————

# 根据数据绘制图形
fig = plt.figure(dpi=128, figsize=(10, 6))
plt.plot(dates, highs, c='red', alpha=0.5)
plt.plot(dates, lows, c='blue', alpha=0.5)
plt.fill_between(dates, highs, lows, facecolor='blue', alpha=0.1)

# ————snip————
- 上述代码中的实参alpha指定颜色的透明度,alpha=0表示完全透明,alpha=1(默认设置)表示完全不透明。
- plt.fill_between()语句中,是向fill_between()传递一个x值系列:列表dates,还传递了两个y值系列:highs和lows。实参facecolor指定了填充区域的颜色。还将填充颜色的透明度设置为0.1。
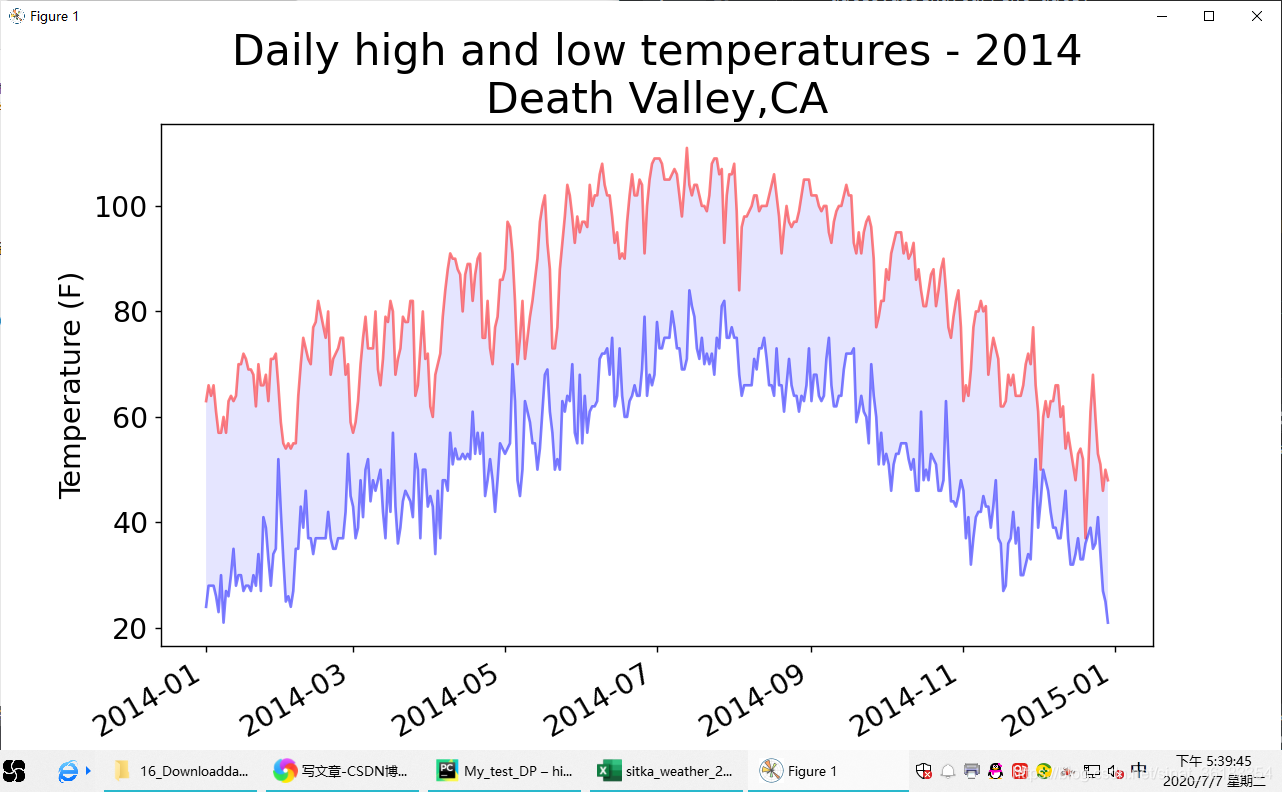
错误检查
缺失数据可能引发异常,如果不妥善处理,可能导致程序崩溃。
例如:将文件death_valley_2014.csv复制到本章程序所在的文件夹,再修改highs_lows.py,使其生成加利福利亚死亡谷的气温图:
import csv
from datetime import datetime
from matplotlib import pyplot as plt

# 从文件中获取最高温度
filename = 'death_valley_2014.csv'
# ————snip————
运行该程序时,出现了一个错误:
Traceback (most recent call last):
  File "G:/My_test_DP/16_Downloaddate_test/highs_lows.py", line 16, in <module>
    high = int(row[1])
ValueError: invalid literal for int() with base 10: ''
该Traceback指出,Python无法处理其中一天的最高气温,因为它无法将空字符串(’’)转换为整数。
在文件death_valley_2014.csv中没有记录2014年2月16日的数据,表示最高温度的字符串为空。
以下是解决这种异常的处理方式:
- 简易代码版本
# ————snip————

filename = 'death_valley_2014.csv'

# ————snip————
    for row in reader:
        try:
            current_date = datetime.strptime(row[0], '%Y-%m-%d')
            high = int(row[1])
            low = int(row[3])
        except ValueError:
            print(current_date, 'missing data')
        else:
            dates.append(current_date)
            highs.append(high)
            lows.append(low)

# ————snip————
# 设置图形的格式

title = 'Daily high and low temperatures - 2014\nDeath Valley,CA'
plt.title(title, fontsize=24)
- 完整代码版本:
import csv
from datetime import datetime
from matplotlib import pyplot as plt

# 从文件中获取最高温度
filename = 'death_valley_2014.csv'
with open(filename) as f:
    reader = csv.reader(f)
    header_row = next(reader)

    dates, highs, lows = [], [], []
    for row in reader:
        try:
            current_date = datetime.strptime(row[0], '%Y-%m-%d')
            high = int(row[1])
            low = int(row[3])
        except ValueError:
            print(current_date, 'missing data')
        else:
            dates.append(current_date)
            highs.append(high)
            lows.append(low)

# 根据数据绘制图形
fig = plt.figure(dpi=128, figsize=(10, 6))
plt.plot(dates, highs, c='red', alpha=0.5)
plt.plot(dates, lows, c='blue', alpha=0.5)
plt.fill_between(dates, highs, lows, facecolor='blue', alpha=0.1)

# 设置图形的格式
title = 'Daily high and low temperatures - 2014\nDeath Valley,CA'
plt.title(title, fontsize=24)
plt.xlabel('', fontsize=16)
fig.autofmt_xdate()
plt.ylabel('Temperature (F)', fontsize=16)
plt.tick_params(axis='both', which='major', labelsize=16)

plt.show()
运行结果:(除了生成图之外,还输出一个提示语句)
2014-02-16 00:00:00 missing data
2. 制作交易收盘价走势图: JSON格式
下载收盘价数据
from __future__ import (absolute_import, division, print_function, unicode_literals)

try:
    # python2.X 版本
    from urllib2 import urlopen
except ImportError:
    # python3.X 版本
    from urllib.request import urlopen

import json

json_url = 'https://raw.githubusercontent.com/muxuezi/btc/master/btc_close_2017.json'
response = urlopen(json_url)
# 读取数据
req = response.read()
# 将数据写入文件
with open('btc_close_2017_urllib.json', 'wb') as f:
    f.write(req)

# 加载json格式
file_urllib = json.loads(req)
print(file_urllib)
以上代码报错了,目前还不知道怎么解决,先放着吧
Traceback (most recent call last):
  File "E:\Python\Python36\lib\urllib\request.py", line 1318, in do_open
    encode_chunked=req.has_header('Transfer-encoding'))
  File "E:\Python\Python36\lib\http\client.py", line 1239, in request
    self._send_request(method, url, body, headers, encode_chunked)
  File "E:\Python\Python36\lib\http\client.py", line 1285, in _send_request
    self.endheaders(body, encode_chunked=encode_chunked)
  File "E:\Python\Python36\lib\http\client.py", line 1234, in endheaders
    self._send_output(message_body, encode_chunked=encode_chunked)
  File "E:\Python\Python36\lib\http\client.py", line 1026, in _send_output
    self.send(msg)
  File "E:\Python\Python36\lib\http\client.py", line 964, in send
    self.connect()
  File "E:\Python\Python36\lib\http\client.py", line 1392, in connect
    super().connect()
  File "E:\Python\Python36\lib\http\client.py", line 936, in connect
    (self.host,self.port), self.timeout, self.source_address)
  File "E:\Python\Python36\lib\socket.py", line 704, in create_connection
    for res in getaddrinfo(host, port, 0, SOCK_STREAM):
  File "E:\Python\Python36\lib\socket.py", line 745, in getaddrinfo
    for res in _socket.getaddrinfo(host, port, family, type, proto, flags):
socket.gaierror: [Errno 11004] getaddrinfo failed

During handling of the above exception, another exception occurred:

Traceback (most recent call last):
  File "G:/My_test_DP/16_Downloaddate_test/btc_close_2017.py", line 18, in <module>
    response = urlopen(json_url)  # 2
  File "E:\Python\Python36\lib\urllib\request.py", line 223, in urlopen
    return opener.open(url, data, timeout)
  File "E:\Python\Python36\lib\urllib\request.py", line 526, in open
    response = self._open(req, data)
  File "E:\Python\Python36\lib\urllib\request.py", line 544, in _open
    '_open', req)
  File "E:\Python\Python36\lib\urllib\request.py", line 504, in _call_chain
    result = func(*args)
  File "E:\Python\Python36\lib\urllib\request.py", line 1361, in https_open
    context=self._context, check_hostname=self._check_hostname)
  File "E:\Python\Python36\lib\urllib\request.py", line 1320, in do_open
    raise URLError(err)
urllib.error.URLError: <urlopen error [Errno 11004] getaddrinfo failed>
# !/usr/bin/env python
# -*- coding:utf-8 -*-
import requests
json_url = 'https://www.baidu.com'

req = requests.get(json_url)
print(req.text)  # 打印出网页源代码
<!DOCTYPE html>
<!--STATUS OK--><html> <head><meta http-equiv=content-type content=text/html;charset=utf-8><meta http-equiv=X-UA-Compatible content=IE=Edge><meta content=always name=referrer><link rel=stylesheet type=text/css href=https://ss1.bdstatic.com/5eN1bjq8AAUYm2zgoY3K/r/www/cache/bdorz/baidu.min.css><title>ç™¾åº¦ä¸€ä¸‹ï¼Œä½ å°±çŸ¥é“</title></head> <body link=#0000cc> <div id=wrapper> <div id=head> <div class=head_wrapper> <div class=s_form> <div class=s_form_wrapper> <div id=lg> <img hidefocus=true src=//www.baidu.com/img/bd_logo1.png width=270 height=129> </div> <form id=form name=f action=//www.baidu.com/s class=fm> <input type=hidden name=bdorz_come value=1> <input type=hidden name=ie value=utf-8> <input type=hidden name=f value=8> <input type=hidden name=rsv_bp value=1> <input type=hidden name=rsv_idx value=1> <input type=hidden name=tn value=baidu><span class="bg s_ipt_wr"><input id=kw name=wd class=s_ipt value maxlength=255 autocomplete=off autofocus=autofocus></span><span class="bg s_btn_wr"><input type=submit id=su value=百度一下 class="bg s_btn" autofocus></span> </form> </div> </div> <div id=u1> <a href=http://news.baidu.com name=tj_trnews class=mnav>æ–°é—»</a> <a href=https://www.hao123.com name=tj_trhao123 class=mnav>hao123</a> <a href=http://map.baidu.com name=tj_trmap class=mnav>地图</a> <a href=http://v.baidu.com name=tj_trvideo class=mnav>视频</a> <a href=http://tieba.baidu.com name=tj_trtieba class=mnav>è´´å§</a> <noscript> <a href=http://www.baidu.com/bdorz/login.gif?login&tpl=mn&u=http%3A%2F%2Fwww.baidu.com%2f%3fbdorz_come%3d1 name=tj_login class=lb>登录</a> </noscript> <script>document.write('<a href="http://www.baidu.com/bdorz/login.gif?login&tpl=mn&u='+ encodeURIComponent(window.location.href+ (window.location.search === "" ? "?" : "&")+ "bdorz_come=1")+ '" name="tj_login" class="lb">登录</a>');
</script> <a href=//www.baidu.com/more/ name=tj_briicon class=bri style="display: block;">更多产å“</a> </div> </div> </div> <div id=ftCon> <div id=ftConw> <p id=lh> <a href=http://home.baidu.com>å
³äºŽç™¾åº¦</a> <a href=http://ir.baidu.com>About Baidu</a> </p> <p id=cp>©2017 Baidu <a href=http://www.baidu.com/duty/>使用百度å‰å¿
读</a> <a href=http://jianyi.baidu.com/ class=cp-feedback>æ„è§å馈</a> 京ICPè¯030173å· <img src=//www.baidu.com/img/gs.gif> </p> </div> </div> </div> </body> </html>
示例代码2
import io
import sys
import urllib.request

sys.stdout = io.TextIOWrapper(sys.stdout.buffer, encoding='utf8')  # 改变标准输出的默认编码
res = urllib.request.urlopen('http://www.baidu.com')
htmlBytes = res.read()
print(htmlBytes.decode('utf-8'))
以下代码也抛出了异常,还是不知道怎么解决:
# !/usr/bin/env python
# -*- coding:utf-8 -*-

import requests

json_url = 'https://www.baidu.com'

req = requests.get(json_url)
with open('baidu.json','w',encoding='utf-8') as f:
    f.write(req.text)
file_requests = req.json()
在windows下面编写python脚本,编码问题很严重。
将网络数据流写入文件时时,我们会遇到几个编码:1: #encoding=‘XXX’ 这里(也就是python文件第一行的内容)的编码是指该python脚本文件本身的编码,无关紧要。只要XXX和文件本身的编码相同就行了。 比如notepad++ "格式"菜单里面里可以设置各种编码,这时需要保证该菜单里设置的编码和encoding XXX相同就行了,不同的话会报错
2:网络数据流的编码 比如获取网页,那么网络数据流的编码就是网页的编码。需要使用decode解码成unicode编码。
3:目标文件的编码 要将网络数据流的编码写入到新文件,那么我么需要指定新文件的编码。写文件代码如:f.write(txt)
那么txt是一个字符串,它是通过decode解码过的字符串。关键点就要来了:目标文件的编码是导致标题所指问题的罪魁祸首。如果我们打开一个文件:
f = open(“out.html”,“w”)
在windows下面,新文件的默认编码是gbk,这样的话,python解释器会用gbk编码去解析我们的网络数据流txt,然而txt此时已经是decode过的unicode编码,这样的话就会导致解析不了,出现上述问题。 解决的办法就是,改变目标文件的编码:
f = open(“out.html”,“w”,encoding=‘utf-8’)
这样,问题将不复存在。


 881
881

 被折叠的 条评论
为什么被折叠?
被折叠的 条评论
为什么被折叠?
 到【灌水乐园】发言


