


 本文介绍了如何利用Pushgateway作为中转站,让程序主动推送数据给Prometheus,并配置Prometheus拉取这些数据。同时,展示了如何在Grafana中展示Prometheus收集的指标,实现监控系统的可视化。通过设置静态配置,确保Prometheus能够成功连接到Pushgateway,并在Grafana中创建图表来展示监控数据。
pushgateway相当于Prometheus的中转站, 程序可以主动将数据推送给pushgateway并缓存起来,等待Prometheus拉取pushgateway中暂存的数据。可以在一些网络不直达的情况下充当代理,以及在某些生命周期较短不能等待Prometheus拉取的情况下使用pushgateway作为中转站暂存数据。
下载pushgateway-1.4.3.linux-amd64.tar.gz 解压缩到指定目录
下载地址 https://github.com/prometheus/pushgateway/releases
tar xzvf pushgateway-1.4.3.linux-amd64.tar.gz
mv pushgateway-1.4.3.linux-amd64 /usr/local/pushgateway
-
后台运行 pushgateway
nohup /usr/local/pushgateway/pushgateway > run.log 2>&1 &
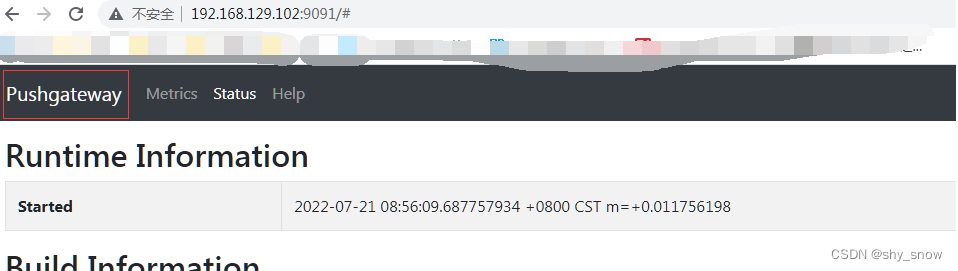
#查看 pushgateway默认端口9091
curl localhost:9091/metrics #访问 pushgateway-server:9091/metrics可以看到指标
-
配置prometheus.yml 后重载prometheus
- job_name: pushgateway
    honor_labels: true
    static_configs:
    - targets: ['192.168.129.102:9091']
      labels:
        instance: pushgateway
        service: pushgatewayservice
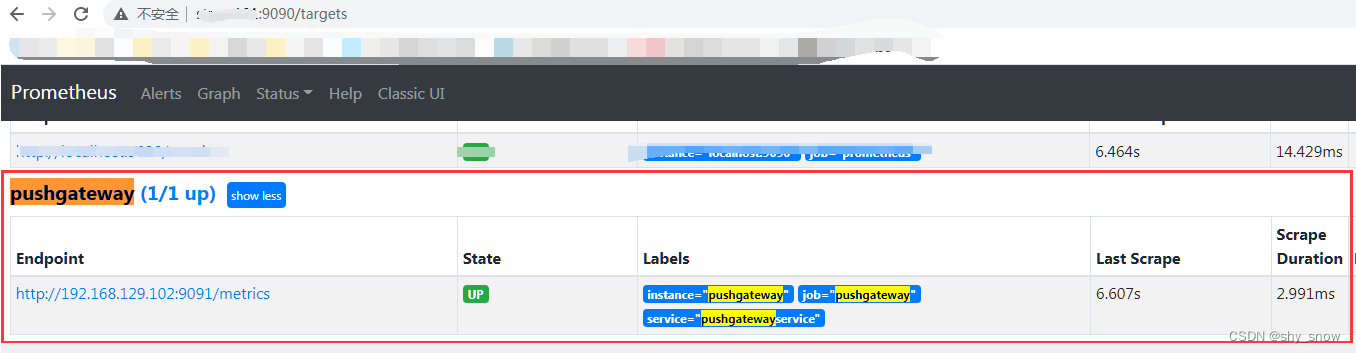
可以通过Prometheus Web端查看 http://192.168.129.102:9090/targets 中是否有设置的 pushgateway 的metrics。
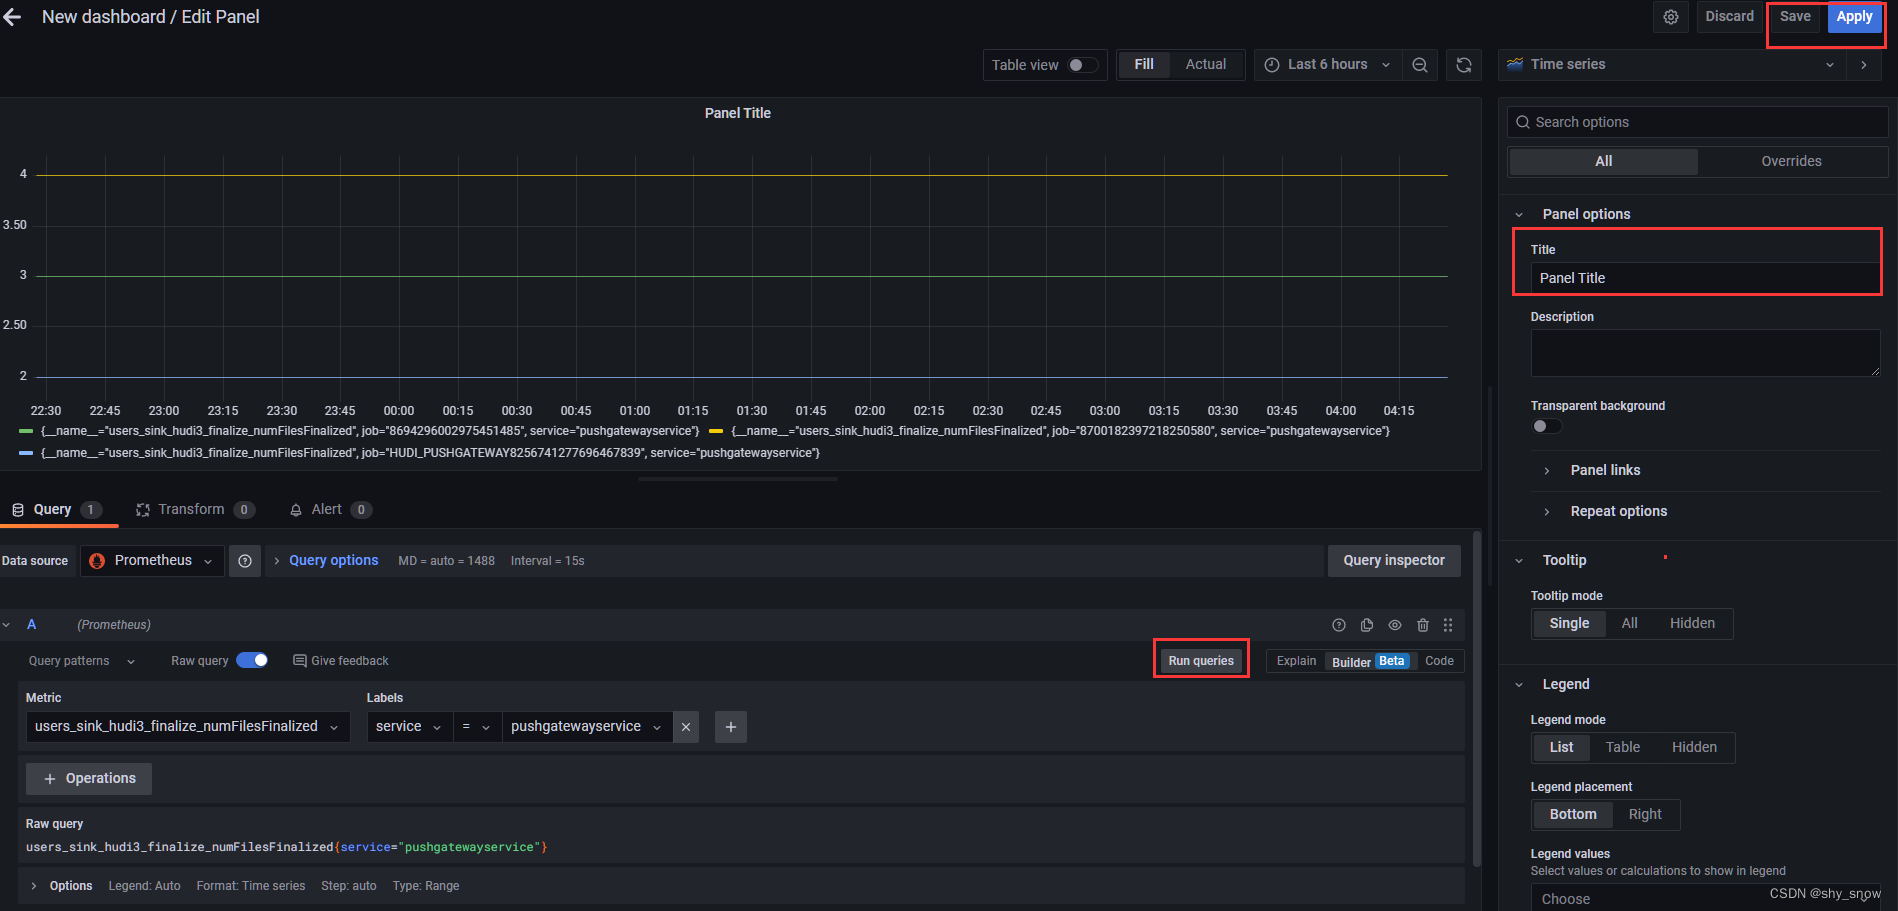
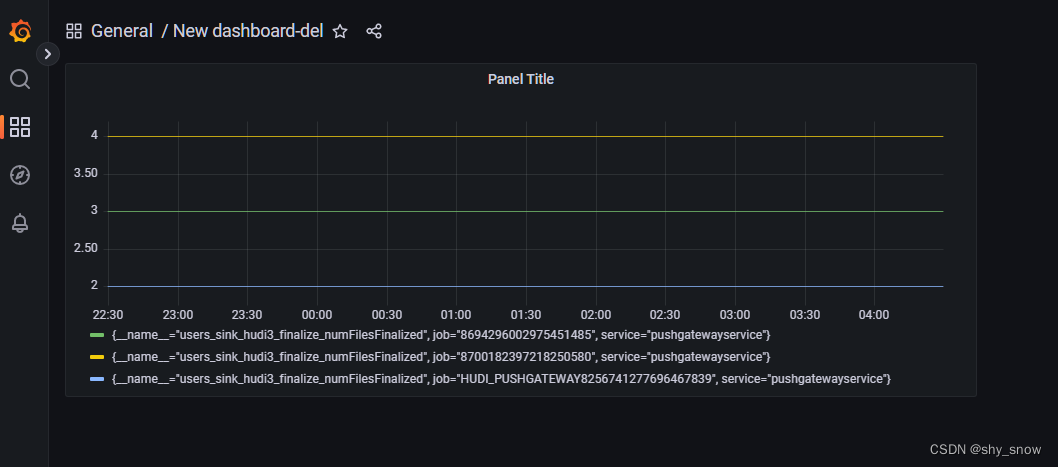
5. # 在grafana中将promethus指标数据展示为图表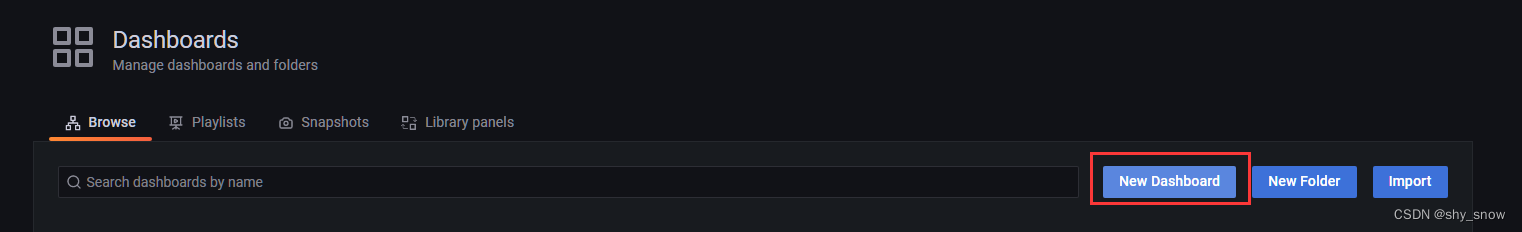
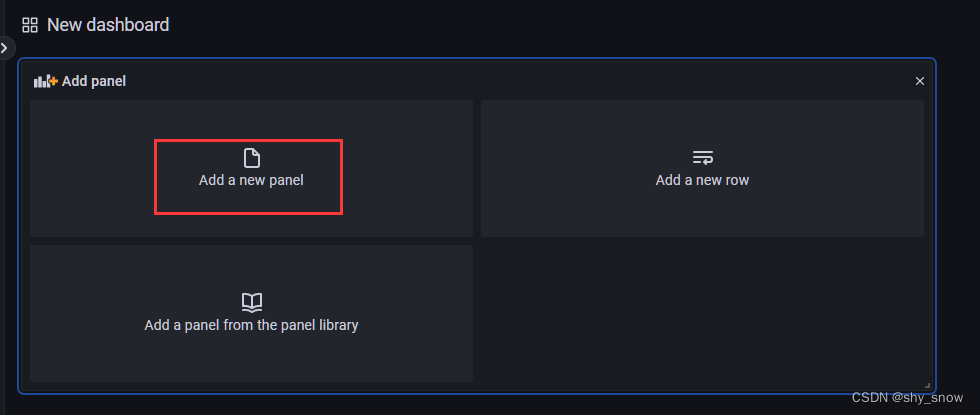
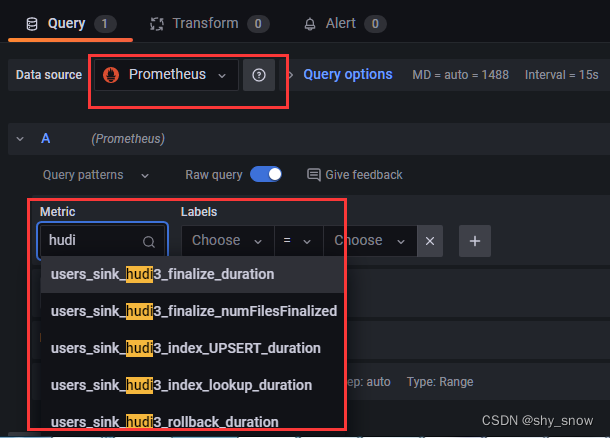
选取指标,及筛选条件后点击Run queries查看图表,修改title后保存


 1051
1051

 被折叠的 条评论
为什么被折叠?
被折叠的 条评论
为什么被折叠?
 到【灌水乐园】发言


