


一.环境说明以及效果展示
1.背景:在进行性能测试时,想直观看到服务器的瓶颈在哪里,cpu、内存占用多少,是否是网络因为导致性能上不去等等,而prometheus+node_exporter+grafana可以把从服务器采集到的信息直观进行展示。
2.环境说明:
使用一台轻量云主机(centos7.6,2c,4g)部署prometheus、node_exporter、grafana
云主机开放端口:41090、41091、41092,分别对应prometheus、node_exporter、grafana的端口
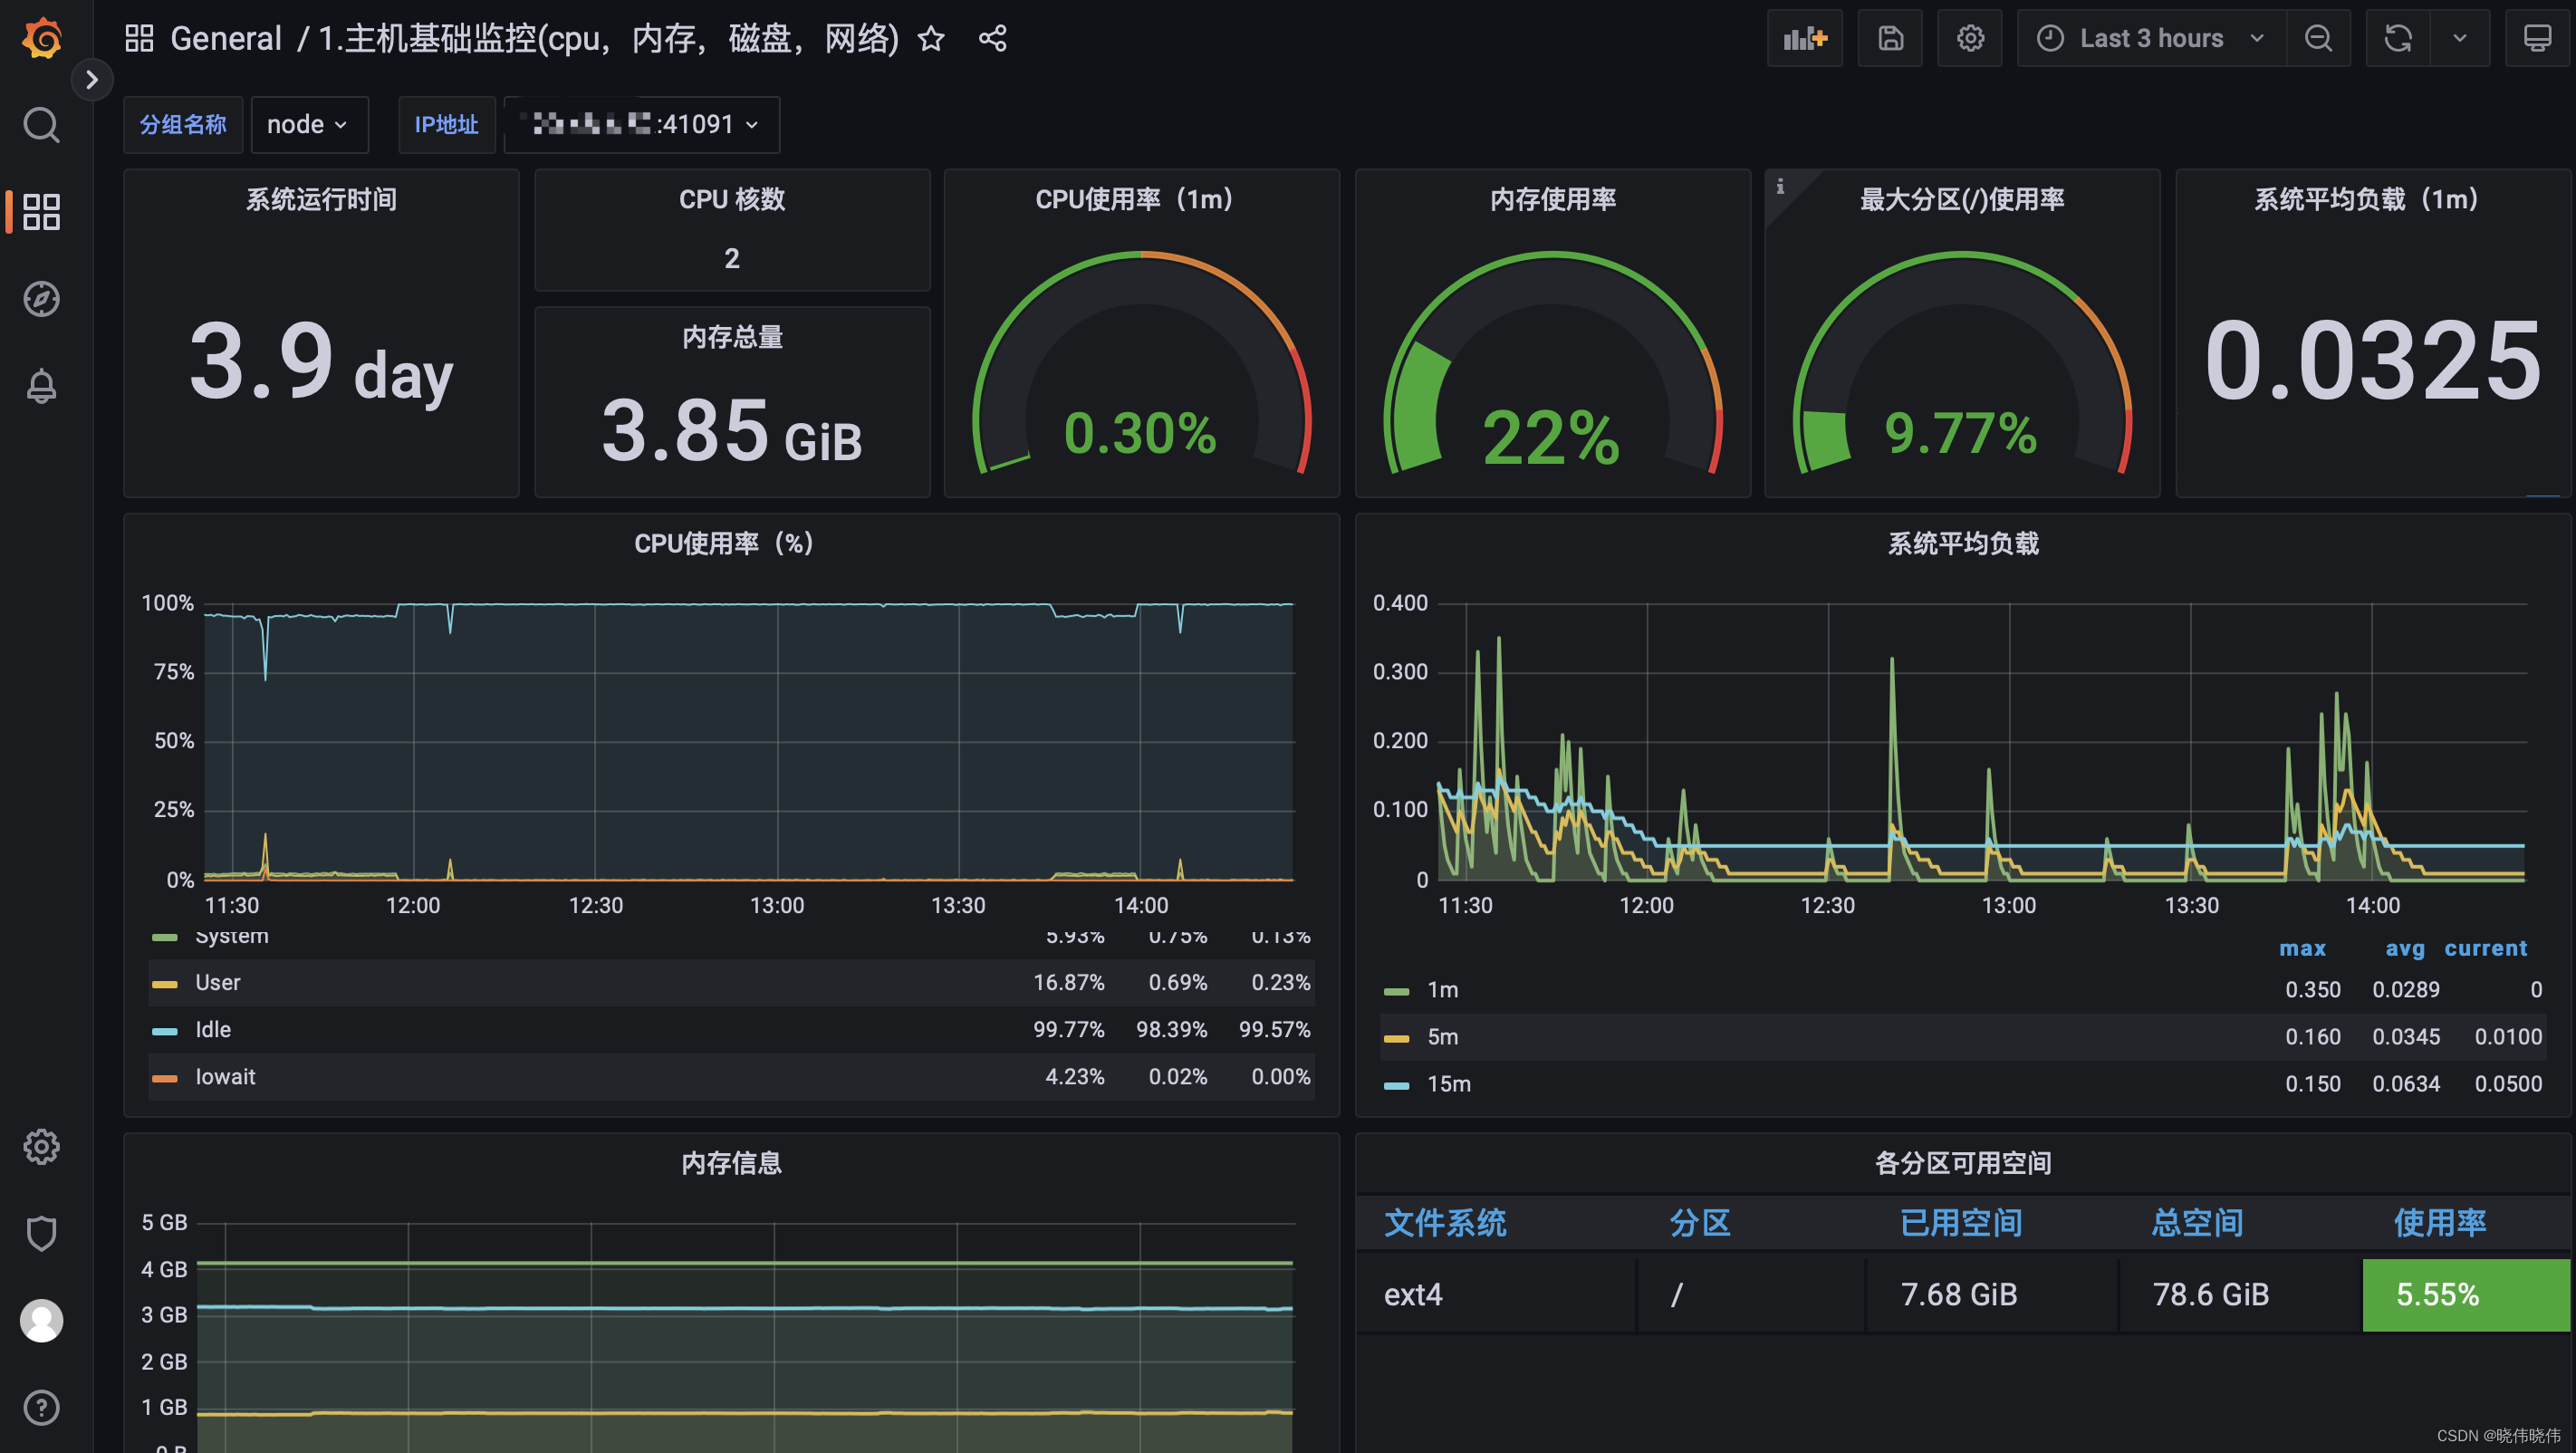
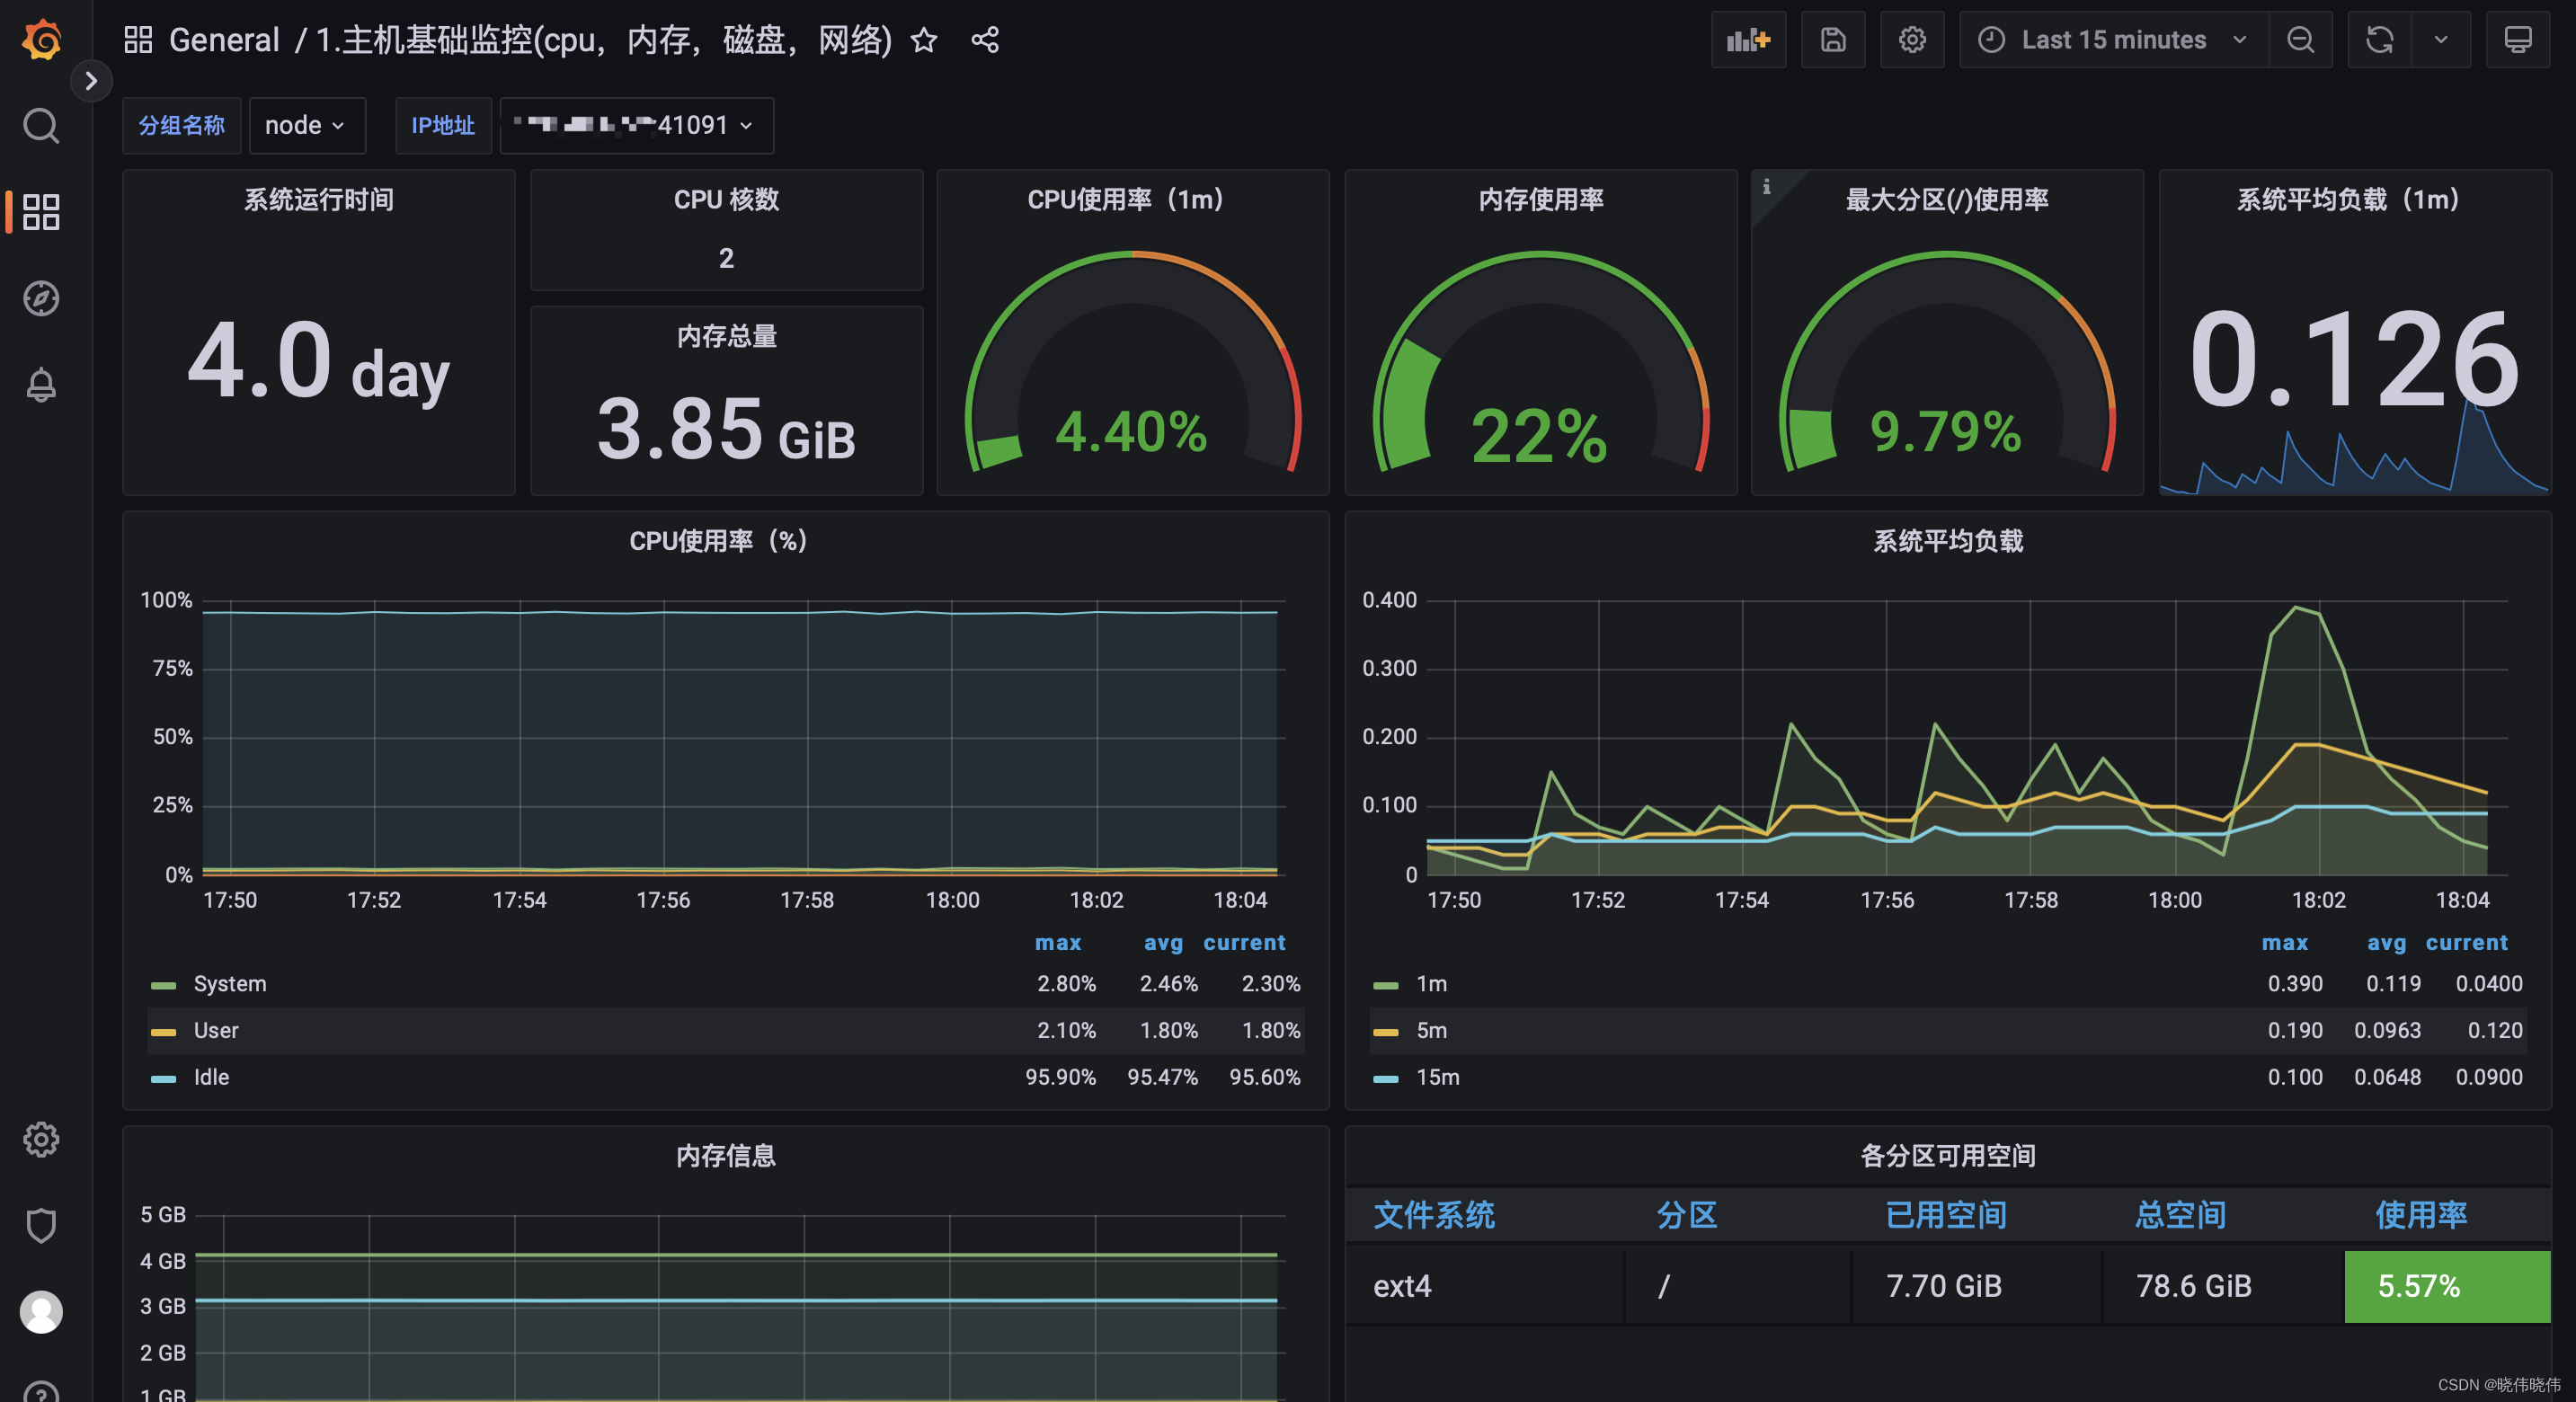
3.最终效果:
二.部署prometheus
1.下载地址:https://prometheus.io/download/
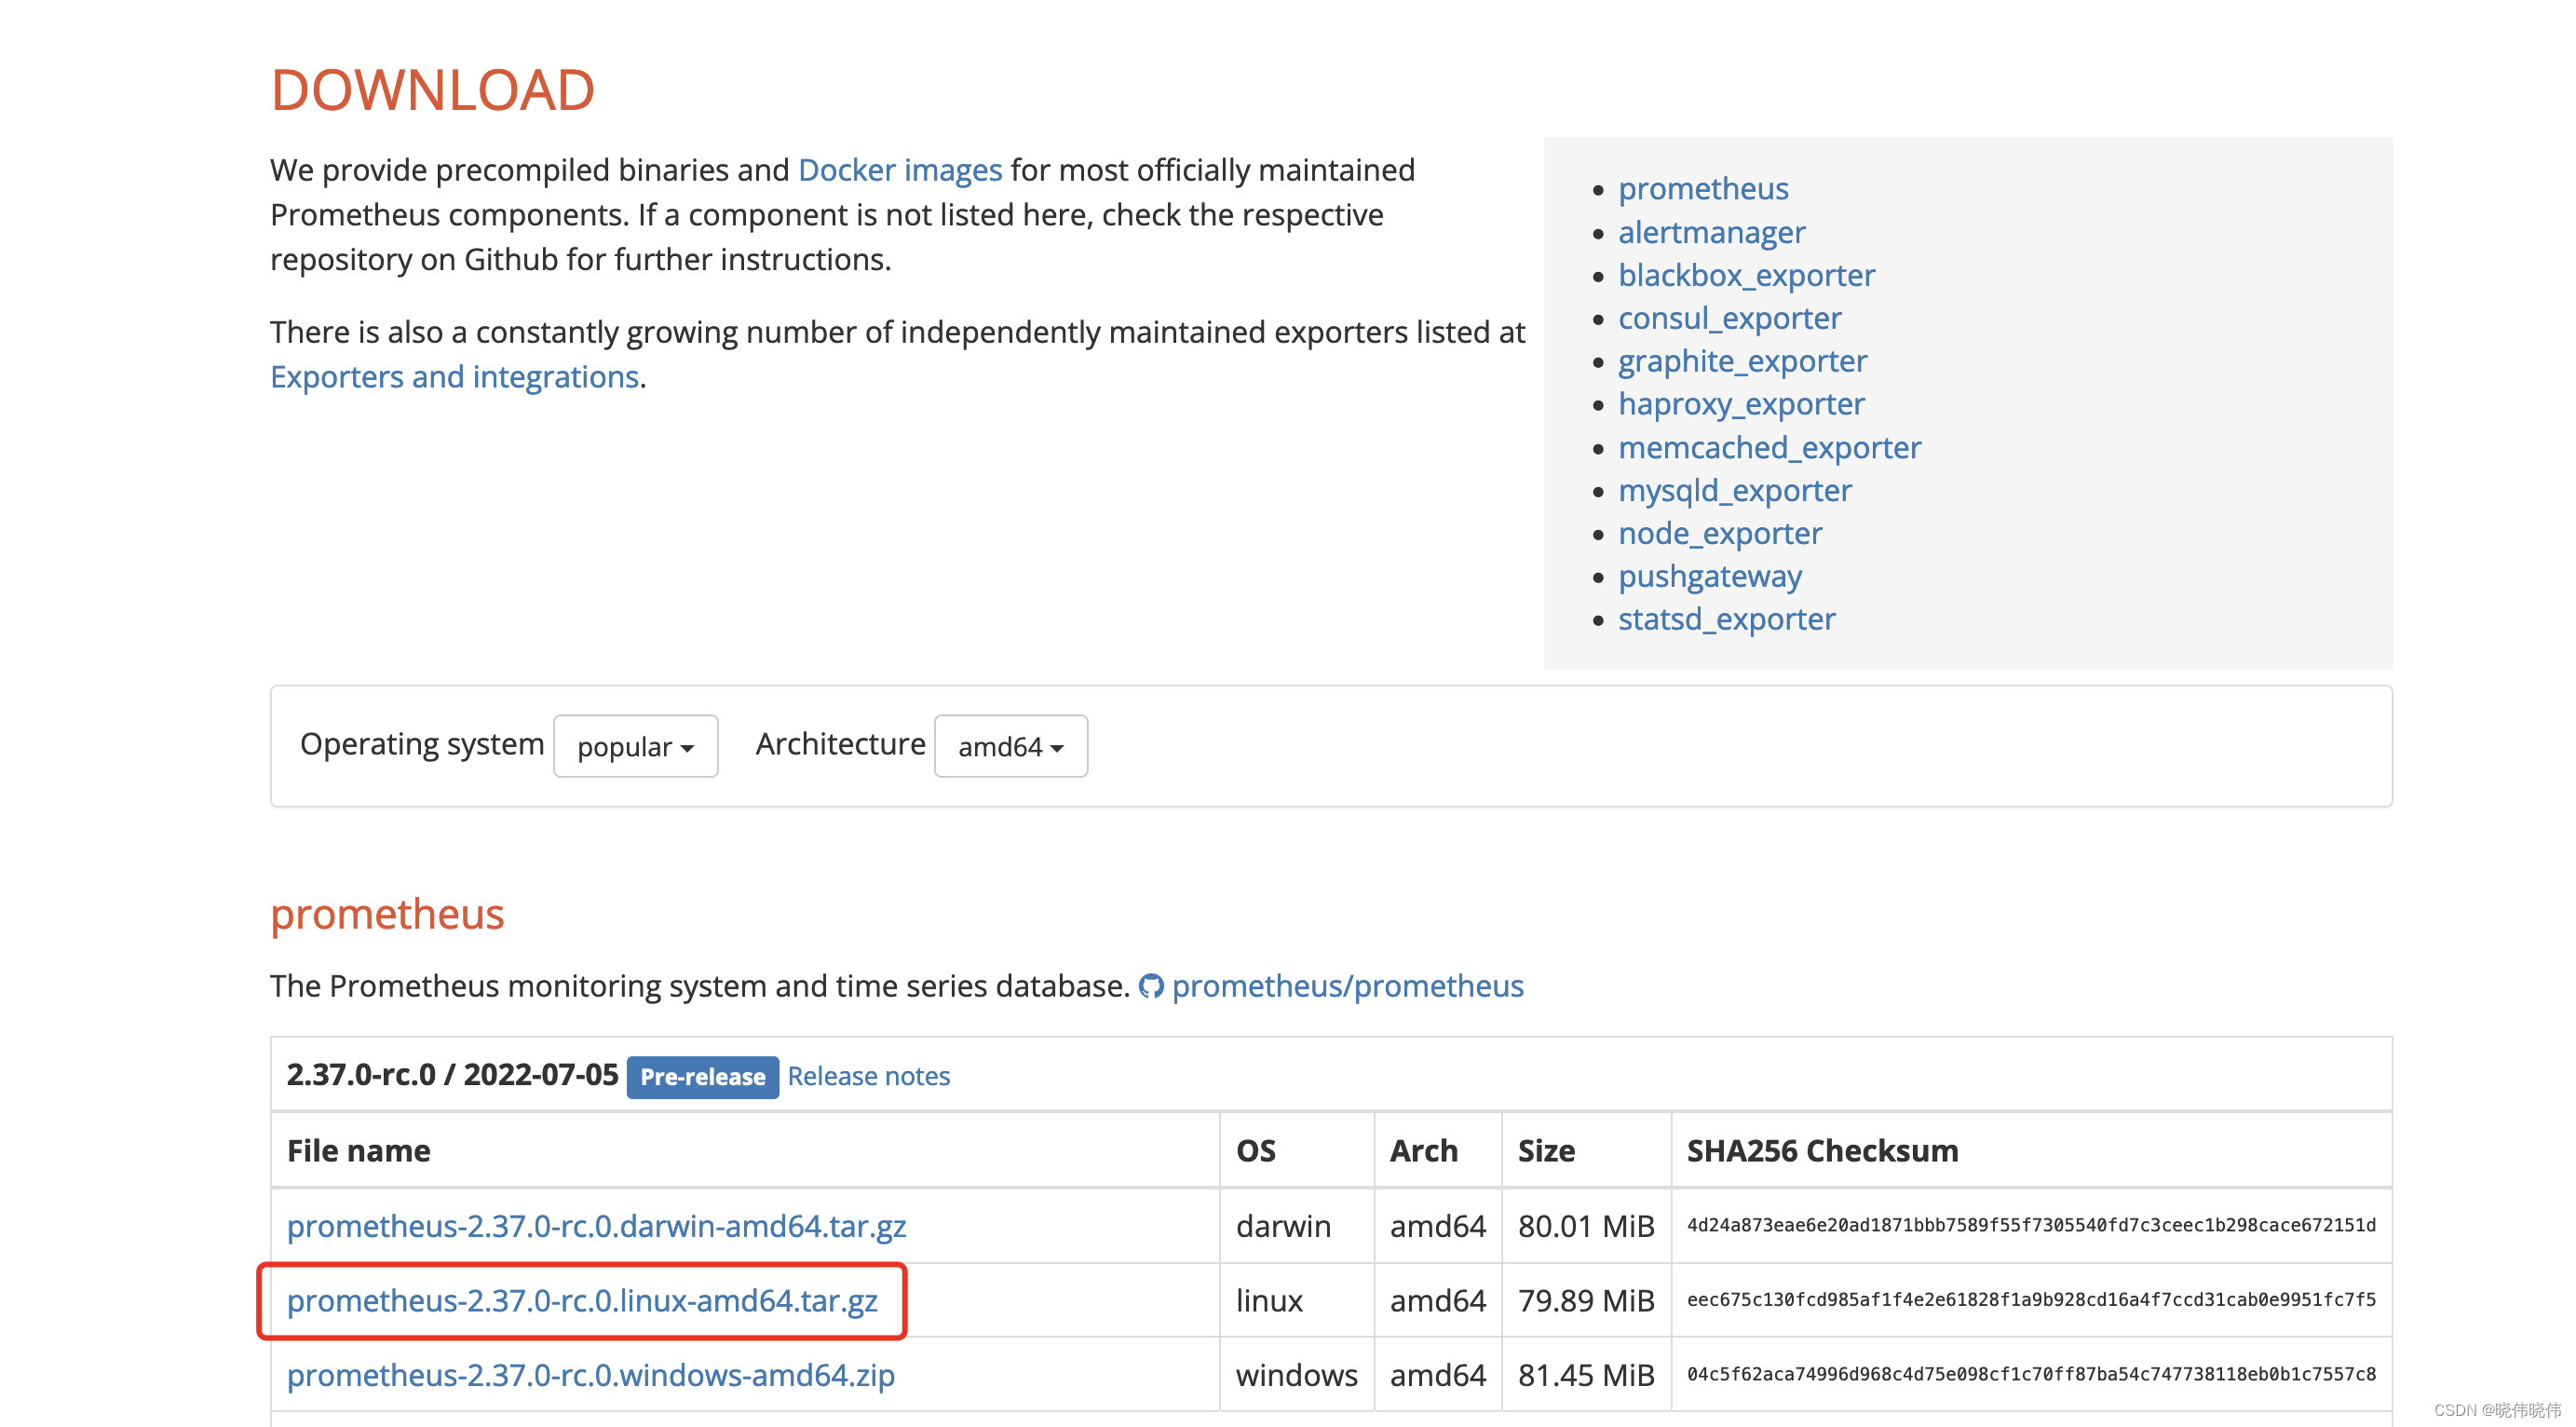
2.根据系统以及cpu架构,下载对应的压缩包(下载过程可能需要翻墙),然后拷贝到服务器,进行解压:tar -zxvf prometheus-2.37-rc.0.linux-amd64.tar.gz
3.进入到解压后的目录,vim prometheus.yml,以端口41090为例,修改配置文件如下,将主机ip以及端口修改:
rule_files:
  # - "first_rules.yml"
  # - "second_rules.yml"

# A scrape configuration containing exactly one endpoint to scrape:
# Here it's Prometheus itself.
scrape_configs:
  # The job name is added as a label `job=<job_name>` to any timeseries scraped from this config.
  - job_name: "prometheus"

    # metrics_path defaults to '/metrics'
    # scheme defaults to 'http'.

    static_configs:
      - targets: ["主机ip:41090"]
4.以后台运行方式启动prometheus:
nohup ./prometheus --config.file="/root/prometheus/prometheus-2.37.0-rc.0.linux-amd64/prometheus.yml" --web.listen-address=:41090 &
5.查看41090端口是否启动成功:lsof -i:41090
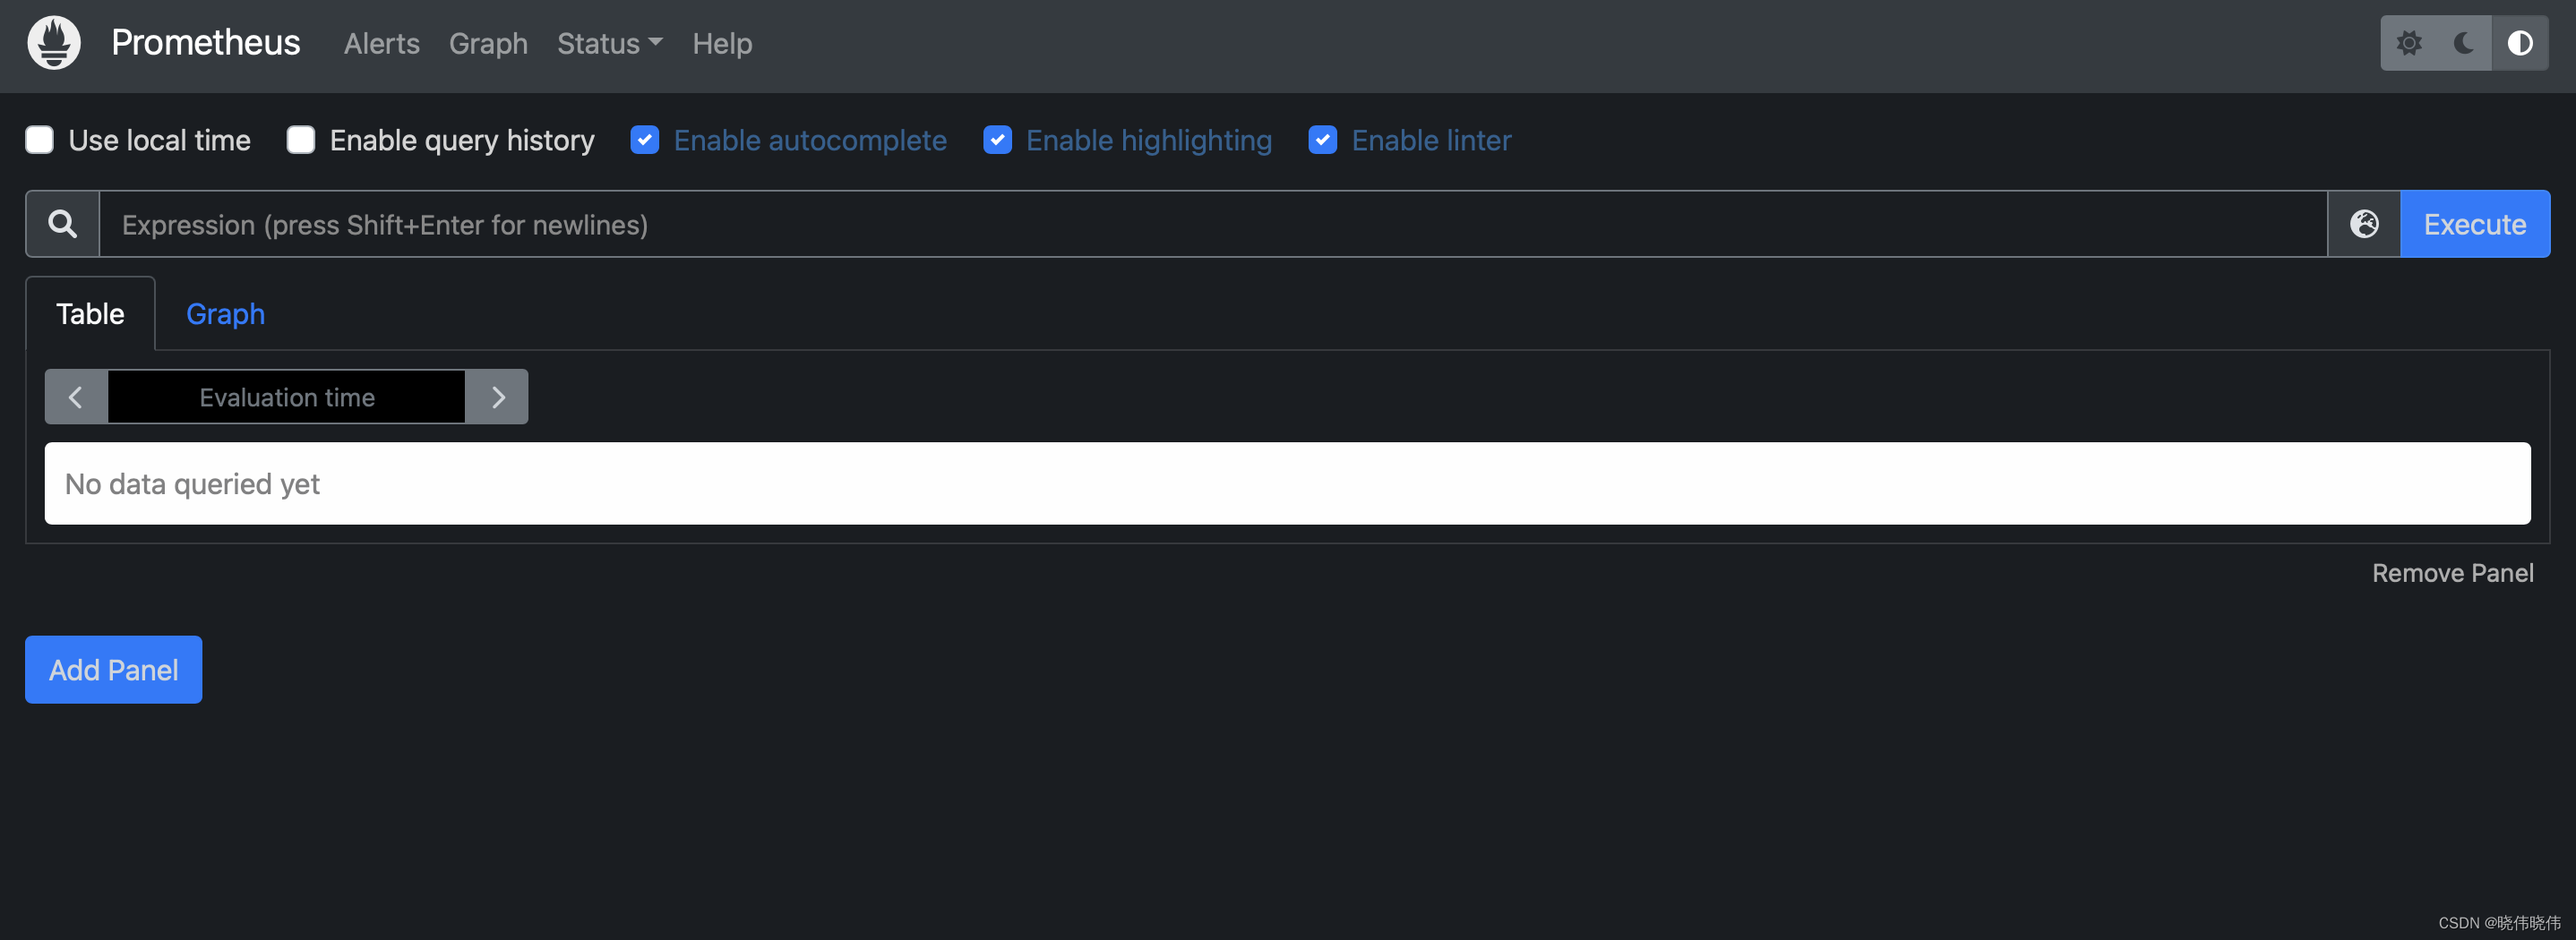
6.使用浏览器访问:http://ip:41090 可以查看到如下页面:
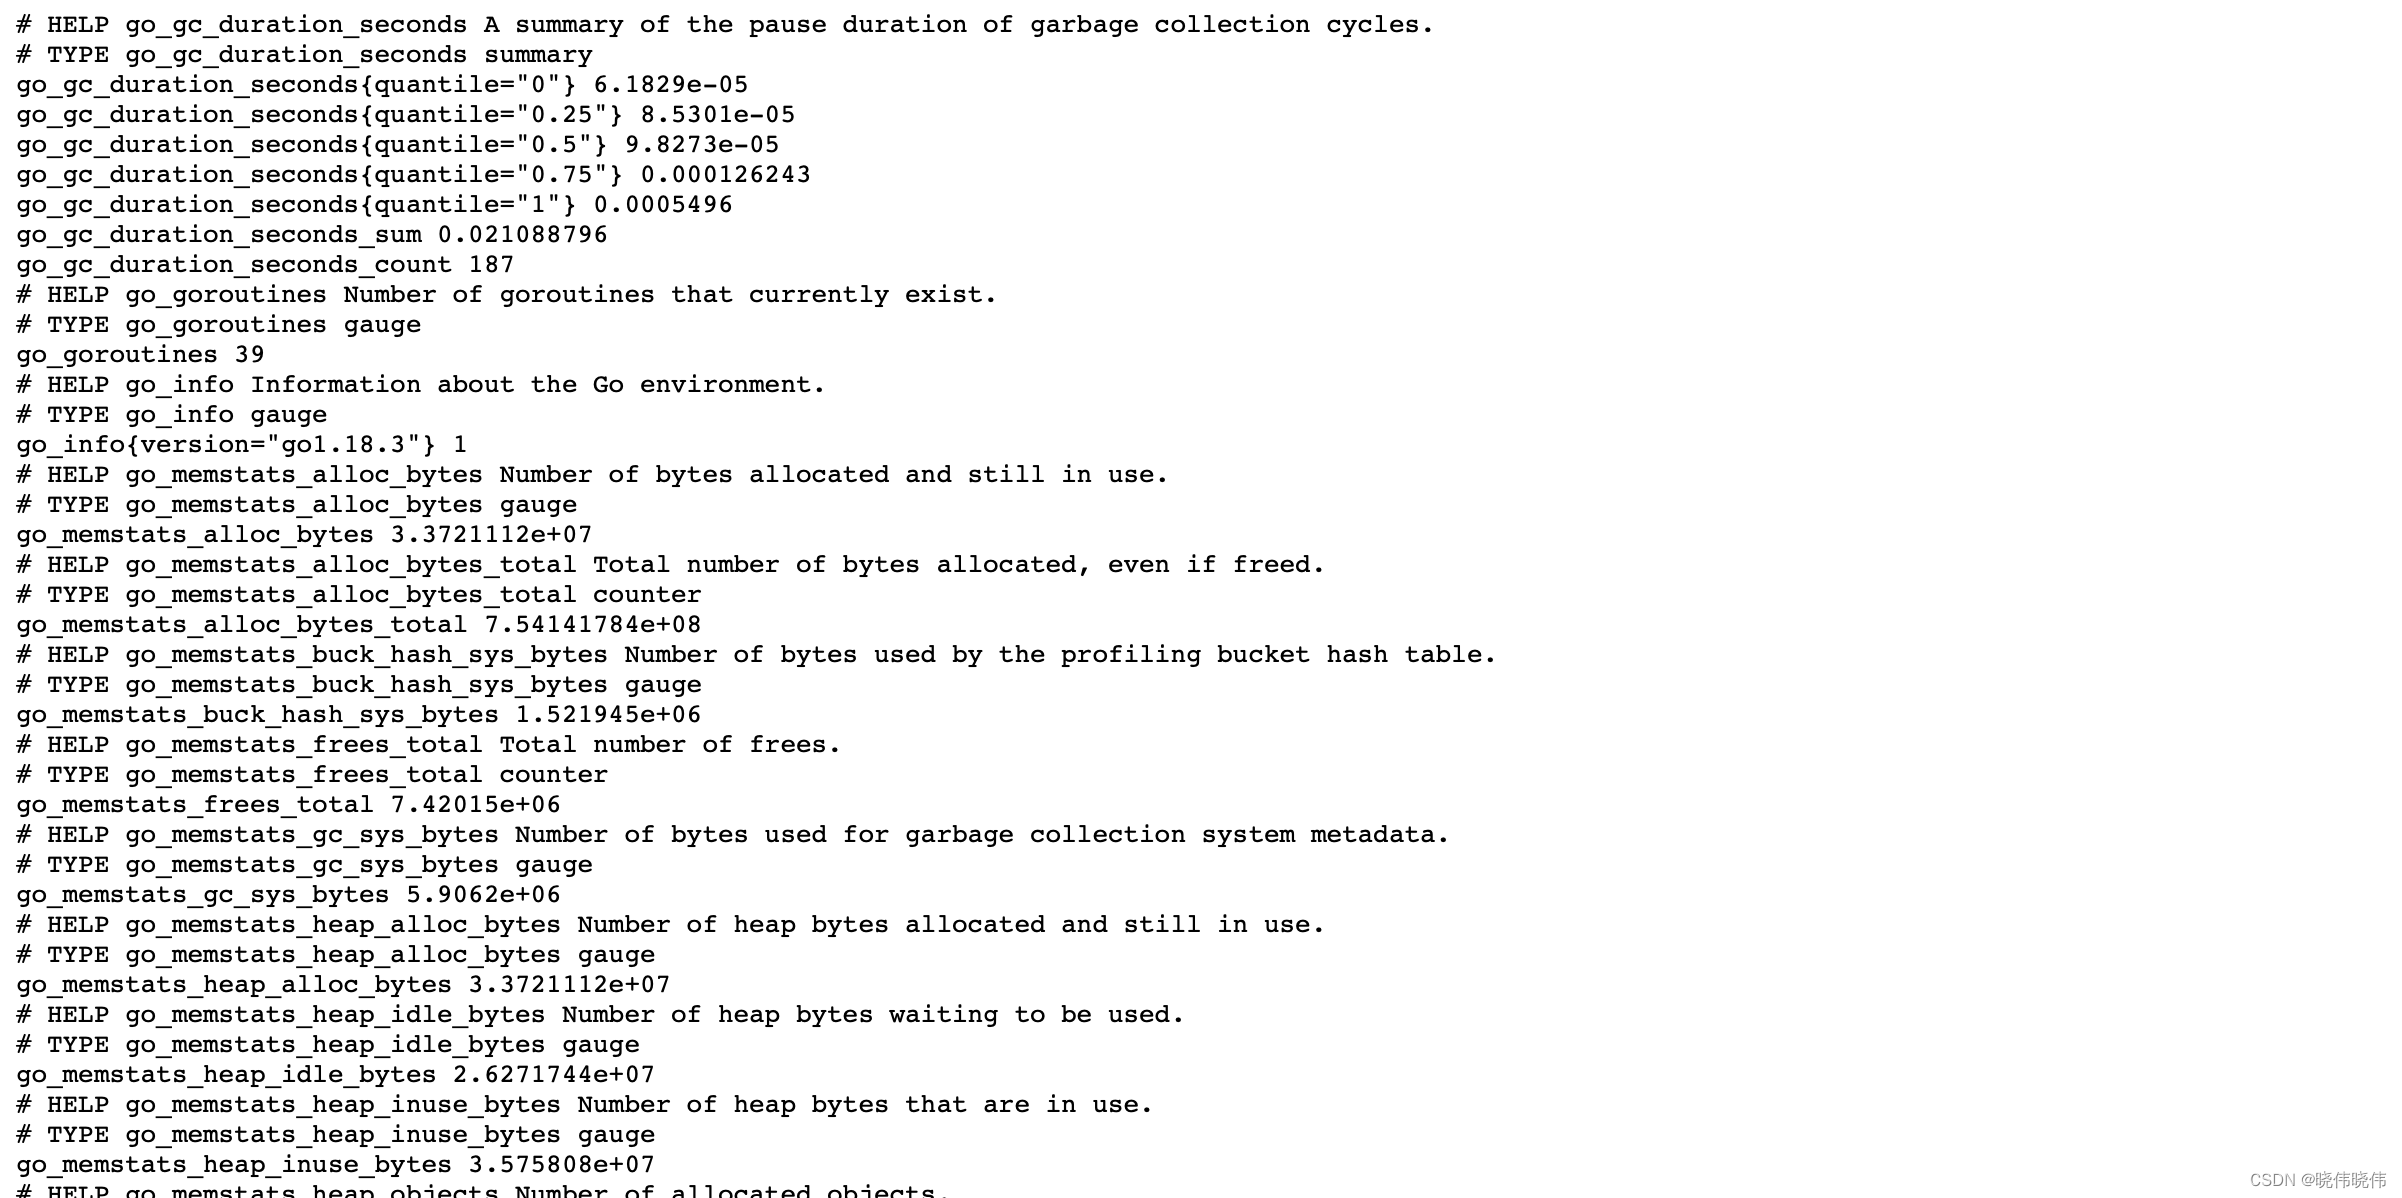
使用浏览器访问:http://ip:41090/metrics 可以查看到主机数据展示如下:
三.部署node_exporter
通过node_exporter进行远程的主机监控。由于被监控的主机就是prometheus所在机器,故安装到同一主机下
1.下载地址:https://prometheus.io/download/
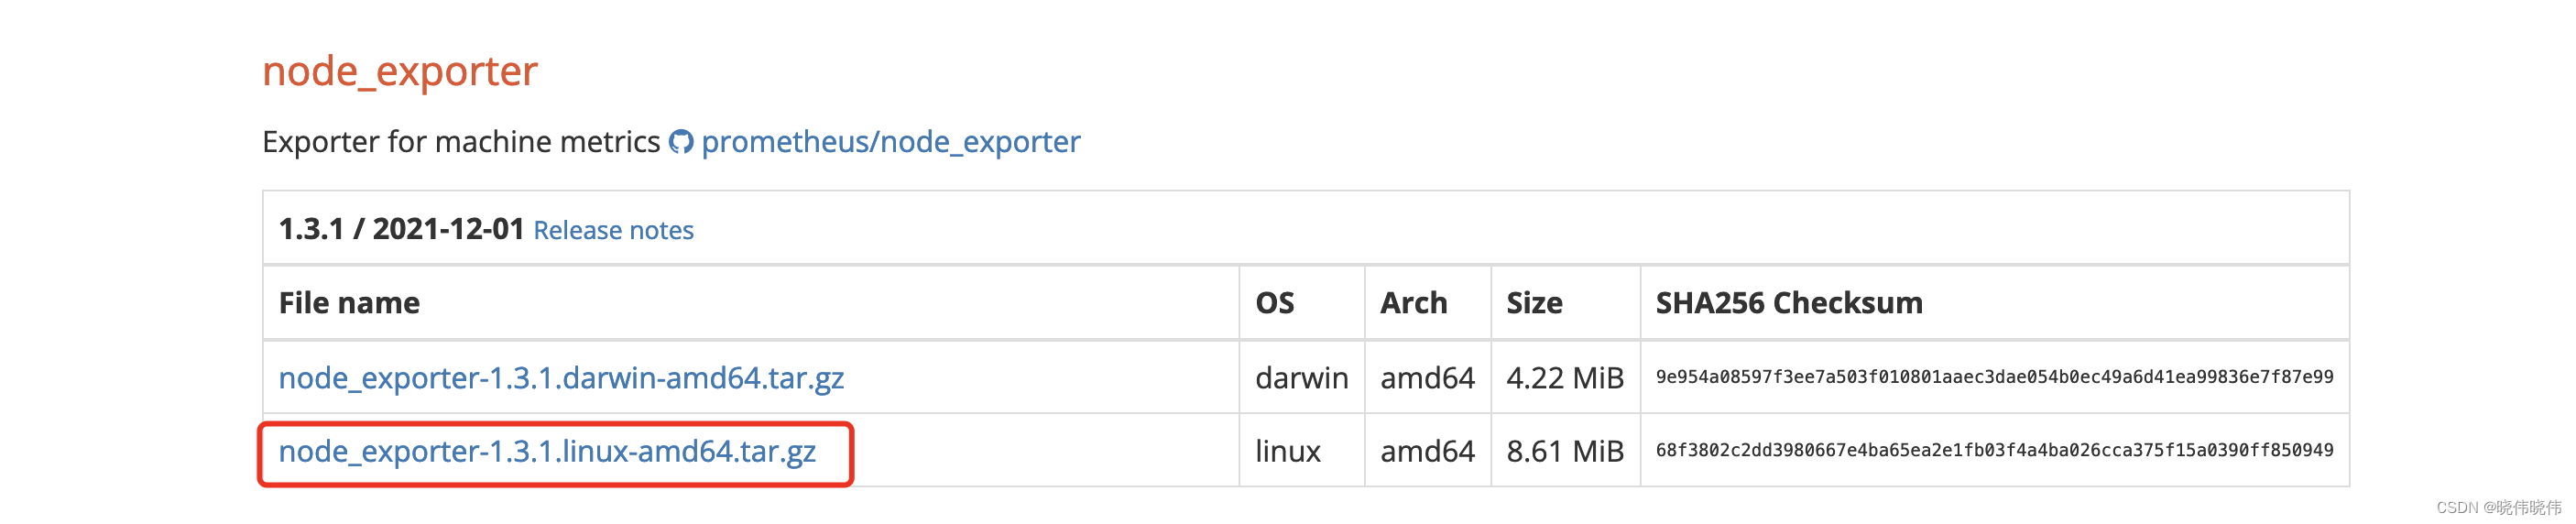
2.根据系统下载对应的压缩包(下载过程可能需要翻墙),然后拷贝到服务器,进行解压:tar -zxvf node_exporter-1.3.1.linux-amd64.tar.gz
3.进入到解压后的目录,以端口41091为例,以后台运行方式启动node_exporter:
nohup ./node_exporter --web.listen-address=:41091 &
4.查看41091端口是否启动成功:lsof -i:41091
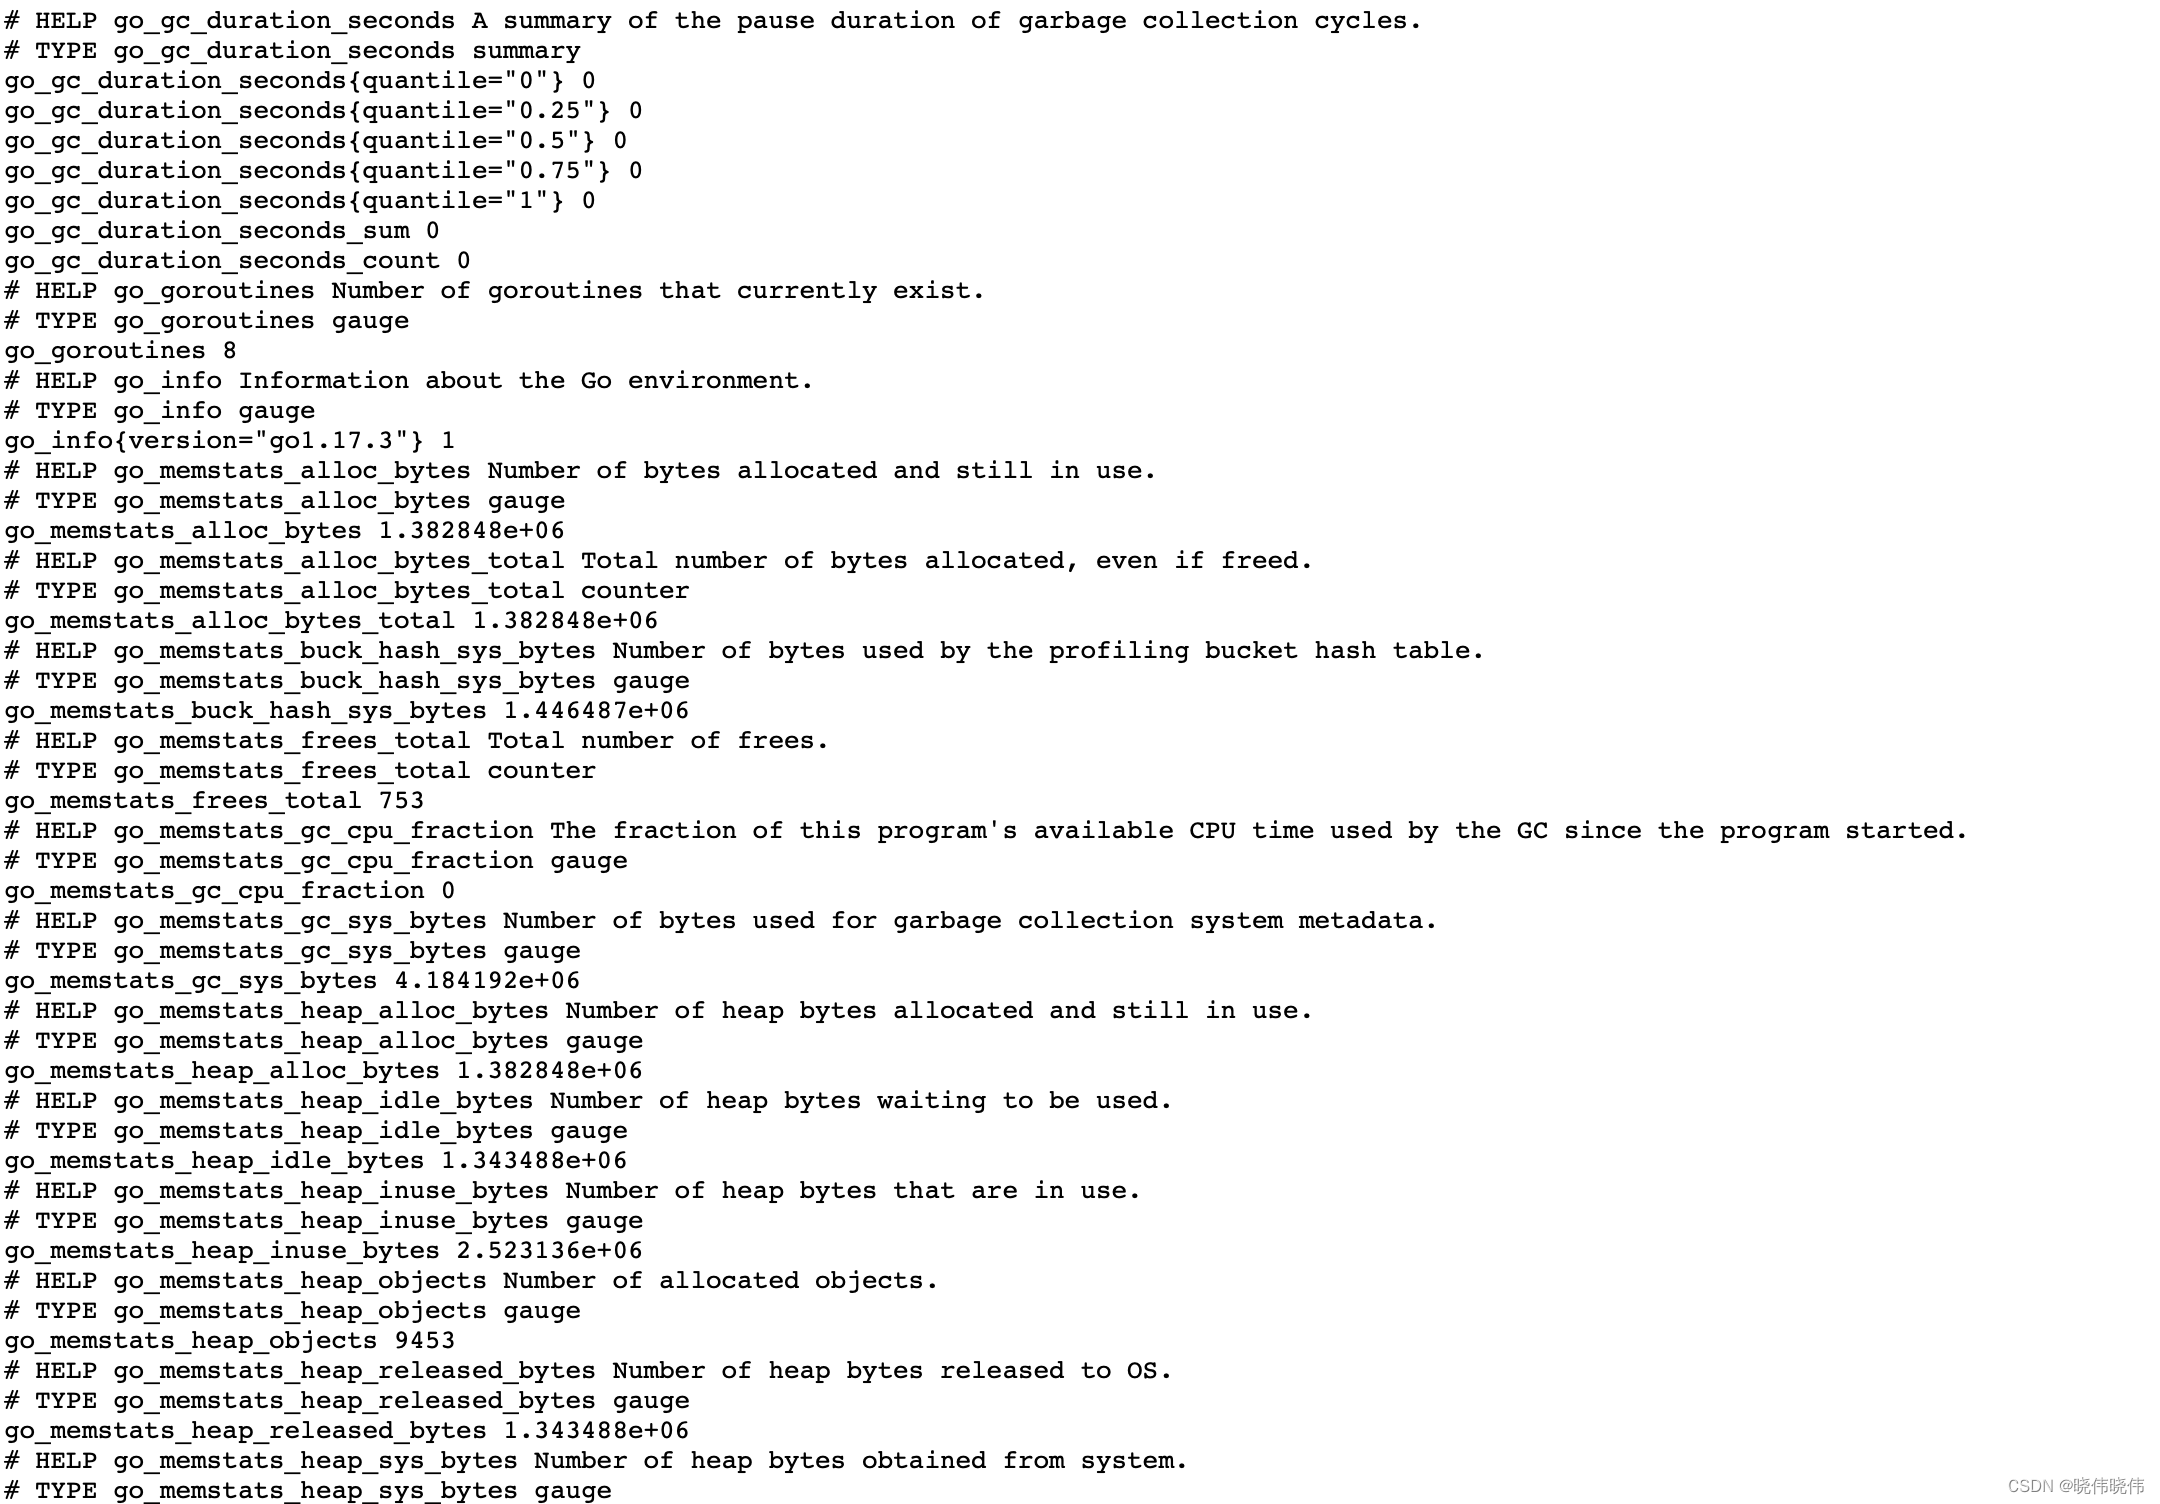
5.使用浏览器访问:http://ip:41091/metrics 可以查看到主机数据展示如下:
6.进入prometheus目录,修改配置文件vim vim prometheus.yml,修改如下:
scrape_configs:
  # The job name is added as a label `job=<job_name>` to any timeseries scraped from this config.
  - job_name: "prometheus"

    # metrics_path defaults to '/metrics'
    # scheme defaults to 'http'.

    static_configs:
      - targets: ["ip:41090"]
  - job_name: "node"
    static_configs:
      - targets: ["ip:41091"]
7.修改配置文件后,重启prometheus服务:
pkill prometheus
nohup ./prometheus --config.file="/root/prometheus/prometheus-2.37.0-rc.0.linux-amd64/prometheus.yml" --web.listen-address=:41090 &
lsof -i:41090
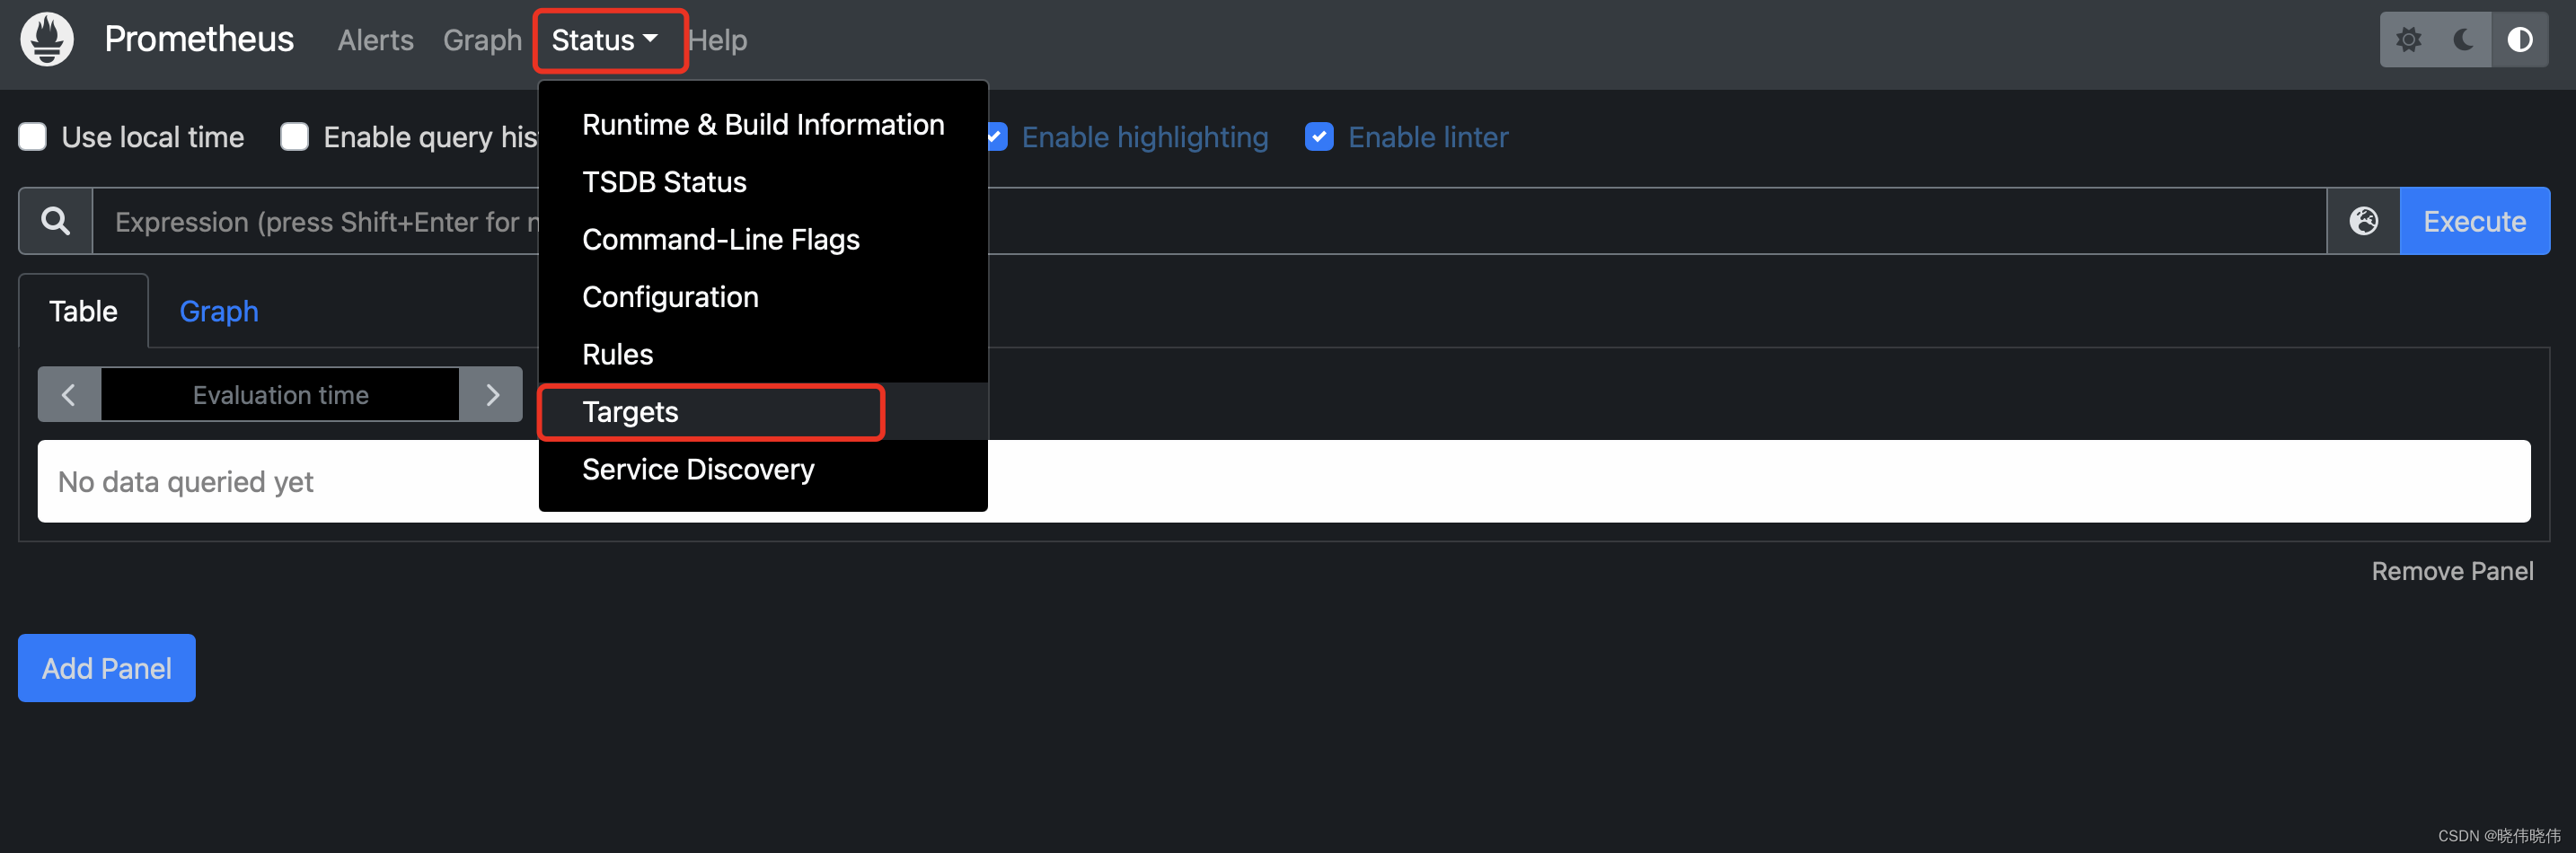
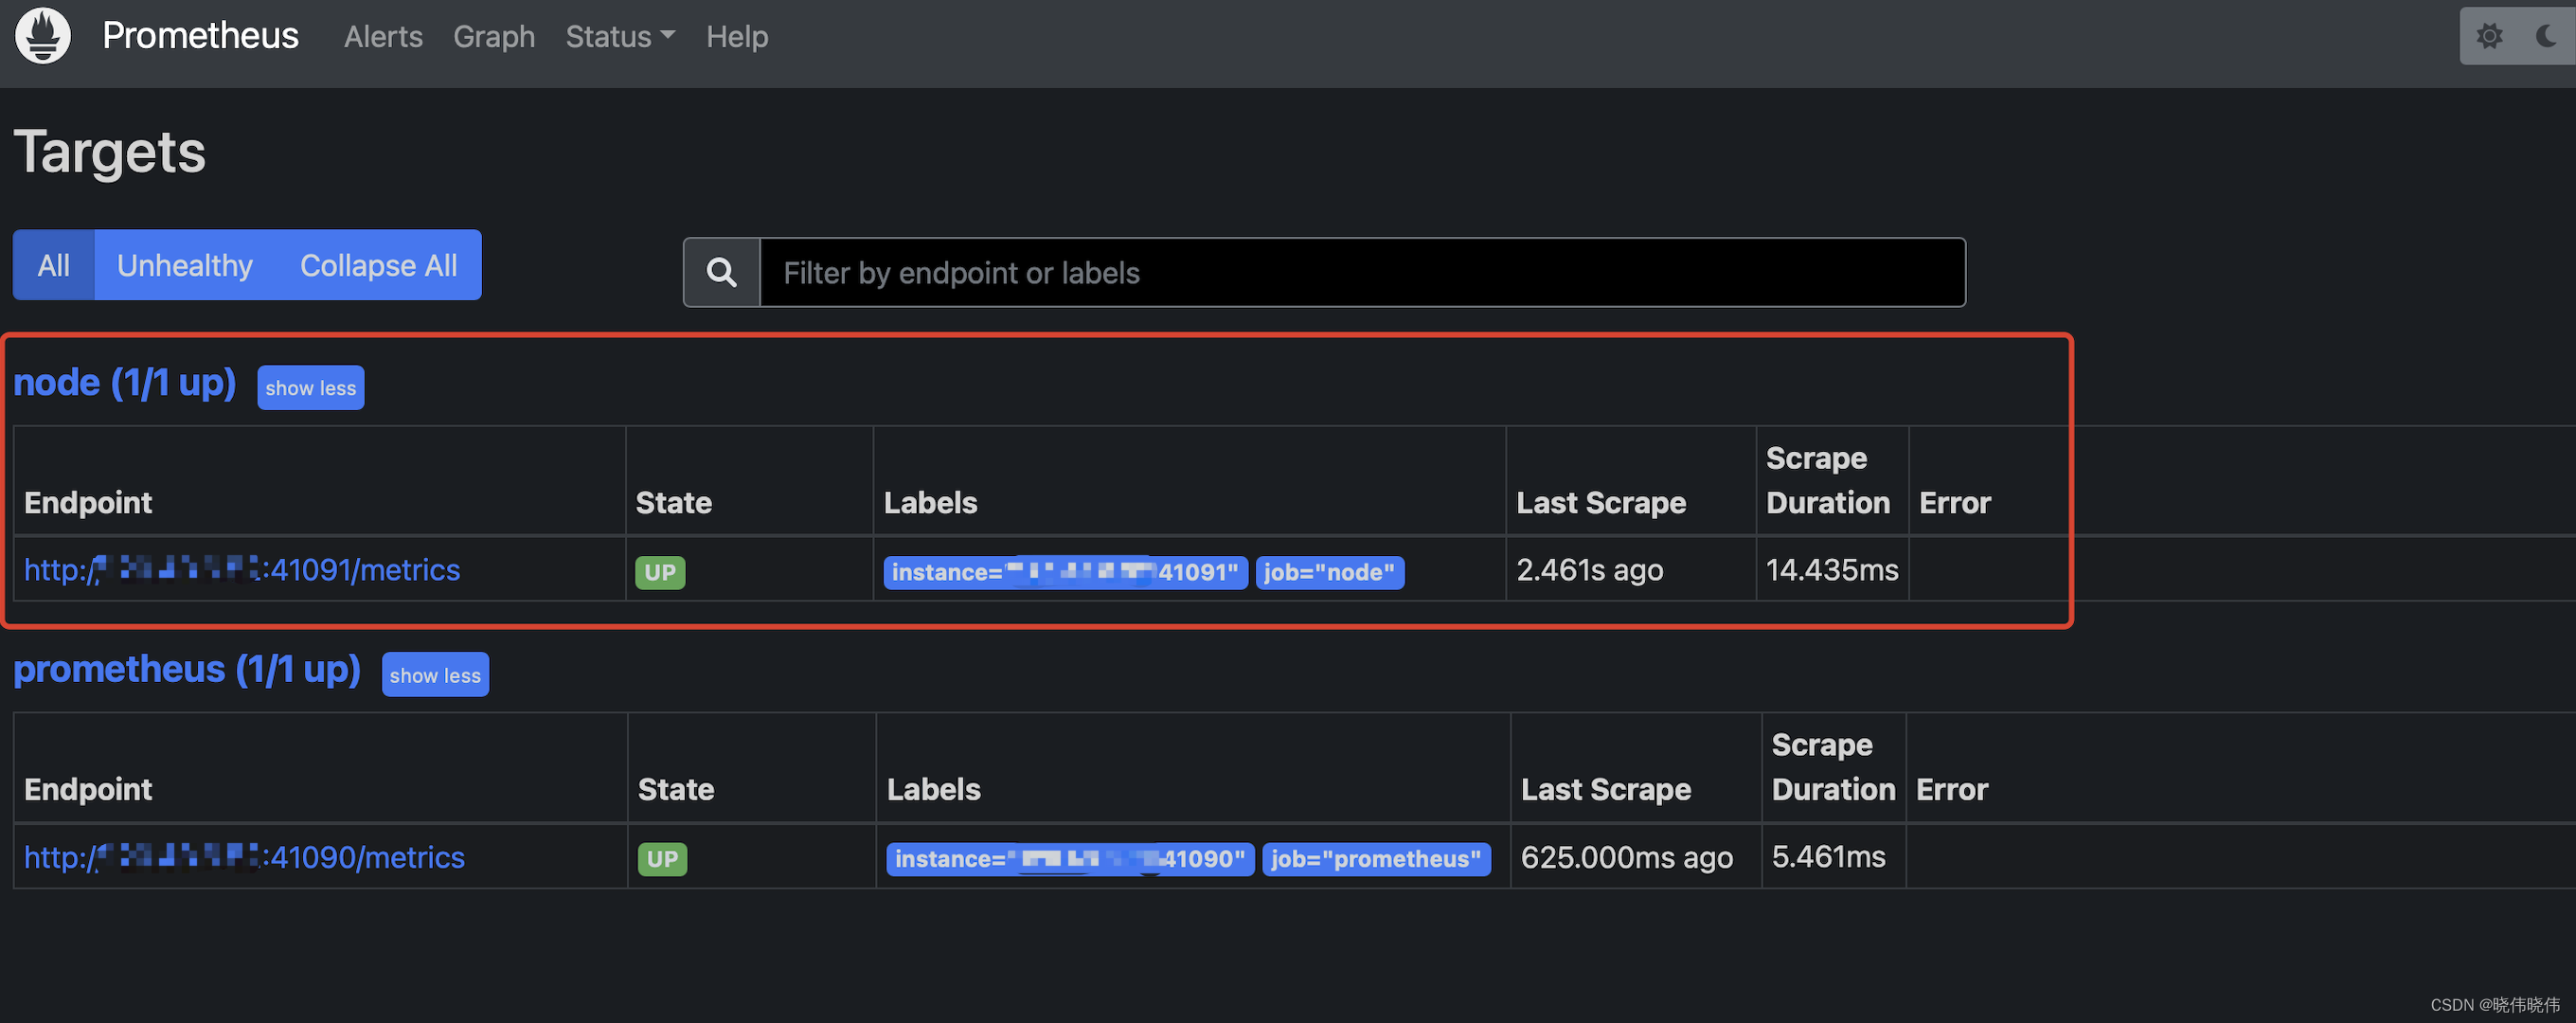
8.使用浏览器访问 http://ip:41090 点击status,弹出下拉框点击targets,能查看到添加到节点
四.部署Grafana
Gafana在此处就是一个看板功能,将prometheus采集到的数据源通过Grafana进行展示
1.下载Grafana:
方式一通过wget(此种方式下载速度较慢):
https://grafana.com/grafana/download
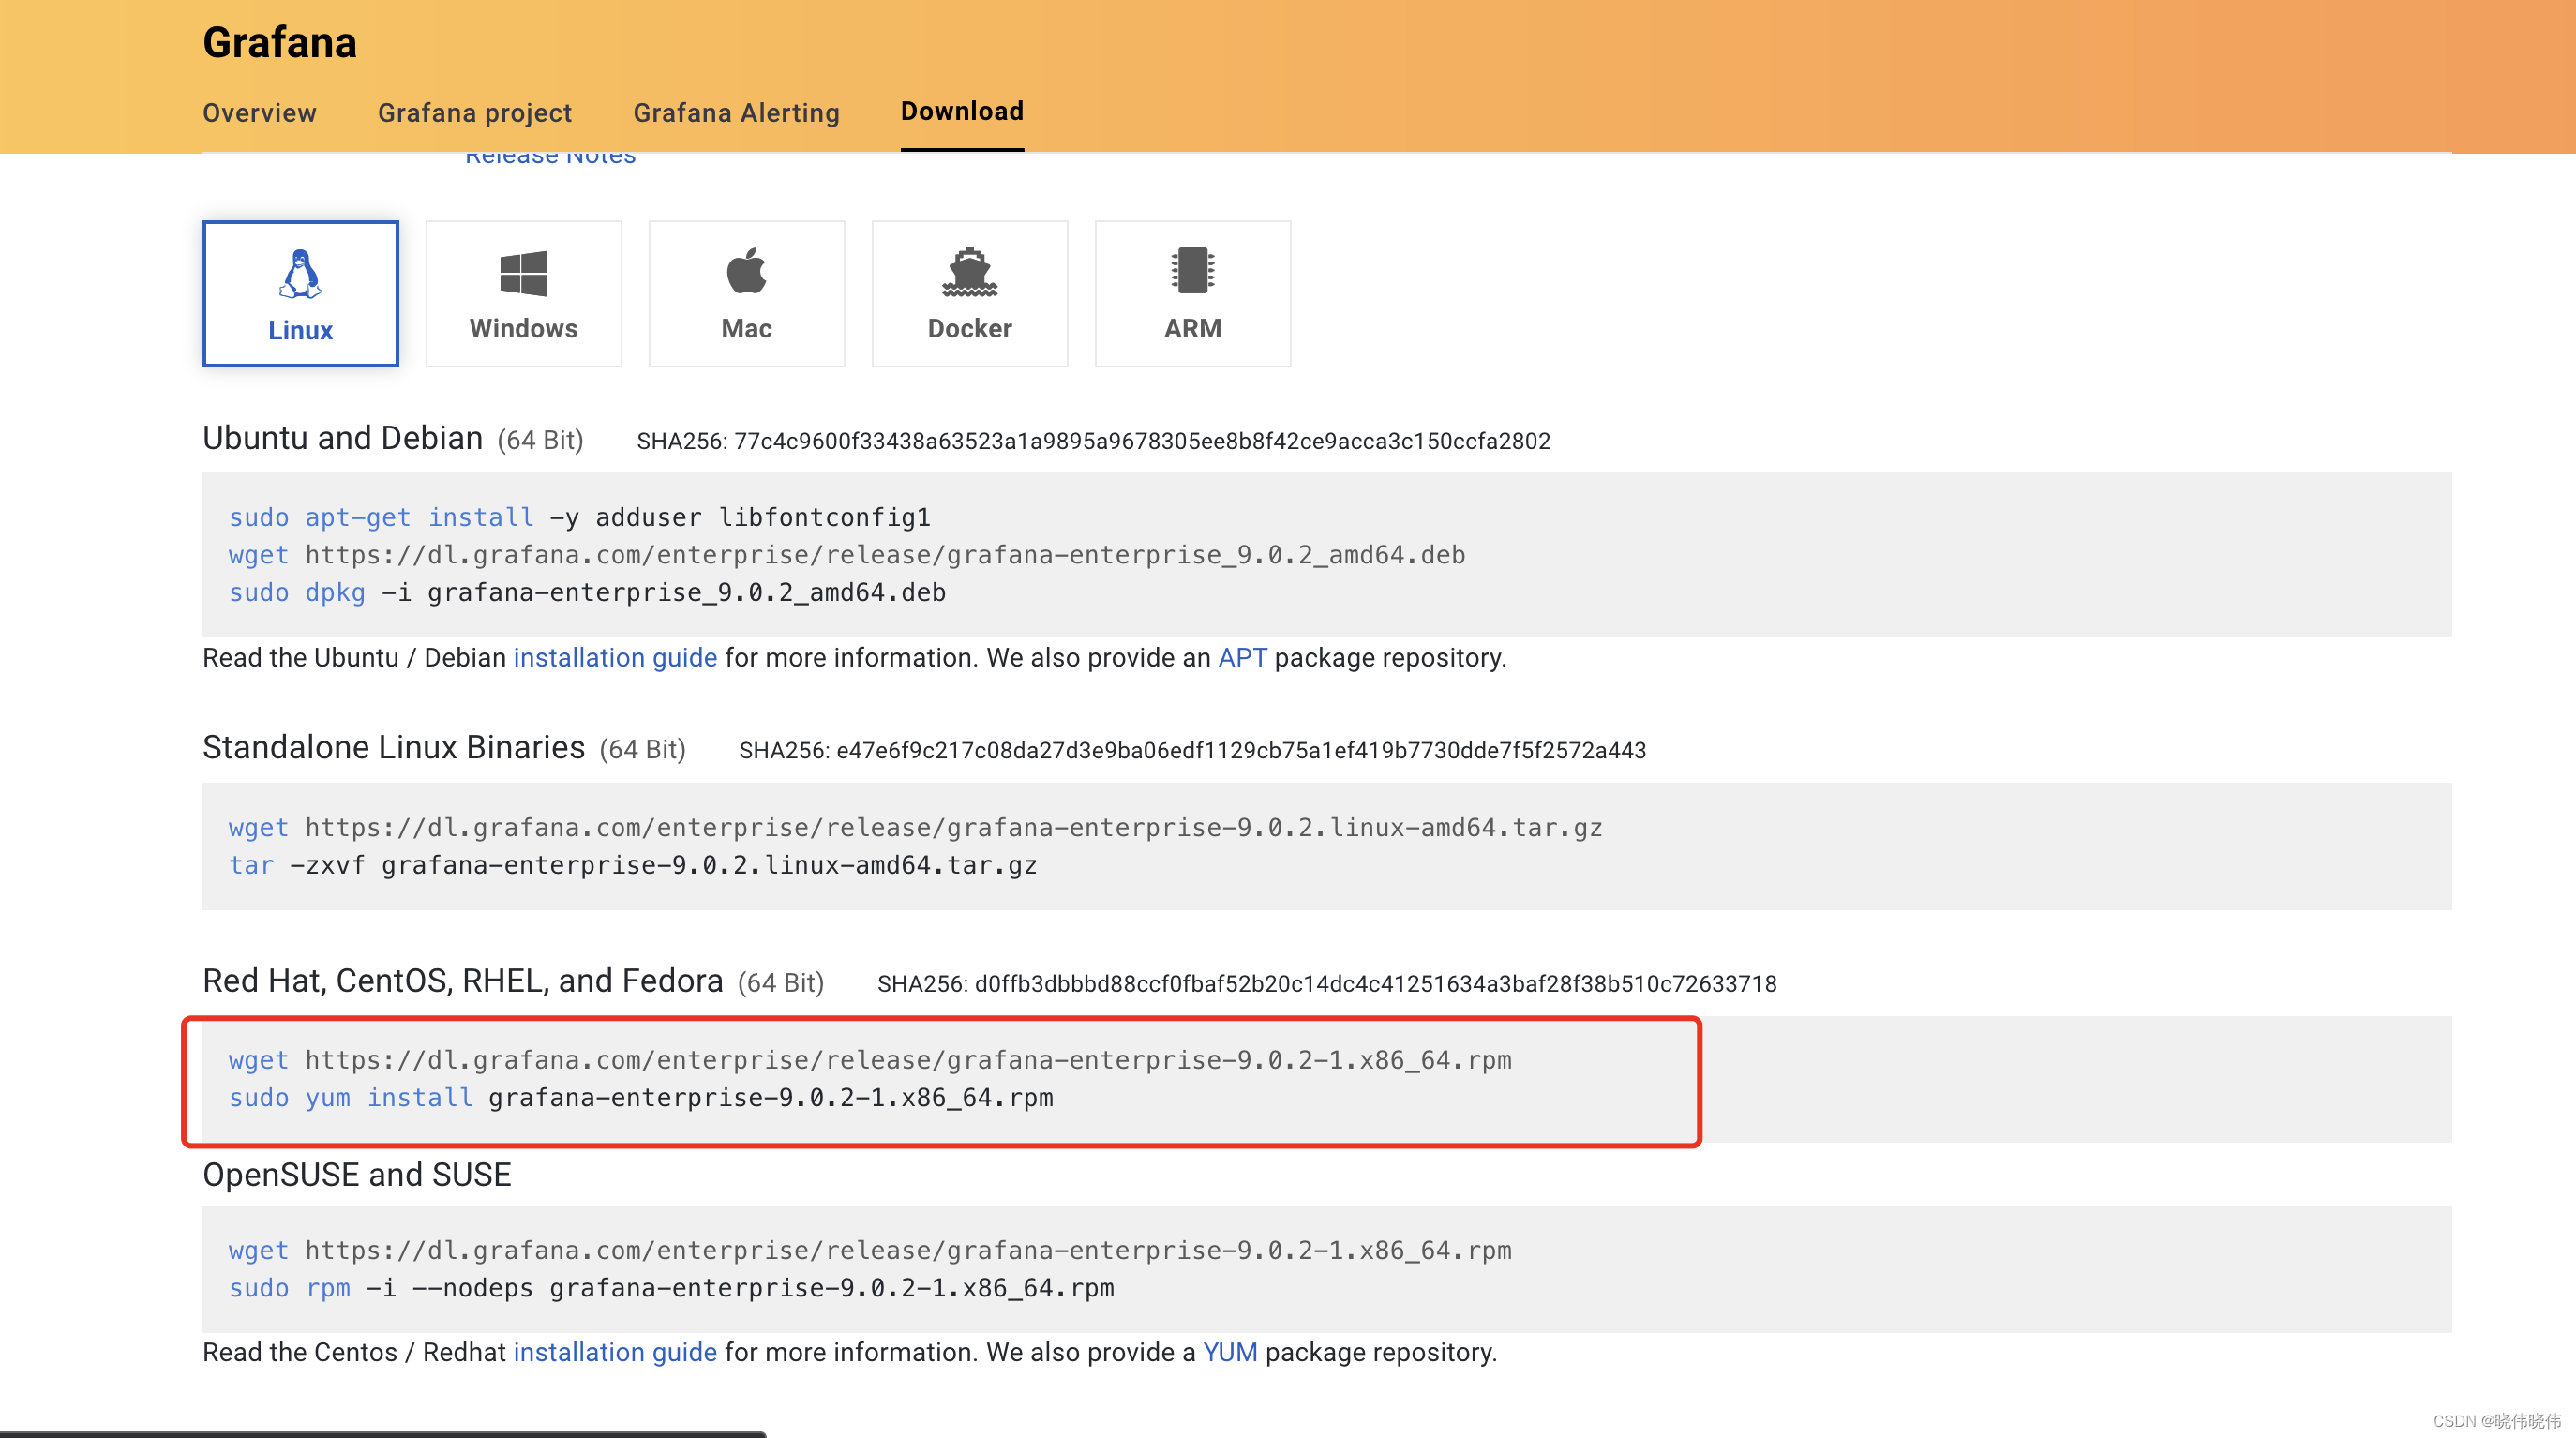
以centos为例:
wget https://dl.grafana.com/enterprise/release/grafana-enterprise-9.0.2-1.x86_64.rpm
sudo yum install grafana-enterprise-9.0.2-1.x86_64.rpm
方式二使用国内镜像下载然后上传到服务器,进行解压安装
地址:https://mirrors.huaweicloud.com/grafana/
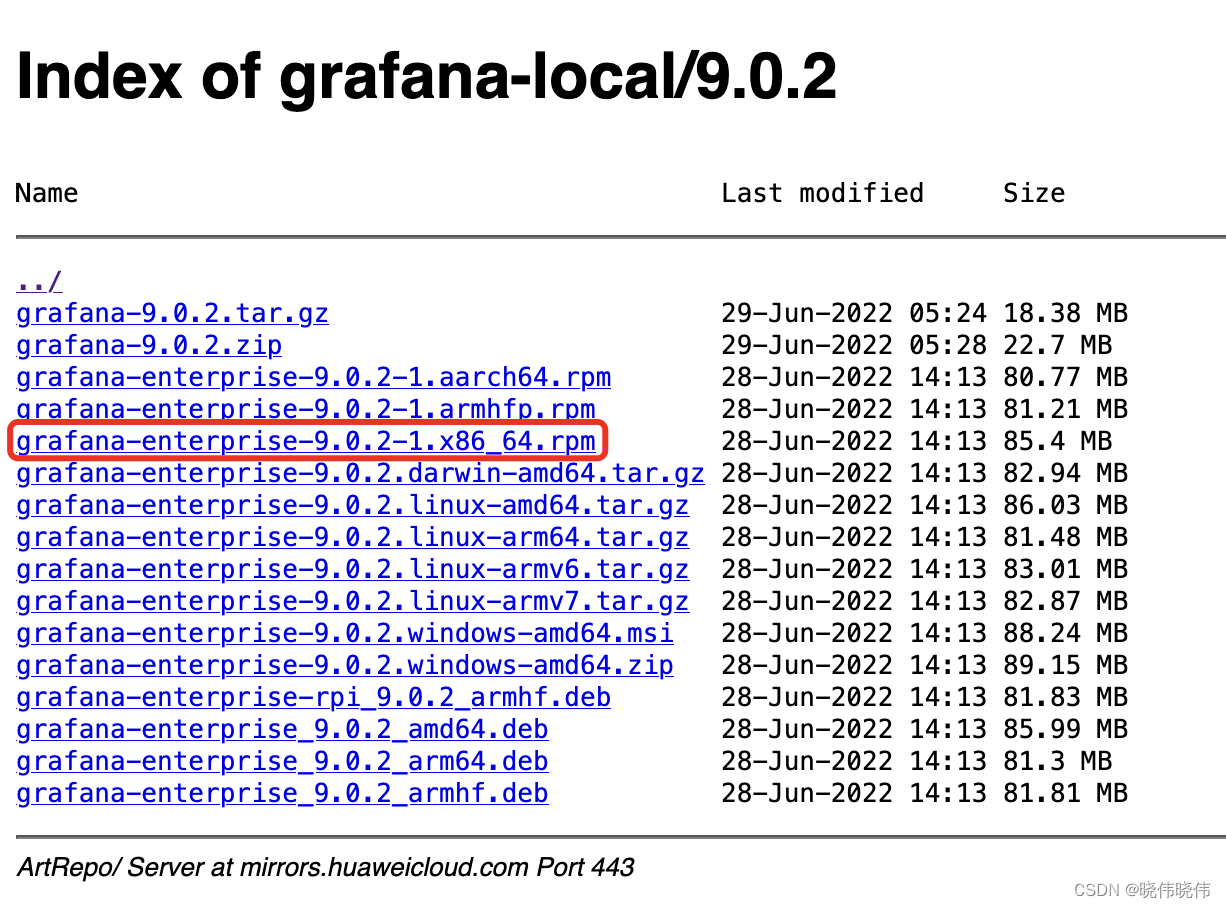
执行命令:sudo yum install grafana-enterprise-9.0.2-1.x86_64.rpm
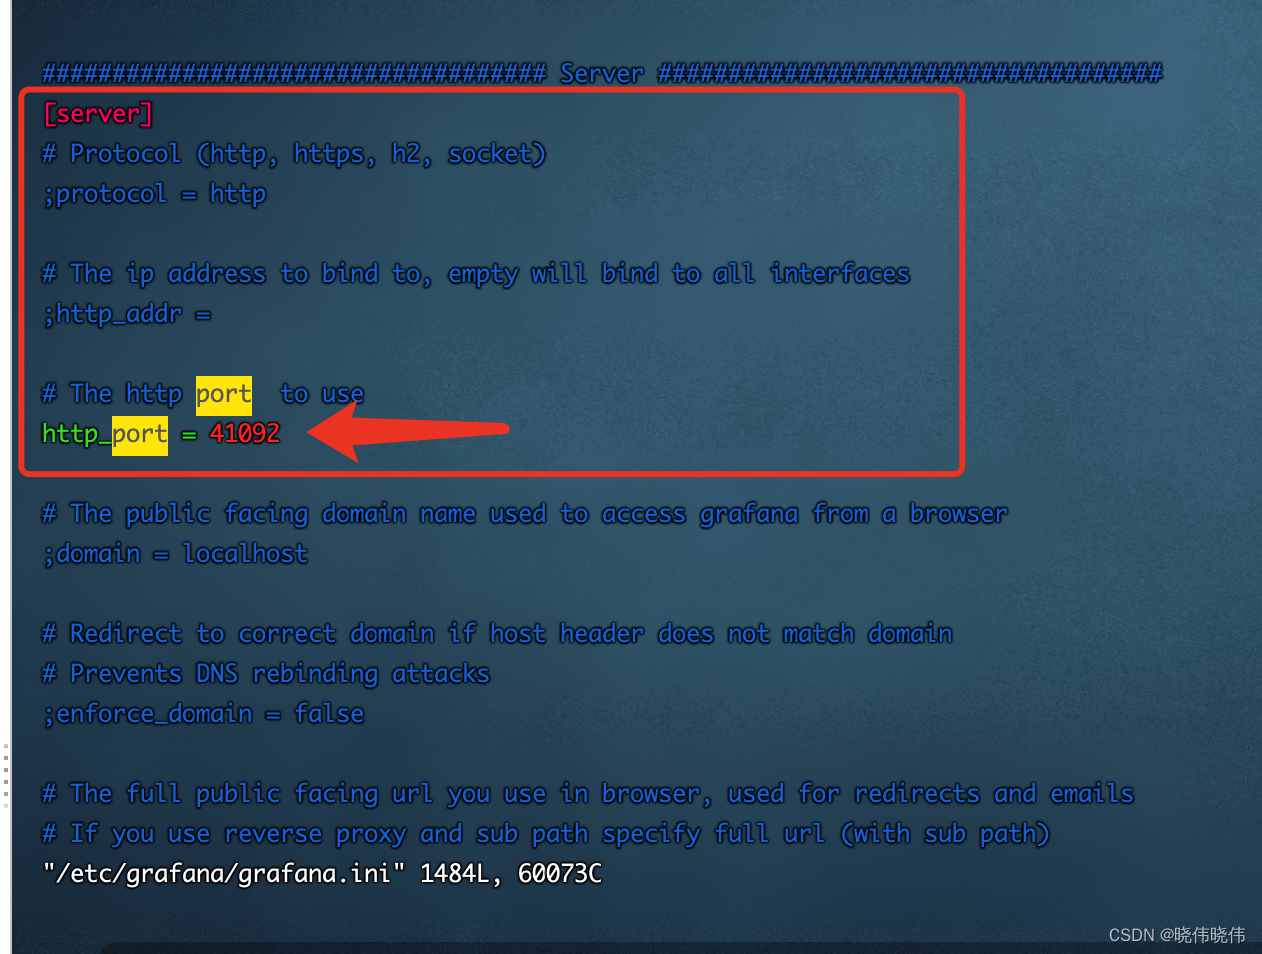
2.修改端口vim /etc/grafana/grafana.ini
以端口41092为例,vim模式下输入/port 按下n进行查找端口,将http_port改为41092,同时将前面的分号去掉
3.启动服务:
systemctl start grafana-server
systemctl enable grafana-server
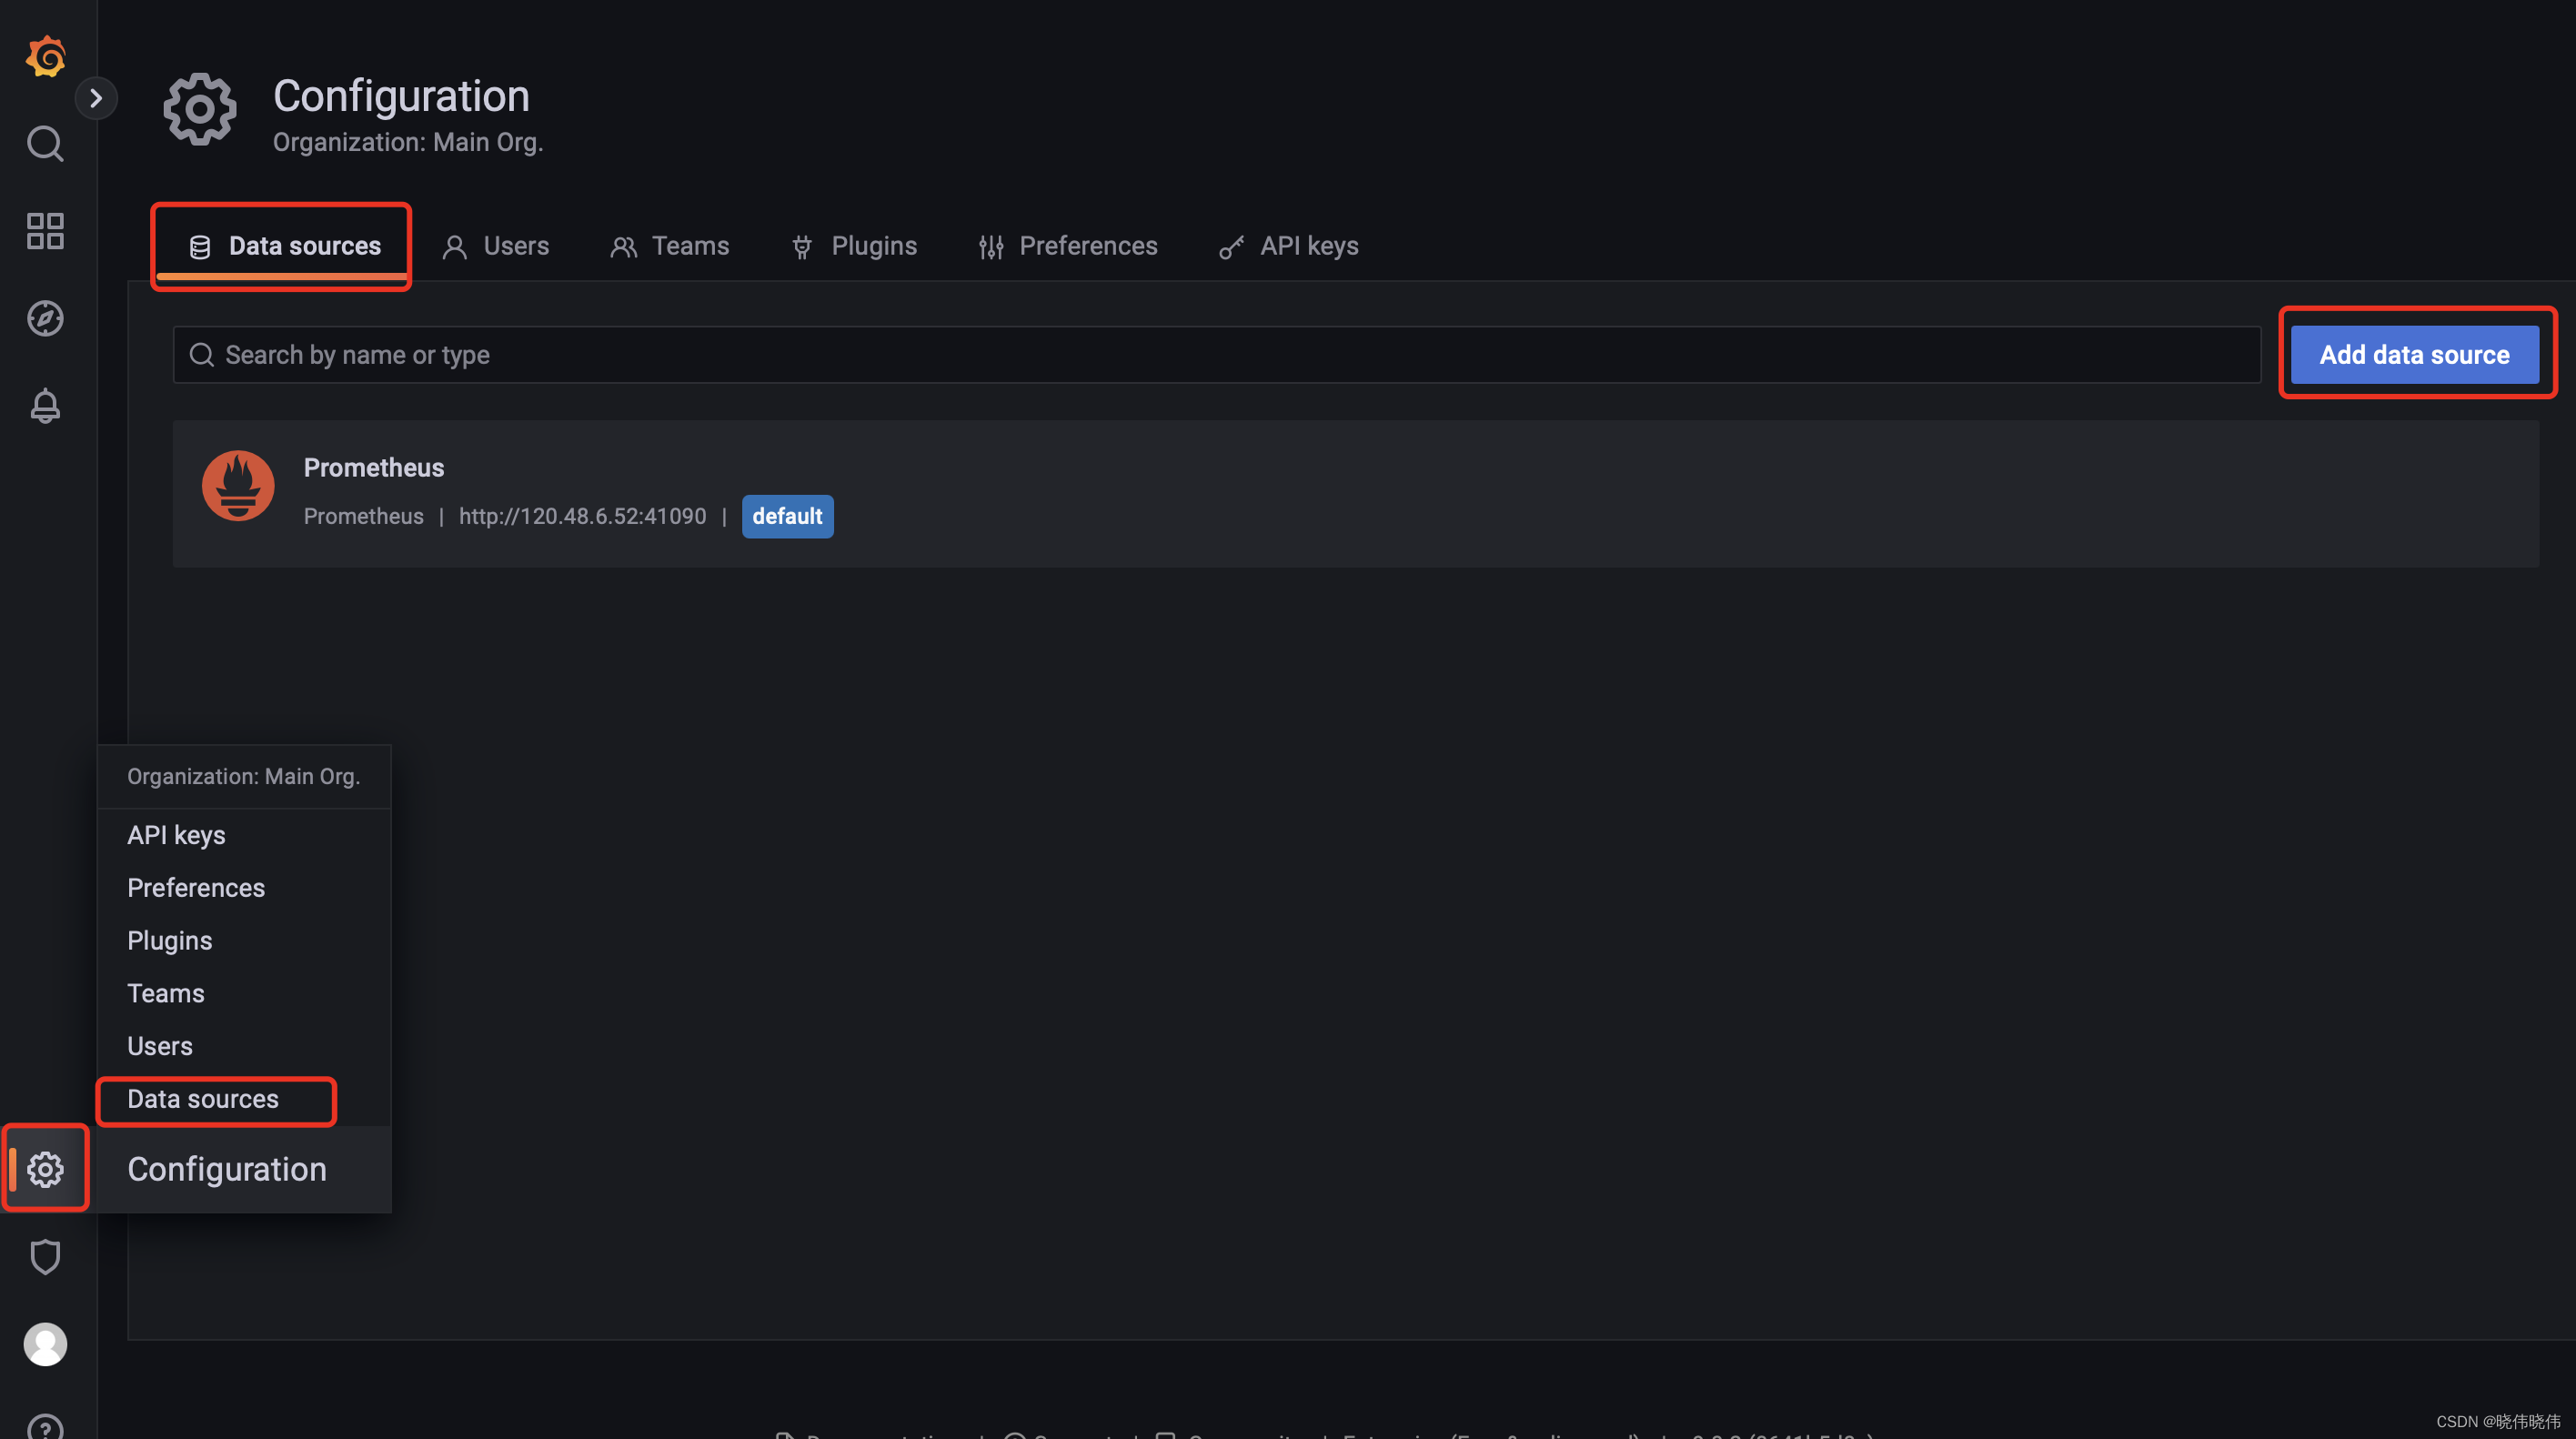
4.添加 prometheus数据源
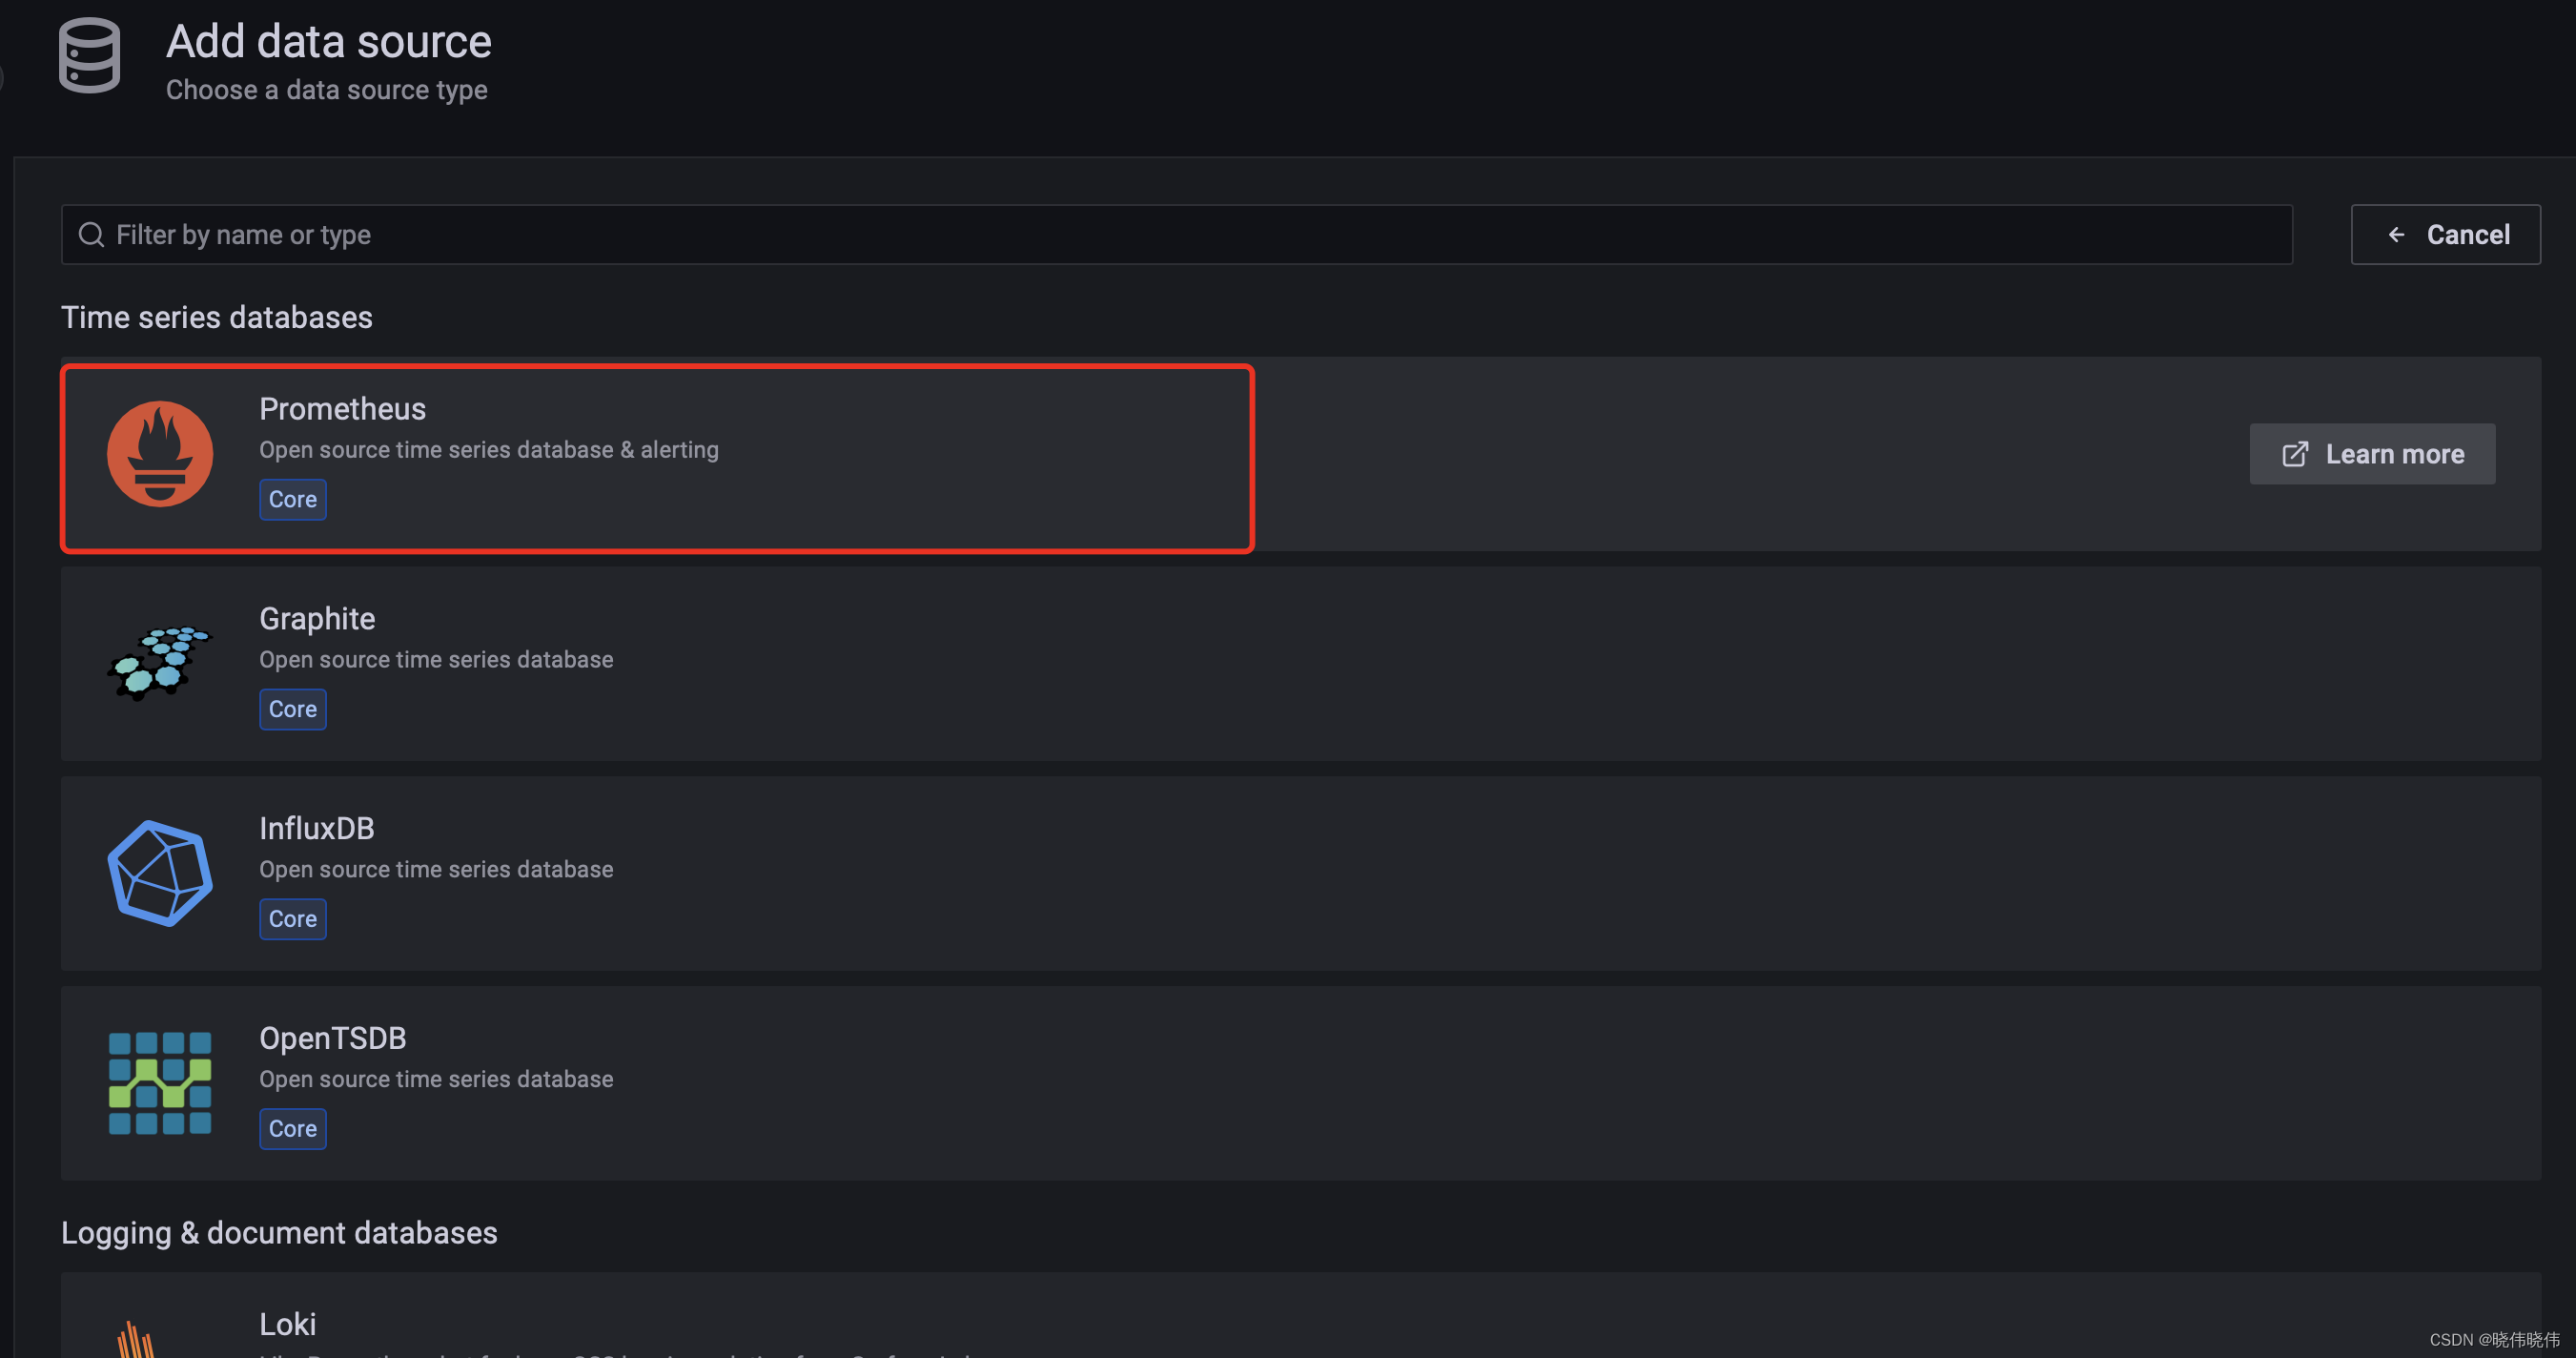
浏览器访问http://ip:41092 点击设置->Data sources->Data sources->Add data source
 点击prometheus
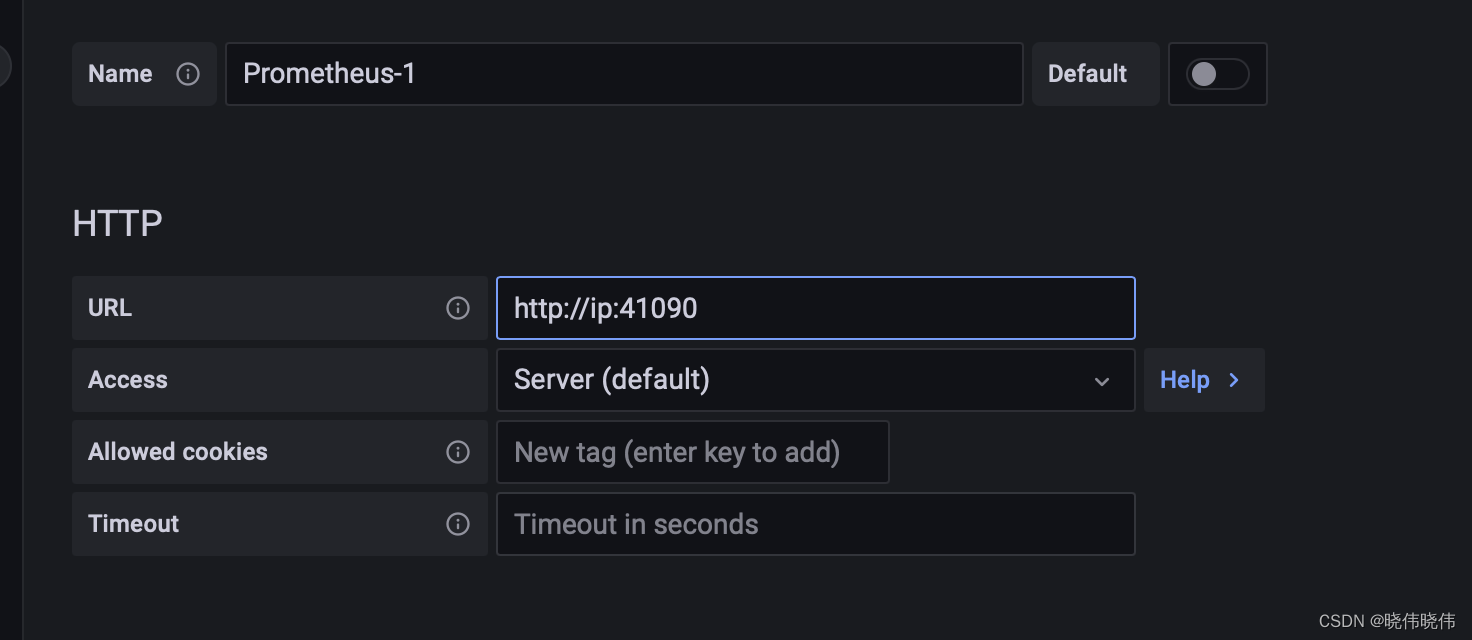
输入url后,点击最下方按钮“Save & test”
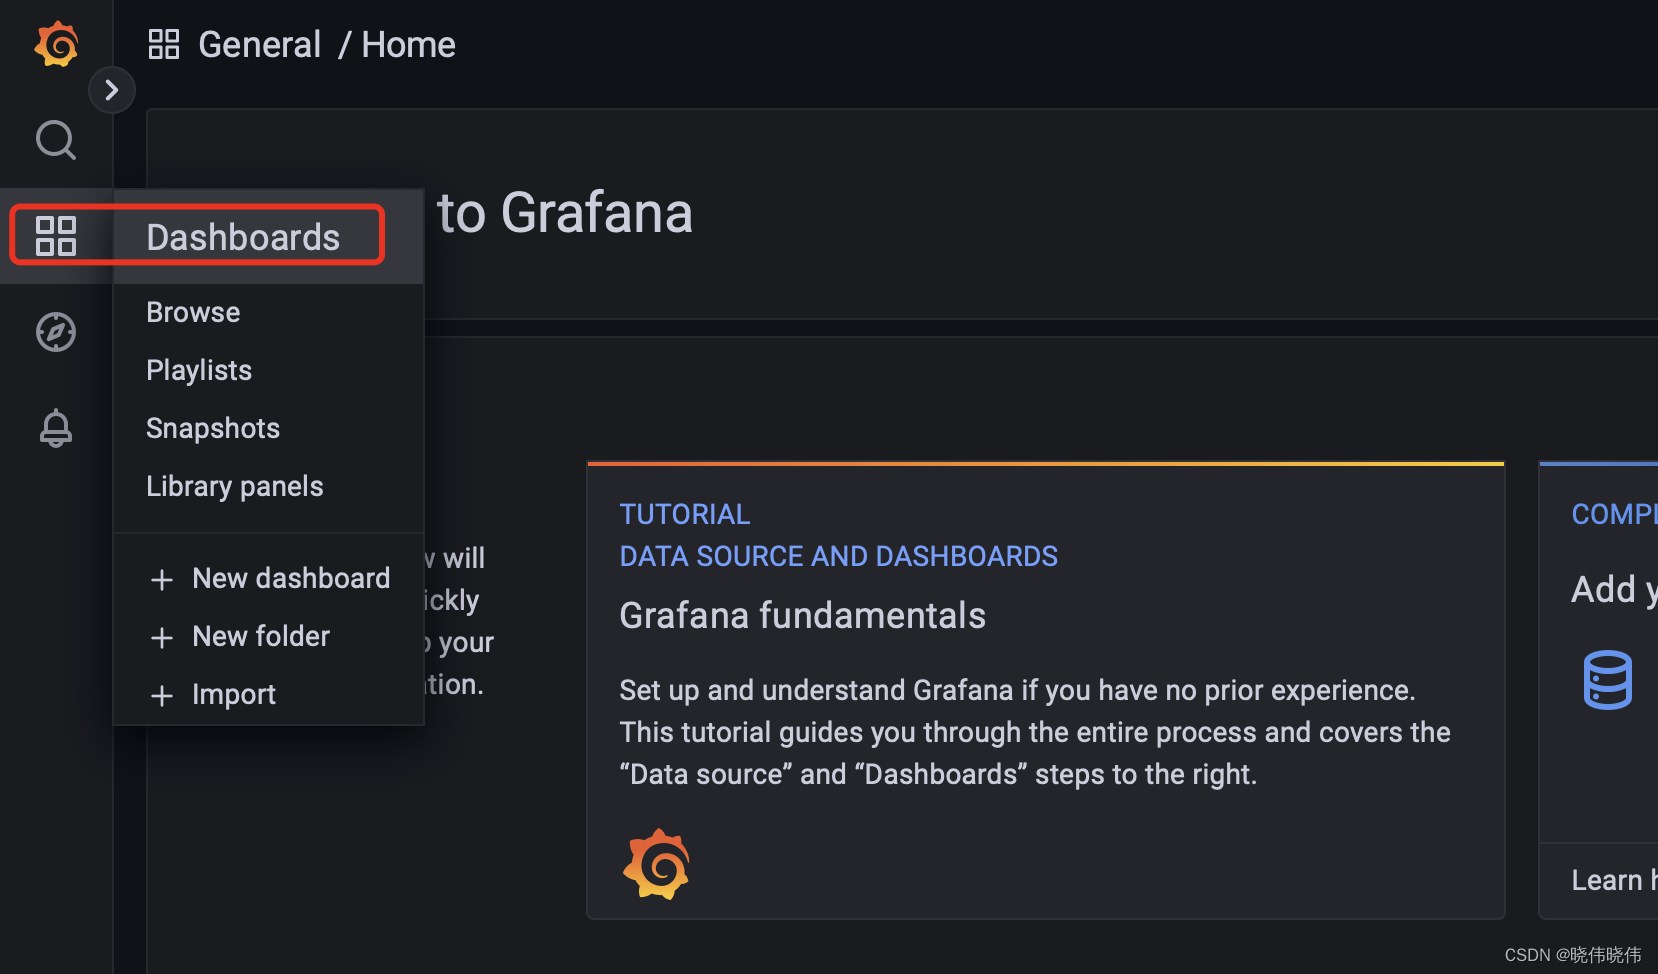
5.导入看板样式
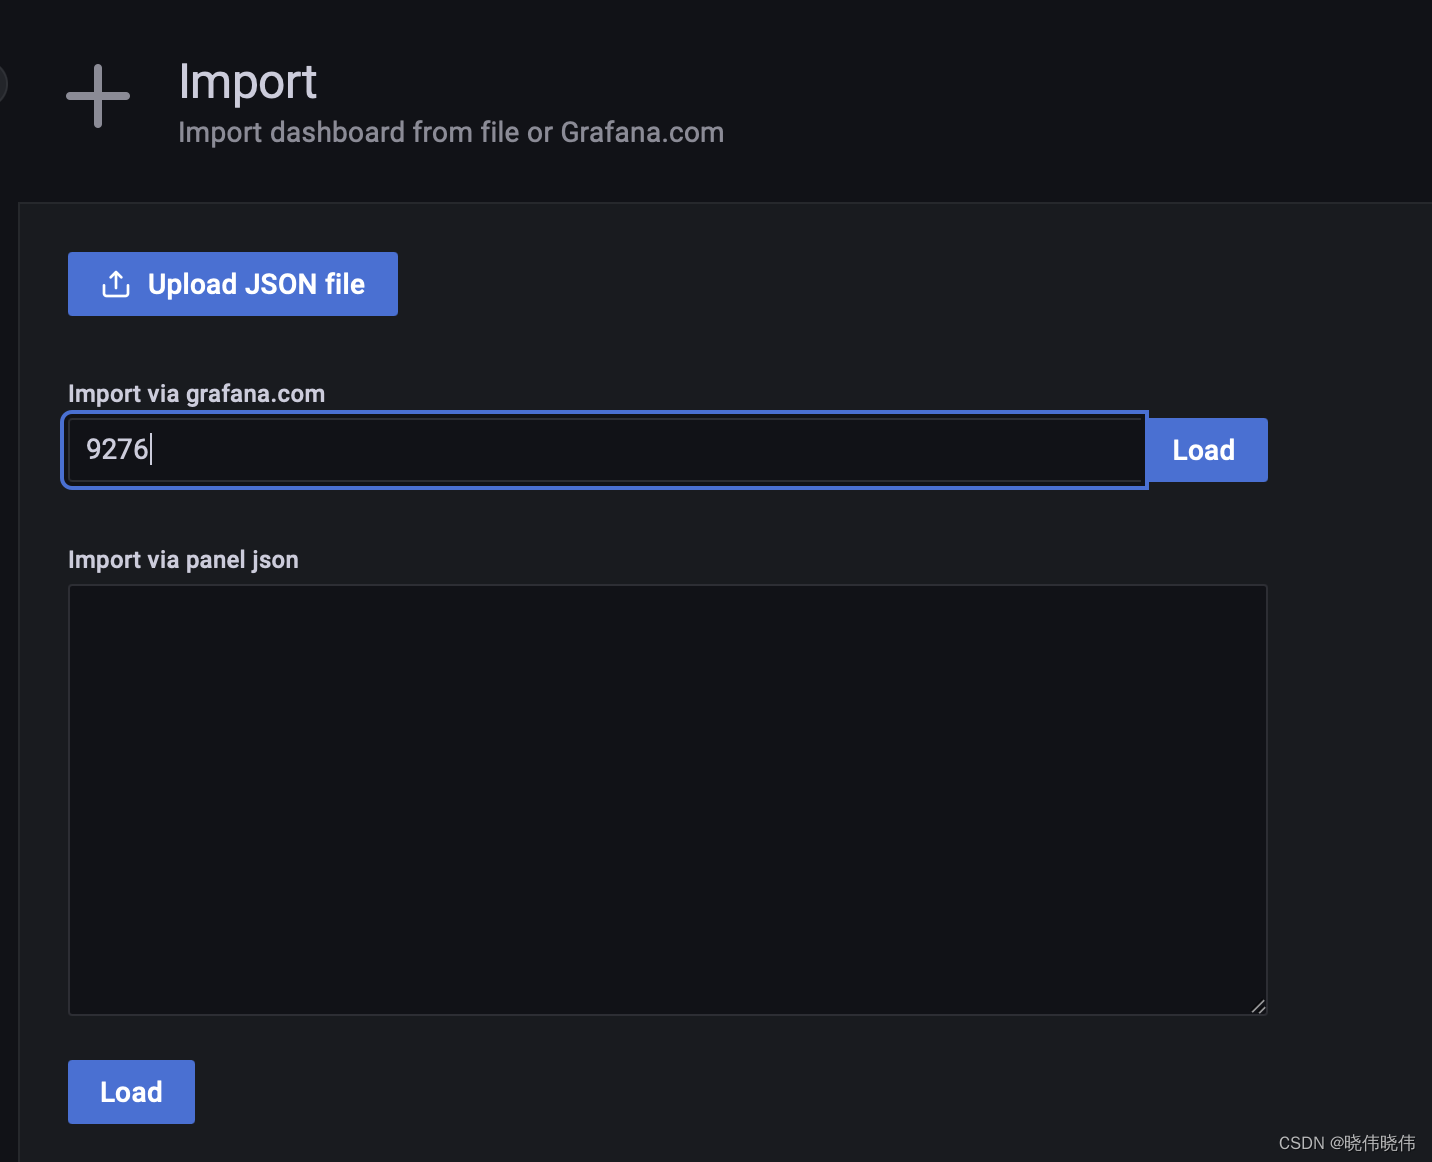
点击Dashboards,然后点击import
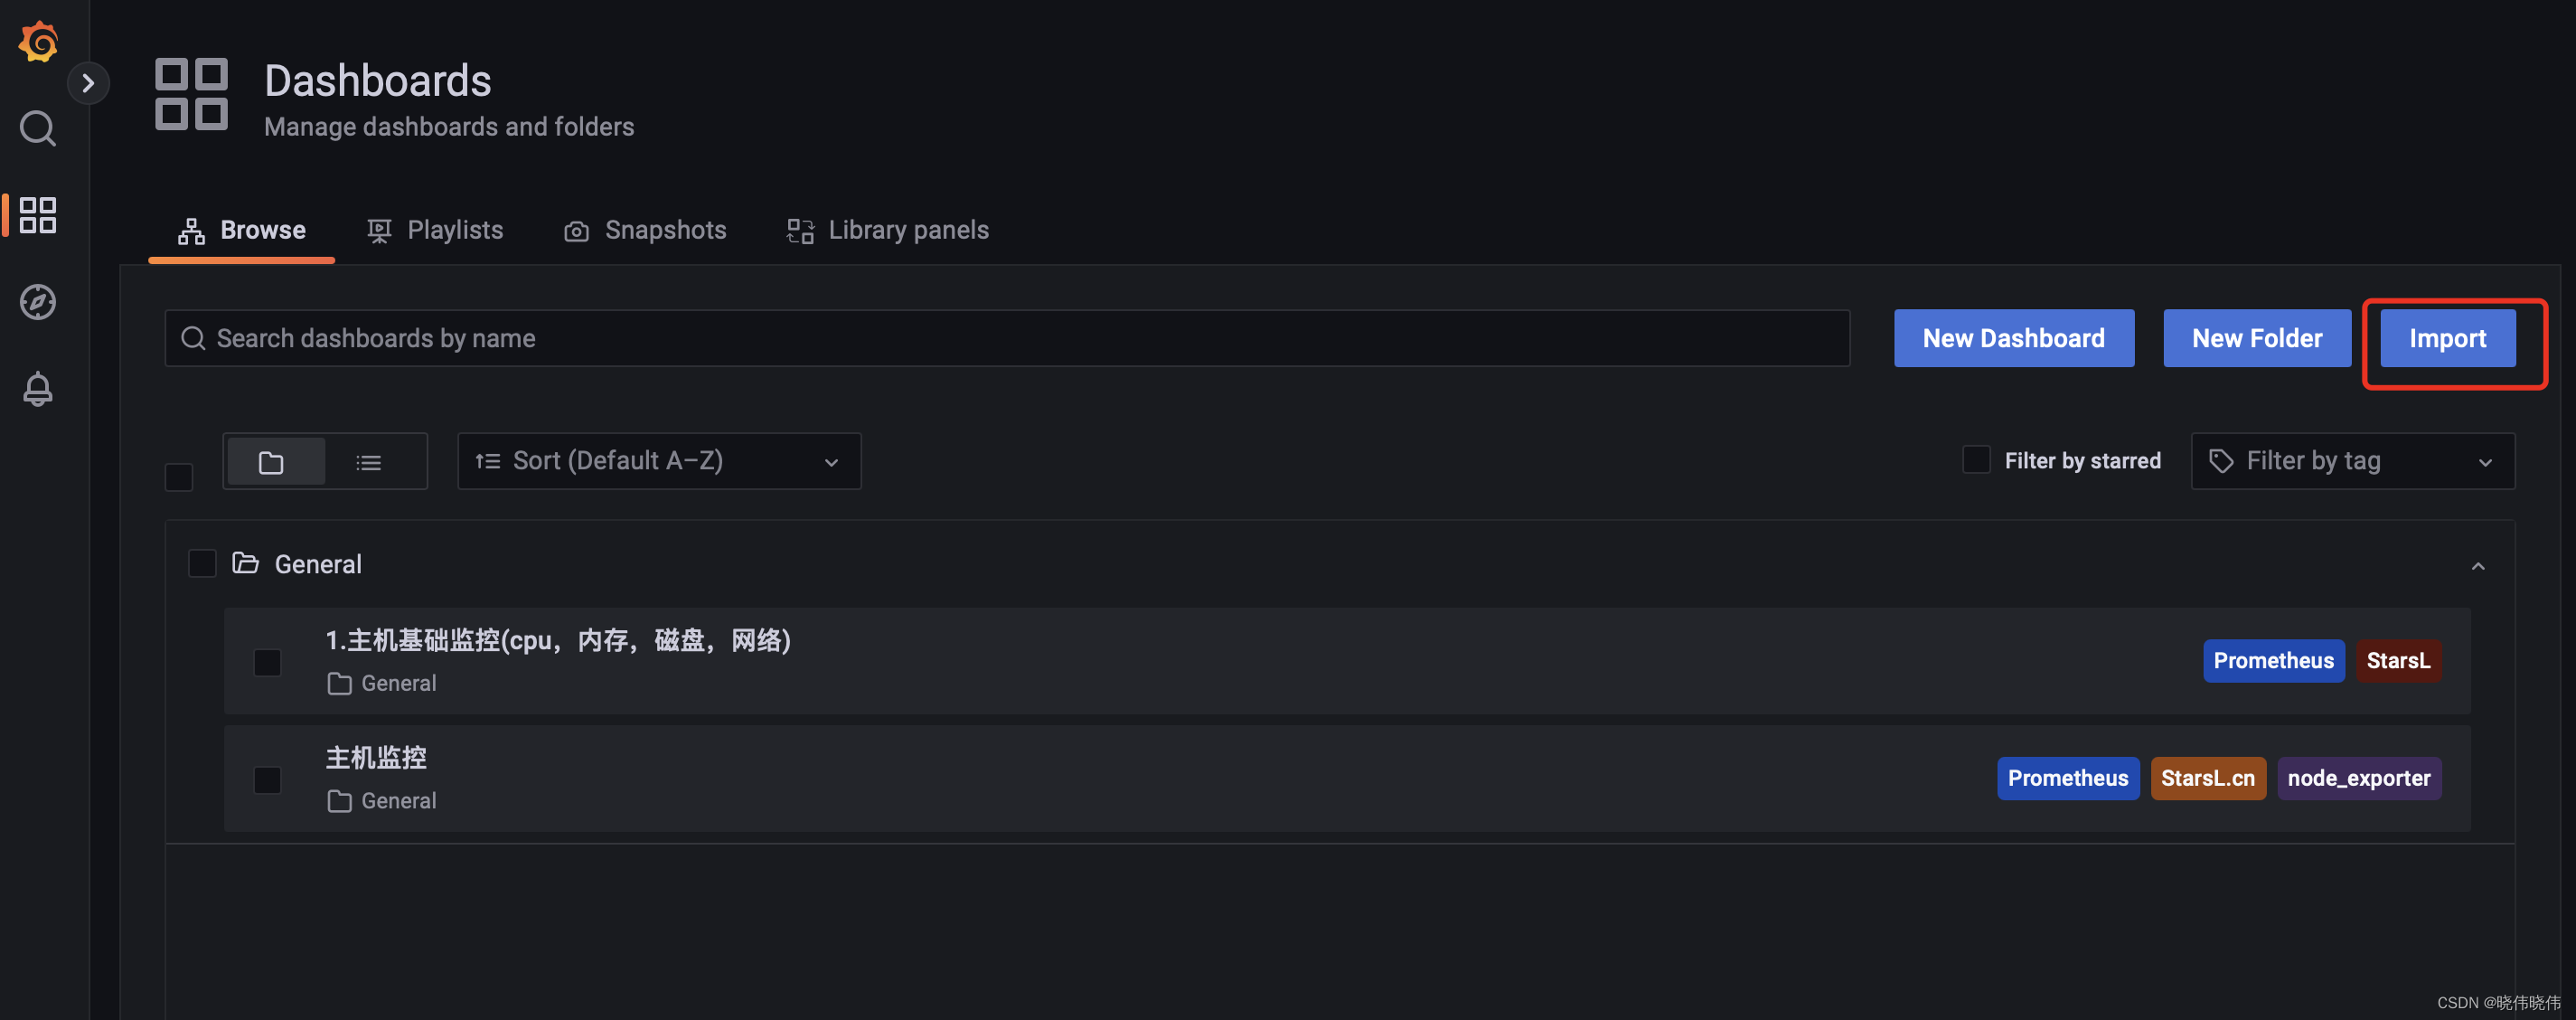
可以自己上传json file,也可以输入id导入模板样式,看板样式可以在网上或者Grafana官网进行查找。此处以9276为例,点击load
完成后进入到Dashboards可以查看采集到的信息


 被折叠的 条评论
为什么被折叠?
被折叠的 条评论
为什么被折叠?
 到【灌水乐园】发言


