


安装 Prometheus
1、在 prometheus 官网下载页面下载相关的安装包,地址如下:
https://prometheus.io/download/
wget https://github.com/prometheus/prometheus/releases/download/v2.47.2/prometheus-2.47.2.linux-amd64.tar.gz
tar -zxvf prometheus-2.47.2.linux-amd64.tar.gz
cp -R prometheus-2.47.2.linux-amd64 /usr/local/prometheus
2、设置 prometheus 系统服务,执行命令创建服务文件 vi /usr/lib/systemd/system/prometheus.service ,文件内容如下:
[Unit]
Description=Prometheus
Documentation=https://prometheus.io/
After=network.target

[Service]
Type=simple
User=root
WorkingDirectory=/usr/local/prometheus
ExecStart=/usr/local/prometheus/prometheus
Restart=on-failure

[Install]
WantedBy=multi-user.target
3、启动服务和设置开机自动启动:
systemctl daemon-reload
systemctl enable prometheus.service
systemctl start prometheus.service
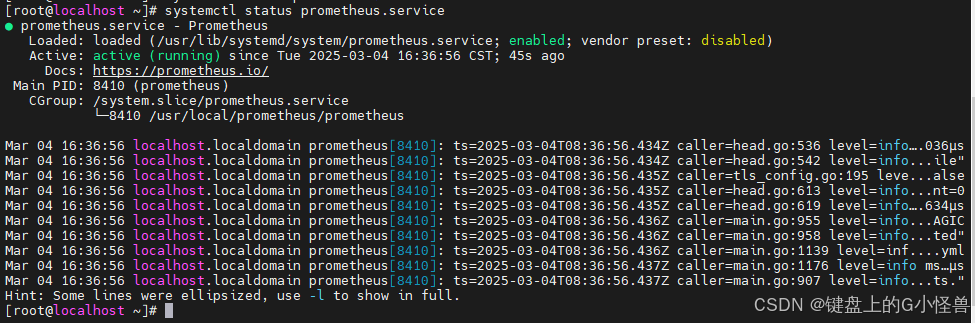
4、启动后,可以使用 systemctl status prometheus.service 命令查看状态,出现下图界面,表示启动成功:
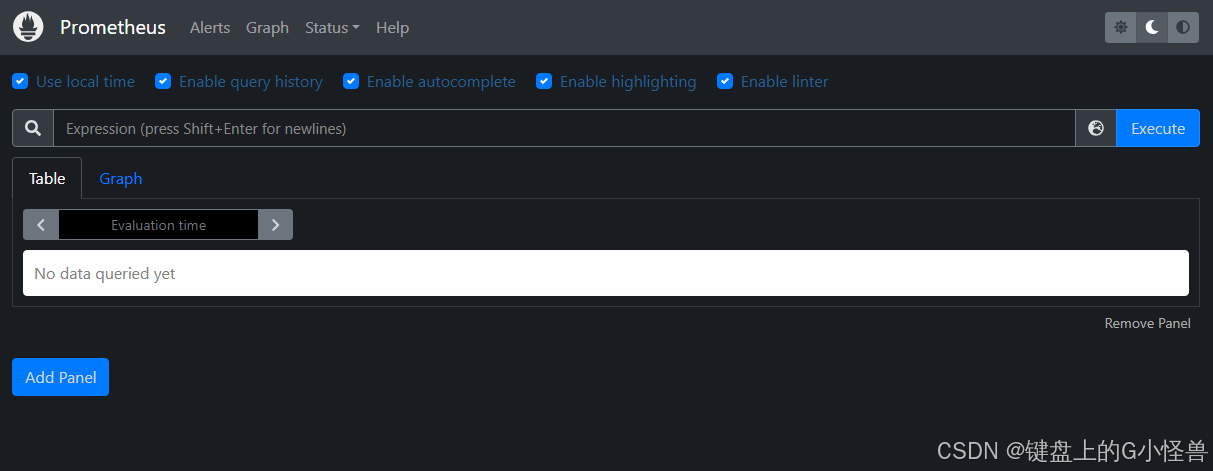
5、在浏览器访问地址:http://10.0.0.66:9090,出现下图界面,说明 prometheus 已经安装成功了。
安装 Grafana
1、在 Grafana 官网下载页面下载相关的安装包,地址如下:https://grafana.com/grafana/download
wget https://dl.grafana.com/oss/release/grafana-10.1.5-1.x86_64.rpm
yum install -y grafana-8.0.6-1.x86_64.rpm
2、启动
systemctl enable grafana-server
systemctl start grafana-server
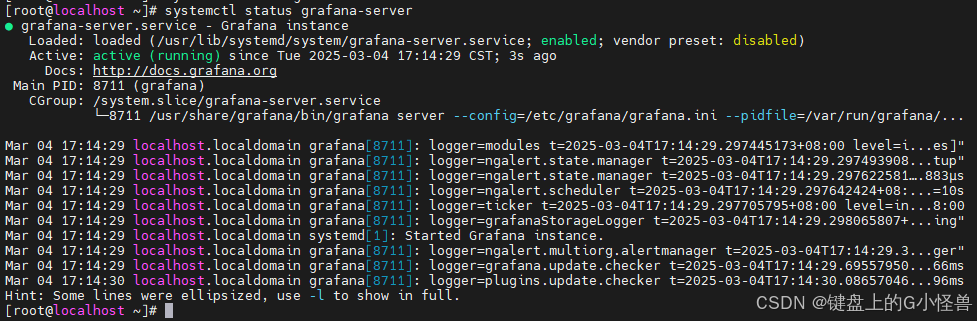
3、启动后,可以使用 systemctl status grafana-server 命令查看状态,出现下图界面,表示启动成功:
4、在浏览器访问地址:http://10.0.0.66:3000/,出现下图界面,说明 Grafana 已经安装成功了。
默认用户名admin 密码admin

客户端配置
linux
wget https://github.com/prometheus/node_exporter/releases/download/v1.6.1/node_exporter-1.6.1.linux-amd64.tar.gz
tar -zxvf node_exporter-1.6.1.linux-amd64.tar.gz
cp -R node_exporter-1.6.1.linux-amd64 /usr/local/node_exporter
设置 node_exporter 系统服务,执行命令创建服务文件 vi /usr/lib/systemd/system/node_exporter.service ,文件内容如下:
[Unit]
Description=node_exporter
After=network.target

[Service]
Type=simple
User=root
ExecStart=/usr/local/node_exporter/node_exporter
Restart=on-failure

[Install]
WantedBy=multi-user.target
修改 Prometheus 的配置文件,添加 node_exporter 的绑定,执行命令 vi vi /usr/local/prometheus/prometheus.yml
  - job_name: 'centos-1'
    static_configs:
      - targets: ['10.0.20.12:9100']
开机自动启动
systemctl daemon-reload
systemctl enable node_exporter.service
systemctl start node_exporter.service
- Job_name:随便取一个能表达意思的名称即可
- targets:node_exporter 安装后发布出来的地址
执行命令 systemctl restart prometheus 重启 Prometheus 。
在 Grafana 中添加数据源,登录 Grafana 后,在 Data Sources 模块中添加数据源


 2595
2595

 被折叠的 条评论
为什么被折叠?
被折叠的 条评论
为什么被折叠?
 到【灌水乐园】发言


