


 本文详细介绍了如何利用Struts2的debug标签、Debugging拦截器和Profiling拦截器进行Web应用程序的调试与性能分析。通过实例如何在页面中插入debug标签、配置struts.xml文件以激活拦截器并触发性能分析,从而获取ValueStack和其他对象的内容及执行时间信息,帮助快速定位和解决Web应用中的问题。
最近维护项目,控制台输出大量拦截器执行细节的日志,而且排版每行会有tab制式空格,几乎每个请求都会有这样的内容
出现,开始以为是log4j的日志输出格式没有调好,后来以为是拦截器中对方法执行的输出格式没有调好,如此往复始终找不
到原因所在,偶在网上查找原来是Struts 2的profiling拦截器设置引起的。本人一方面对自己知识浅薄而汗颜,一方面对
struts2的博大精深而赞叹,向老朋友致敬
Struts 2标签库里的debug标签以及Struts 2提供的Debugging拦截器大大简化了Web应用程序的调试工作,Profiling拦截器可以分析应用程序中的性能瓶颈。
使用debug标签获取调试信息
debug标签的用途是显示ValueStack栈和其他对象的内容,它非常易用,只需要在需要调试的页面插入如下语句:
<s:debug></s:debug>
示例:
index.jsp
<body>
    <s:debug></s:debug>
</body>
在浏览器中输入:http://localhost:8081/DebugAndProfiling/index.jsp,获得如下页面:
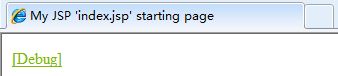
点击"[Debug]",会获得如下界面
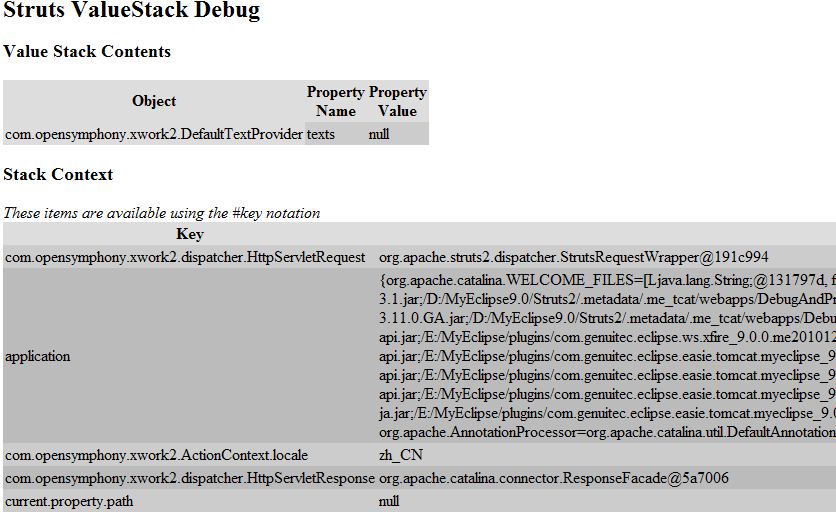
可以看到获取了各种栈对象和ContextMap里的对象。这些信息可以帮助我们快速排查Web应用程序里的潜在隐患。
使用Debugging拦截器获取调试信息
Debugging拦截器是默认拦截器栈defaultStack的一员,若引用了默认拦截器栈,则不需要特意去引用。使用该拦截器可以使我们查看ValueStack和其他一些对象内容。触发这个拦截器的方法是在用来触发某个动作的URL地址栏里添加debug=xml或者debug=console参数。
debug=xml参数将会导致产生一个XML文件,它包含ValueStack和其他一些对象的值:
示例:
input.jsp
<body>
    <s:form action="debug.action?debug=xml">
        <s:textfield name="username" label="Enter your name"></s:textfield>
        <s:submit value="submit"></s:submit>
    </s:form>
</body>
struts.xml
<struts>
    <constant name="struts.devMode" value="true"></constant>

    <package name="debugAndProfilingPackage" extends="struts-default">
        <action name="debug" class="struts2.action.DebugAction">
            <result name="success">/index.jsp</result>
        </action>
    </package>
</struts>
struts.devMode的默认值为false,需要将其修改为true,才可以使该功能生效。
动作类:
public class DebugAction extends ActionSupport {
    private static final long serialVersionUID = -1345567815879866335L;

    private String username;

    public String getUsername() {
        return username;
    }

    public void setUsername(String username) {
        this.username = username;
    }

    @Override
    public String execute()
    {
        return SUCCESS;
    }
}
index.jsp
<body>
    <s:property value="username"/>,Welcome
</body>
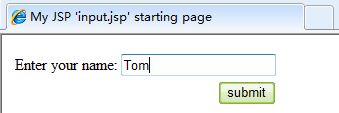
在浏览器中输入:http://localhost:8081/DebugAndProfiling/input.jsp,获得如下页面:

点击"submit"按钮,查看结果:
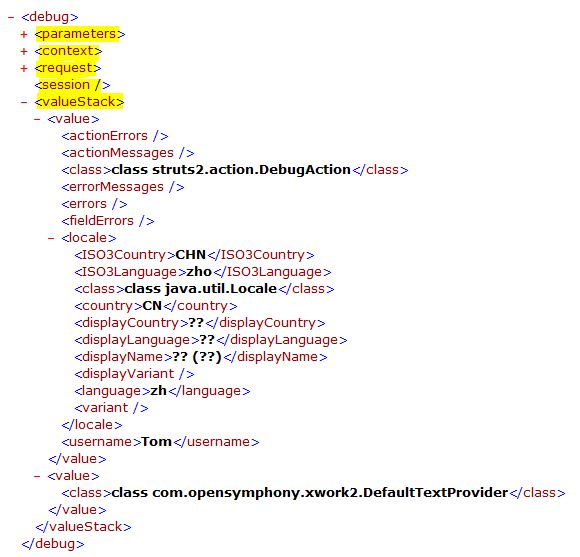
可以看到,ValueStack和其他对象的信息。debug=console的设置与xml一致,只是好像IE不支持console选项。
使用Profiling拦截器分析应用程序的性能
Struts 2自带的性能分析功能可以帮助我们找出应用程序里的瓶颈。该功能是由com.opensymphony.xwork2.util.profiling.UtilTimerStack类提供的支持,让Struts 2可以跟踪记录它的过滤器调度程序、每一个拦截器、每个动作和每个结果的执行用时情况。Profiling拦截器可以帮助我们激活性能分析功能。
激活Profiling拦截器与激活Debugging拦截器相似,也是在某个动作的URL地址里加上profiling=true或profiling=yes请求参数。还必须将struts.devMode属性设置为true才能使用这个功能,否则设置不会生效。
示例:
修改上面例子的struts.xml文件
<struts>
    <constant name="struts.devMode" value="true"></constant>

    <package name="debugAndProfilingPackage" extends="struts-default">
        <action name="debug" class="struts2.action.DebugAction">
            <interceptor-ref name="profiling"></interceptor-ref>
            <interceptor-ref name="defaultStack"></interceptor-ref>

            <result name="success">/index.jsp</result>
        </action>
    </package>
</struts>
因为profiling拦截器不属于defaultStack拦截器栈,需要特别引用,还需要注意Profiling拦截器所处的的位置,决定了它分析性能的范围。
修改input.jsp
<body>
    <s:form action="debug.action?profiling=true">
        <s:textfield name="username" label="Enter your name"></s:textfield>
        <s:submit value="submit"></s:submit>
    </s:form>
</body>
其他不用修改,在浏览器输入: http://localhost:8081/DebugAndProfiling/input.jsp,获得如下页面:
点击"submit"按钮,查看结果:
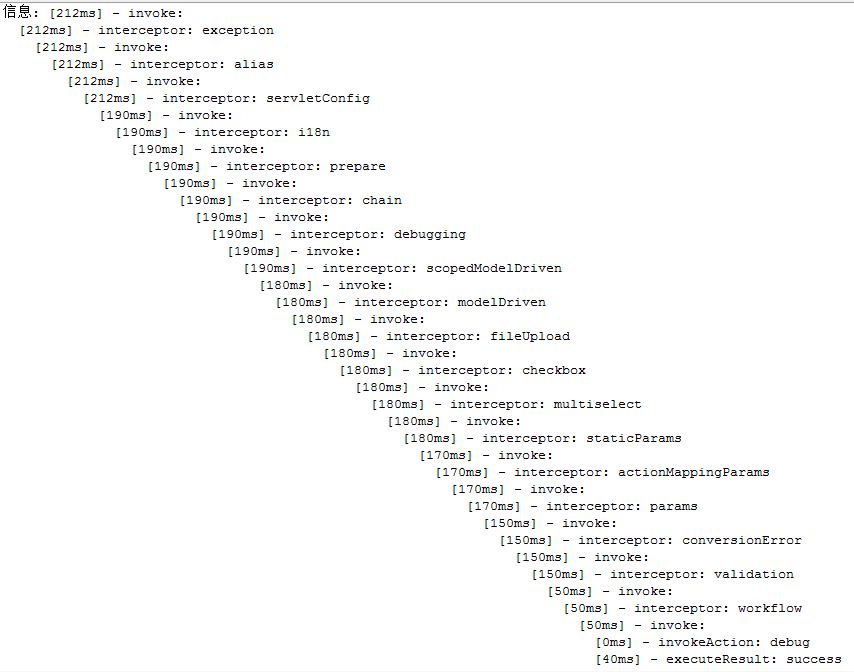
该结果是在我的IDE(MyEclipse9.0)的控制台页面获取的.可以看到我们设置的Profiling拦截器生效了,它打印出了每一个流程所花费的时间。每一行代表一个活动。每行最左边的数字是截止到即将触发这个活动时已经耗用的时间。


 206
206

 被折叠的 条评论
为什么被折叠?
被折叠的 条评论
为什么被折叠?
 到【灌水乐园】发言


