


 本文通过两个MDX查询示例讲解如何使用MDX来分析数据。第一个查询展示了如何找出每个品牌销售最好的两种产品及其在总销售额中的比例。第二个查询则演示如何高亮显示过去四个季度中销售排名后10%的品牌,通过单元格属性进行异常突出显示。
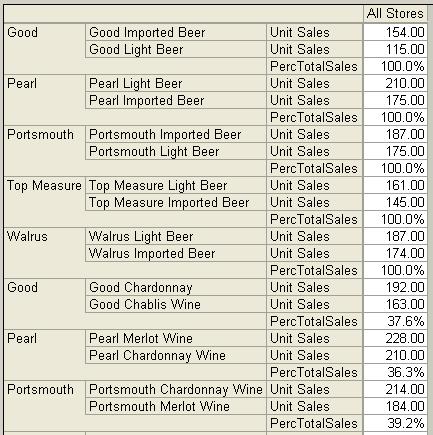
8. For each product brand, what are the two top-selling products and what percentage of total sales do they make up?
To answer this question, Listing 8's relatively complicated query uses a combination of a calculated member and the Generate() function. The calculated member determines the percentage of the brand's total unit sales that a brand's top two products make up. The Generate() function searches the list of all brands and returns a set of each brand's top two products and the percent of total value that those products account for.
查出每一种品牌销售最好的两种产品的销量额,以及分别占销售总额的百分比。
Listing8相对比较复杂,综合运用了计算成员和Generate()函数。计算成员确定了每个品牌销售最好的前两个产品占所在品牌unit sales总量百分比。Generate函数查询每个品牌并返回每个品牌下销售最好的两个产品,以及每个产品的销售额和百分比。
Listing_08.Determining Two Top-Selling Products.txt
说明:查出每种品牌
前
2
名
产品的销售记录,以及各自分别占所在品牌的百分比
with
member
[Measures].[PercTotalSales]
as
'
Sum
(
TopCount
([Product]
.CurrentMember.Children
, 2, [Unit Sales]), [Unit Sales] )
/([Product]
.CurrentMember
, [Unit Sales])',
FORMAT_STRING
= '##.0%'
select
[Store].[(All)]
.Members
on
COLUMNS
,
Generate
( [Product].[Brand Name]
.Members
,
Union
(
TopCount
( [Product]
.CurrentMember.Children
, 2, [Unit Sales] ) * {[Unit Sales]},
{ ([Product]
.CurrentMember
, [PercTotalSales]) }
)
)
on
ROWS
from Sales
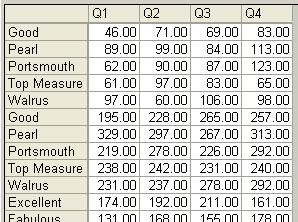
9. Show all the product brands for the past four quarters, highlighting brands that sold in the bottom 10 percent for that quarter.
Cell properties are a convenient way to perform exception highlighting (i.e., changing the font or color to draw the user's attention to important information) in a query. In Listing 9, I added the cell property FONT_FLAGS to the calculated member HLUnit Sales to boldface the unit sales numbers in the bottom 10 percent of all product brands for that quarter. Because a cell property's value can be an MDX expression, you can perform conditional logic to determine whether the font will be roman or boldface. In this case, the condition logic determines whether the current brand is in the bottom 10 percent by doing a set intersect with the full list of brands in the bottom 10 percent. If the intersect yields a count of 0, the brand isn't among the bottom members and will appear in a roman font. If the count is 1, the brand is among the bottom 10 percent, and the value will appear in boldface.
显示四个季度所有品牌的销售情况,高亮显示各个季度销售组成最少10%的品牌。单元格属性是在查询中突出展示异常数据的便捷方式(如,改变字体风格或者颜色以吸引读者对重要信息的注意)。Listing9,通过向计算成员HLUnit Sales添加单元格属性Font_FLAGS以黑体显示各个季度销售居于最低10%的品牌。由于一个MDX只能设置一个单元格属性,所以只能通过条件逻辑判断是显示罗马字体还是黑体。在本例中,使用的条件逻辑是判断当前品牌与组成最低10%的所有品牌的交集是否为空。如果产生的交集为0,说明该品牌不再组成10%的品牌中,罗马字体显示;如果交集是1,说明该品牌在这10%中,黑体显示。
Listing_09.Highlighting Products in the Bottom 10 Percent.txt
说明:查出
4
个季度中,每个时期销售量在后
10%
的产品销售量,并显示为粗体
with
set
[LastQuarter]
as
'
Tail
(
Filter
([Time].[Quarter]
.Members
,
Not
IsEmpty
([Time]
.CurrentMember
)))'
set
[Last4Quarters]
as
' [LastQuarter]
.item
(0)
.item
(0)
.Lag
(3) : [LastQuarter]
.item
(0)
.item
(0)'
member
[Measures].[HLUnit Sales]
as
'[Unit Sales]',
FONT_FLAGS
= '
iif
(
Count
(
Intersect
(
BottomPercent
( [Product].[Brand Name]
.Members
, 10, ([Unit Sales]) ),
{[Product]
.CurrentMember
})
) = 0, 0, 1)'
select
[Last4Quarters]
on
COLUMNS
,
[Product].[Brand Name]
.Members
on
ROWS
from
Sales
where
([HLUnit Sales])
cell
properties
VALUE,
FORMATTED_VALUE
,
FONT_FLAGS
FeedBack:
2006-09-20 17:03 |
liu_hying [未注册用户]
#2楼 [楼主]
2006-09-28 13:49 |
anchky[匿名] [未注册用户]
@liu_hying
SELECT {[Measures].[age]} ON COLUMNS, {
FILTER( {[行集合(如name等信息)] }, ([Measures].[age],[Measures].[age]) > 0 AND ([Measures].[age],[Measures].[age]) <= 20 ) ,
FILTER( {[行集合] }, ([Measures].[age],[Measures].[age]) > 20 AND ([Measures].[age],[Measures].[age]) < =25 ) ,
FILTER( {[行集合] }, ([Measures].[age],[Measures].[age]) > 25 AND ([Measures].[age],[Measures].[age]) <= 30 ) ,
FILTER( {[行集合] }, ([Measures].[age],[Measures].[age]) > 35 AND ([Measures].[age],[Measures].[age]) <= 40 )
} ON ROWS FROM [cube]
这样列出的是所有年龄段的人员信息。
回复 引用 查看
2006-09-30 14:12 |
liu_hying [未注册用户]
非常感谢。现在总算做出效果了。
由于我使用的java工具所以strToTupple方法总出错。没办法只好另想出路了。
后来发现它能够将每年的人数统计出来,所以就使用计算成员把每年的人数加起来。虽然比较笨但总算出来了。
贴在下面供参考,希望楼主指正:
WITH Member [Time].[20岁以下] As '[Time].[1986]+[Time].[1987]+[Time].[1988]+[Time].[1989]+...'
Member [Time].[20-30岁] As '[Time].[1976]+[Time].[1977]+[Time].[1978]+[Time].[1979]+...'
Member [Time].[30-40岁] As '[Time].[1966]+[Time].[1967]+[Time].[1968]+[Time].[1969]+...'
Member [Time].[40-50岁] As '[Time].[1956]+[Time].[1957]+[Time].[1958]+[Time].[1959]+...'
Member [Time].[50-60岁] As '[Time].[1946]+[Time].[1947]+[Time].[1948]+[Time].[1949]+...'
Member [Time].[60岁以上] As '[Time].[all Times]-[Time].[20岁以下]
-[Time].[20-30岁]-[Time].[30-40岁]-[Time].[40-50岁]'
select NON EMPTY {[Measures].[count]} ON COLUMNS,
Crossjoin({[HR_department].[All HR_departments]},
{[Time].[20岁以下], [Time].[20-30岁], [Time].[30-40岁],
[Time].[40-50岁],[Time].[60岁以上]}
) ON ROWS
from [TalentPool]
where ([dates].[20051201])
回复 引用 查看
2006-11-23 16:51 |
平凡的石头 [未注册用户]
请教!!!
with
member [shang].[nul] as '[shang].[所有 shang].[01].[0101]/[shang].[所有 shang].[01] ',FORMAT_STRING = '##.0%'
select {[Measures].[数量]} on columns,
{[shang].[所有 shang].[01],
[shang].[所有 shang].[01].[0101],shang].[nul]}
on rows
from 销售月
这个mdx我不想定义with区域,想在select里进行计算,可不可以帮我解决一下,我在网上查找如果计算全是定义了with区域,谢谢!!!
回复 引用 查看


 2784
2784

 被折叠的 条评论
为什么被折叠?
被折叠的 条评论
为什么被折叠?
 到【灌水乐园】发言


