


关于matlab中plot的一些参数
ylim_max_hori = 0.05;
ylim_max_vert = 0.1;
tt = 1:nXYZ;
subplot(3,1,1);
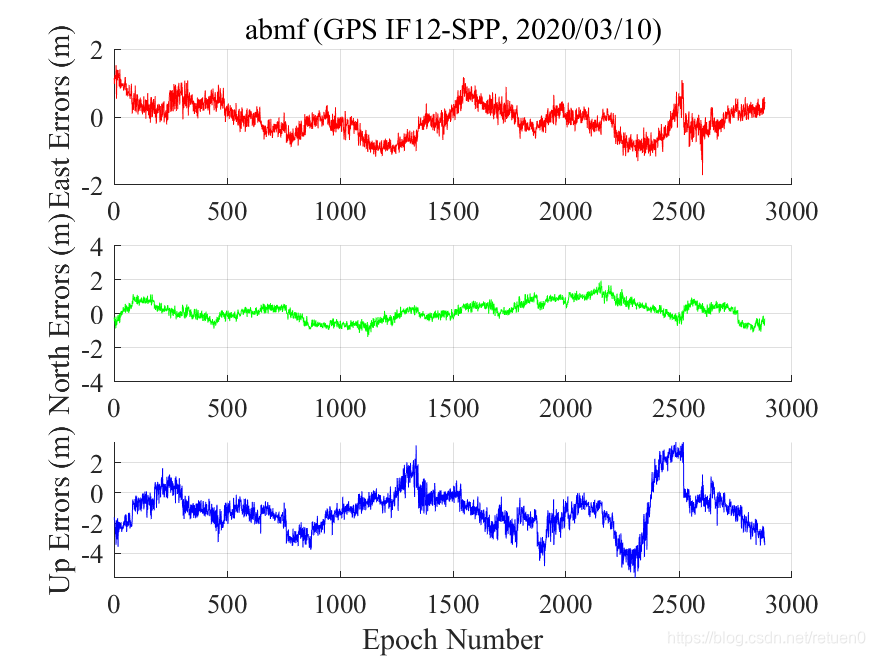
plot(tt,dENU_RTKLIB3_b34(1:end,1),'r-'); % East %,tt,dENU_GAMP(1:end,1),'g-',tt,dENU_GAMPII(1:end,1),'b-'
ylim([-2 2]);
ylabel('East Errors (m)');
strtitle = strcat(site, ' (GPS IF12-SPP, 2020/03/10)');
title(strtitle,'fontsize',12);
grid;
box;
set(gca,'FontName','Times New Roman','FontSize',13);
subplot(3,1,2);
plot(tt,dENU_RTKLIB3_b34(1:end,2),'g-'); % North ,tt,dENU_GAMP(1:end,2),'g-',tt,dENU_GAMPII(1:end,2),'b-'
ylim([-4 4]);
ylabel('North Errors (m)');
grid;
box;
set(gca,'FontName','Times New Roman','FontSize',13);
subplot(3,1,3);
plot(tt,dENU_RTKLIB3_b34(1:end,3),'b-'); % Up ,tt,dENU_GAMP(1:end,3),'g-',tt,dENU_GAMPII(1:end,3),'b-'
% ylim([-ylim_max_vert ylim_max_vert]);
xlabel('Epoch Number');
ylabel('Up Errors (m)');
grid;
box;
set(gca,'FontName','Times New Roman','FontSize',13);
代码中dENU_RTKLIB3_b34为2880*3的矩阵
成图结果:


 2万+
2万+

 被折叠的 条评论
为什么被折叠?
被折叠的 条评论
为什么被折叠?
 到【灌水乐园】发言


